

|
|
1.IntroductionLaser-tissue ablation and associated formation of microbubbles are playing an increasingly important role in biomedical and clinical applications, and are being further investigated in the fields of applied and fundamental sciences and medicine.1 For example, in laser-based microsurgery of tissue, the micron-size bubbles created during laser-tissue interaction are used to precisely cut tissues such as the cornea.2 In this paper, the laser radiation focused in tissue is nonlinearly absorbed, and the cavitation bubble is formed where the intensity of radiation exceeds the threshold of optical breakdown.3 The focus of the laser beam can be moved precisely to create a train of microbubbles—the desired sequence of accurately positioned laser-induced microbubbles forms cutting lines and surfaces in soft tissues.2 An ideal cut consists of uniformly positioned laser-induced microbubbles of similar size. However, depending on the duration of the laser pulse, cavitation bubble formation is highly dependent on the linear and nonlinear initiation of ionization and plasma-mediated optical breakdown, which may result in a wide distribution of bubble sizes.4, 5 In addition, the location of cavitation bubbles can also vary due to the variation in tissue optical parameters. Lastly, the evolution of the bubble and its final size depend on the properties of the material where the bubble is formed6 and also may be affected if a surface is located near the bubble.7, 8 To create the desired pattern of microbubbles in tissue, the rapid assessment of the cavitation bubble’s location and size is necessary. Therefore, there is a need for a remote, noninvasive, high temporal and spatial resolution method capable of detecting and monitoring each laser-induced microbubble in real time. To detect and characterize laser-induced microbubbles in water, cell cultures, or thin layers of tissues, optical methods are traditionally used.9 These methods include bright-field and phase-contrast time-resolved imaging10 of the cavitation bubble or stroboscopic photo-picturing,11 and they can be used to monitor cavitation bubble expansion and shock wave emission at different stages of the microbubble evolution. Laser-induced cavitation microbubbles can also be characterized using methods based on light scattering.12, 13 These approaches demonstrate good agreement between theory and experiments.14 Optical methods are able to characterize single bubbles, but light scattering in tissues can sharply decrease the accuracy of these methods. Differences in the electrical properties of gases and liquids and therefore the measurements of an electrical impedance of a medium, can be utilized to assess phase transitions in the medium.15 As reported in Ref. 15, the electrical measurements acquired at the boundary of a volume of interest were employed to reconstruct the distribution of electrical impendence in this volume and to assess the phase distribution in liquids. This method is suitable for continuously monitoring the bubble distribution and characterization in a multiphase flow, but it requires the application of high-frequency electrical pulses that could be unacceptable for monitoring laser-induced microbubble formation in vivo. Furthermore, the electrodes must be embedded into the medium, so this method is inherently invasive. Ultrasound can be utilized to measure microbubbles in liquids as well. For instance, the acoustic bubble spectrometer can extract a population of bubbles using the measurements of attenuation and phase velocity.16 In this approach, a train of ultrasound pulses (typically 5 to 10 cycles each) characterized by different preselected central frequencies was sent by a transmitting hydrophone while a receiving hydrophone detected these pulses after they interacted with the bubbly liquid. The measured signals were then used to reconstruct the bubble size distribution and the motion velocity. The limitations of this method are the locations of the source and the detector as well as the reduced spatial resolution. Indeed, in this transmission-based method, bubbles must be located between the acoustic transmitter and the receiver, thus making the practical implementation of this approach difficult. To overcome this limitation, the inverse acoustic scattering method could be used to estimate the distribution of bubble sizes, since the acoustical cross-section of a bubble is three to four orders of magnitude greater than its geometrical cross-section.17 In this method, the measurements of ultrasound scattered from the bubbles are employed where either the same ultrasound transducer or adjacent acoustic source and detector can be used. Unfortunately, these acoustic-based methods cannot be utilized directly to characterize laser-induced microbubbles because these methods do not allow precise measurements of the position of the cavitation microbubbles. Moreover, these methods are employed in liquids, especially in water where ultrasound scattering in the medium itself does not affect the accuracy of measurements. Finally, since a single measurement may take several milliseconds, these methods are not appropriate to monitor fast temporal processes such as microbubble expansion and collapse, especially when microbubbles are formed by a femtosecond laser.9 During a laser-tissue interaction, a rapidly expanding plasma is formed and a shock wave is generated that propagates spherically away from the photodisruption site.18 The shock wave is quickly converted into an acoustic wave during its propagation through a tissue.9, 19 Using a high-frequency ultrasonic sensor, the broadband acoustic signal emitted from the laser-tissue interaction site can be detected, thus indicating the formation of a cavity and a subsequent small bubble. This bubble will then undergo passive oscillations until it reaches equilibrium. 6, 7, 8, 20 In addition, gas bubbles are excellent ultrasound reflectors,21, 22 and the temporal dynamics of the cavity evolving into a gas bubble can also be detected using a high-frequency ultrasonic system operating in pulse-echo mode. A method utilizing the detection of both passive acoustic emission and active pulse-echo ultrasound was used to observe the behavior of laser-induced microbubbles in water.23 The cavitation bubbles were induced by a sequence of femtosecond laser pulses. The passive acoustic emission was used to confirm the formation of microbubbles and to assess the threshold of the optical breakdown. In addition, the cavity formation and translational motion of the bubble were observed using active ultrasound pulse-echo probing. It was demonstrated that passive and active ultrasound can be used to examine laser-induced microbubbles, but no characterization of the cavities was performed. In this paper, we demonstrate that it is possible to estimate the location of laser-induced cavitation bubbles and to monitor their spatial and temporal behavior using a quantitative ultrasound method. This method is based on the detection of both passive acoustic emission from the initial formation of a cavity and active ultrasound pulse-echo probing of the cavity or bubble. We use the term “cavity” here to describe the initially formed void that does not contain a permanent gas phase, i.e., it is either empty or contains vapor. As the cavity expands, gas may diffuse in from the medium and a cavitation bubble is formed. Nevertheless, for ultrasound pulse-echo measurements, there is no significant difference in reflectivity between the cavity and the gas bubble. In our studies, the microbubbles were created using nanosecond laser pulses. The arrival time of passive acoustic emission together with time-of-flight measurements of pulse-echo signals can be used to calculate both the initial location and the size of the cavitation bubble. A single-element, high-frequency, focused ultrasound transducer was used to detect the acoustic emission. The same ultrasound transducer was also used to transmit short ultrasound pulses into the medium and to detect the reflected echo signals from the cavity or bubble. The position of origin of the cavity was estimated from the arrival time of the passive acoustic emission generated during the cavity formation. Comparing the temporal parameters of the acoustic emission and the ultrasound pulse-echo signals reflected from the bubble, we obtained the size of the cavitation bubble, which allowed temporal and spatial monitoring of a single microbubble. The developed ultrasound method was first verified by comparing the results of ultrasound measurements of the bubble size with direct and independent optical measurements of the microbubble formed in a gel sample. Then the ultrasound measurements of both the laser-induced cavity formation and the dynamic behavior of the microbubbles were compared with theoretical estimates obtained using the Rayleigh model of cavity collapse. Overall, the results of ultrasound measurements were in good agreement with both optical measurements and theoretical estimates. 2.Materials and Methods2.1.Experimental SystemA schematic view of the experimental setup is shown in Fig. 1 . The cavitation bubbles were generated inside of a -high water cuvette measuring at the square-shaped base. At the bottom of the cuvette, a -thick microscope cover glass was mounted to allow unobstructed penetration of the laser radiation into the tank. A Q-switched pulsed Nd:YAG laser (Polaris II, New Wave, Inc.) with a second harmonic generator ( wavelength) was employed. The pulse duration was , the energy per pulse was , and the repetition rate was . This low repetition rate was chosen to allow the previous microbubble to disappear before the next cavity would form at the same location. The laser beam was focused using a 20x micro-objective lens with a numerical aperture (NA) of 0.40. To provide an optical contact between the objective and the optical window, a small quantity of glycerol was utilized. A single-element transducer (Panametrics-NDT, Inc.) with a focal length, an -number of 2, a center frequency, and a 40% fractional bandwidth was used both to detect an acoustic emission and to acoustically probe the cavitation bubble. The foci of the objective and the ultrasound transducer were aligned prior to experiment. Using a single laser pulse, the cavitation bubble was formed approximately above the glass surface. One of the lateral sides of the water cuvette was equipped with an additional microscope slide (not shown in Fig. 1) to photograph the microbubbles. All components of the experimental system, including the pulsed laser, an ultrasound pulser-receiver interfaced with the ultrasound transducer, an analog-to-digital (A/D) digitizer (Gage Applied, Inc.), a function generator, and a time-delay device, were synchronized and controlled by a computer. Fig. 1Schematic view of the experimental setup. The microbubbles were produced in a water cuvette using a 5-ns laser beam focused by an objective lens through the optical window at the bottom. The ultrasound transducer, positioned at the top, was aligned with the laser beam such that the cavity was located approximately at the focus of the transducer. 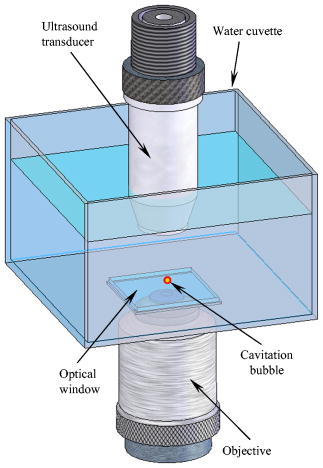 In passive mode, acoustic signals generated during laser-induced cavity formation and bubble collapse were detected and recorded. In active mode, the ultrasound transducer sent short ultrasound pulses into the medium and received the ultrasound echo signals reflected from the bubble. We used both passive and active modes together to detect and monitor the behavior of the gas bubble. Once detected by the transducer, the signals were preamplified and recorded using a 12-bit A/D digitizer operating at a sampling rate. To probe the cavitation bubble at different times, we used a function generator (model 33250A, Agilent, Inc.) to introduce a user-defined variable delay between the ultrasound and laser pulses. 2.2.Characteristics of Ultrasound SignalsThe recorded ultrasound radiofrequency (RF) signal contained mainly three types of signals: acoustic signatures corresponding to initial cavity formation, ultrasound pulse-echoes from the cavitation bubble, and bubble collapse. Figure 2 presents typical ultrasound RF data that consists of these three parts. The first part, located within the 0 to range, contains signals related to passive acoustic emission from the laser-induced cavitation bubble during its formation. The first peak near is associated with the laser pulse itself. The energy of light that was not utilized in the formation of the cavity was converted into heat in the coating of the transducer, and an acoustic wave was generated there. The other signals in the first part are related to the laser-induced cavitation bubble. These signals disappeared when the laser beam was blocked mechanically while no other changes were made to the experimental setup, confirming that they originated from the bubble itself. The second large signal at approximately corresponds to the shock wave that originated at the site of the laser-tissue interaction and propagated toward the transducer. Since the shock wave propagated spherically, the third ultrasound signal, around , corresponds to the same shock wave that reached the transducer after it was reflected from the optical window at the bottom of the water cuvette. The small-magnitude signals within the 20 to range are multiple reflections of the same shock wave traveling between the transducer and the optical window of the water cuvette. Fig. 2Typical ultrasound RF data record containing both passive and active acoustic signals that correspond to initial cavity formation, ultrasound pulse-echo probing of the bubble, and bubble collapse.  The second part of the record contains the group of signals located within the 50 to range. These signals correspond to the active ultrasound pulse-echo probing of the cavitation bubble. In this particular case, the ultrasound pulse was sent after the laser shot, and therefore after the cavity formation began. The first signal in this group, located at approximately , is a signal produced by the pulser itself and indicates when the ultrasound pulse was sent. The second and third signals, located at approximately 65 and , represent the ultrasound pulse reflected from the top surface of the cavity (i.e., the surface closer to the transducer) and the optical window, respectively. Finally, the third part of the recorded ultrasound signals, located within the 90 to range, corresponds to the cavity collapse identified by the second passive acoustic emission from the cavity during its collapse. There is also the directly propagated acoustic emission recorded around , and the reflection of this emission from the optical window at . The structure of the signals in this group is similar to those in the first group, although the magnitude of the second shock wave is smaller than the first shock wave. Together, the cavity expansion and collapse define the lifespan of the cavity (Fig. 2). 2.3.Estimation of Location and Size of the Cavitation BubbleOnce the laser beam is focused into the tissue and the threshold fluency of laser-induced optical breakdown is reached, high-density plasma is produced at the site of the laser-tissue interaction. Consequently, a shock wave is generated from the origin of the optical breakdown. The high-density plasma expands very rapidly and becomes a cavitation bubble.18 The cavitation bubble itself does not affect the propagation of a shock wave because the shock wave travels faster than the edge of the expanding bubble.18 The time of the shock wave arrival can be used to estimate the location of the laser-tissue interaction based on a time-of-flight principle of distance measurement. This location may be considered as the center of the cavitation bubble. Furthermore, the ultrasound pulses, sent into the medium with a desired time delay, are reflected from the top surface of the bubble (Fig. 2). Therefore, using time-of-flight measurements and accounting for round-trip propagation of the ultrasound pulses, we can assess the position of the propagation surface of the cavitation bubble. Finally, combining these measurements, we can estimate both the location and the size of the cavitation bubble. Figure 3 demonstrates this approach. Figure 3a describes schematically the properties of a laser-induced cavitation bubble (not drawn to scale) at a certain stage of its evolution. The other graphs in Fig. 3 are the corresponding parts of the RF signal shown in Fig. 2. Figure 3b shows the signal generated by the laser itself and the passive acoustic emission signal located at approximately . This laser signal can be used as a reference so, the distance from the origin of the cavity to the ultrasound transducer can be calculated as follows: where is the speed of sound in water (taken as ), and is the arrival time of the acoustic (shock) wave emitted from the center of the cavitation bubble.Fig. 3(a) Schematic view of the laser-induced cavitation bubble and definition of parameters describing its size and location. (b) Arrival time of the acoustic (shock wave) emission from the cavitation bubble and (c) the time of flight of the pulse-echo ultrasound can be used to determine the origin and size of the bubble. In these measurements, the laser and the ultrasound pulses are used as reference points, so the estimations are relative to the transducer. However, any stationary object such as an internal boundary (optical window at the bottom) also can be used as a reference point. In this case, the instantaneous radius of the bubble can be determined based on both (d) time delay between shock wave emitted from the cavitation bubble and the reflection of the shock wave from the optical window and (e) time delay between pulse-echo signals from bubble surface and the optical window.  Figure 3c shows the signal from the ultrasound pulser (located near ) and the pulse-echo ultrasound signal of the active ultrasound probing of the cavitation bubble (located at approximately ). As in the previous case, this signal from the pulser can be used as a reference. The ultrasound pulsed wave sent by the transducer is reflected from the top surface of the cavitation bubble, i.e., the surface that is closer to the ultrasound transducer. Therefore, the distance between the transducer and the surface of the cavitation bubble can be estimated as follows: where is the time of flight of the pulse-echo signal. Equation 2 accounts for the round trip of the ultrasound wave traveling from the transducer to the cavitation bubble and back to the transducer. Note that the time of flight is a relative measurement, so, it is independent of the user-defined time delay between the laser and ultrasound pulses. Generally, the time delay needs to be chosen to probe the cavitation bubble at the desired time point of its evolution. Alternatively, a sequence of pulses with a high pulse repetition rate can be used to discretely probe its formation and dynamics. In our studies, we have used variable time delays to assess the temporal behavior of the bubble.Since the arrival time of the shock wave emitted from the origin defines the location of the cavitation bubble, and the arrival time of the pulse-echo signal defines the position of its top surface, the bubble size can be estimated by combining these two measurements. From the geometry outlined in Fig. 3a, the radius of the cavitation bubble at the time is the difference between the measured distances: The cavitation bubble is effectively probed at the time determined by the sum of the user-defined time delay and the time required for the ultrasound pulse to reach the bubble . If the size of the bubble must be evaluated immediately after it has been formed, then the ultrasound pulse should be initiated prior to the laser pulse, and would be negative. The approach presented above is based on differential measurements of the passive acoustic emission from the bubble (relative to the laser pulse) and the active ultrasound echo (relative to the ultrasound pulse). Therefore, these measurements are performed relative to the position of the ultrasound transducer. However, the signals obtained from any stationary reference, such as an internal boundary within the tissue, can also be used to estimate both the location and the size of the laser-induced cavitation bubble. If the distance between the ultrasound transducer and the bottom of the water cuvette remains the same, then the bubble radius can be defined according to either the transducer or the bottom of the cuvette using the following expressions: Therefore, in relation to the optical window of the water cuvette, the instantaneous radius of the cavitation bubble is the difference between the position of its upper propagation surface and the location of its origin . By using the signals corresponding to the shock wave emitted from the origin of the cavitation bubble and reflected from the bottom of the cuvette [Figs. 2 and 3d], we can calculate the position of the bubble relative to the bottom of the cuvette as follows: where is the time delay between the passive emission of the shock wave from the cavitation bubble and the reflection of the same shock wave from the optical window [Fig. 3d]. The distance between the top surface of the cavitation bubble and the bottom of the cuvette can be found using the time delay between the ultrasound echoes arriving from the top surface of the cavitation bubble and the optical window [Figs. 2 and 3e]:In Eqs. 5, 6, the factor of 2 is used to account for the round-trip propagations of signals reflected from the optical window.Finally, the radius of the cavitation bubble can be obtained by combining Eqs. 4, 5, 6: Note that regardless of the signal-processing approach used [i.e., Eq. 3 or Eq. 7], the bubble radius is always measured at the same time, . To estimate time delays and in Eqs. 5, 6, 7, the normalized cross-correlation between the signals was used.24Hence, there are two possible approaches to measure the bubble location and its radius. The first approach measures both the bubble location and its radius directly from the acoustic signals, while the second approach uses the reflections of the signals from an internal reference surface. Both of these approaches have advantages and limitations. In some cases, the reference surface could be part of a tissue or organ—for example, a boundary of a cornea if a femtosecond laser refractive surgery is considered.9 However, if there are no internal boundaries present, the second approach cannot be used. The limitation of the first approach is that the shock wave originated during the plasma formation initially has a propagation speed several times higher than the speed of sound.9, 19, 25 The accuracy of the measurements, therefore, will be affected by inaccuracies and variations in the estimation of both the speed of the shock wave and the speed of sound. To demonstrate the overall capability of the proposed ultrasound method, we used the second approach to measure the location and the radius of the laser-induced cavitation bubbles where the top surface of the optical window of the water cuvette was utilized as the internal boundary. The advantage of such implementation is that the speed of the shock waves does not affect the bubble size estimation if the distance between the transducer and the point of an optical breakdown is greater than the length of the shock-to-acoustic wave conversion. The impact of the variable propagation speed is canceled because both direct and reflected shock waves have exactly the same propagation speed, and the time delay between them [Fig. 3b] is defined only by the speed of the acoustic wave and the distance between the internal boundary and the origin of the bubble . Indeed, if is the length of the shock-to-acoustic wave conversion and is an average speed of shock waves within this length, the time required for the shock wave to propagate directly from the point of the optical breakdown to the transducer Fig. 3 is The time of flight for the same shock wave, reflected from the bottom, to reach the transducer isTherefore, it follows from Eqs. 8, 9 that for any and satisfying the criterionthe position of the cavity relative to the bottom of the cuvette is defined by Eq. 5 with the time shift . Practically, criterion 10 requires enough distance for the shock wave to travel and convert into an acoustic wave. In our experiments, the distance from the photodisruption site to the transducer was , and the length of the shock-to-acoustic wave conversion was about for cavities created by nanosecond laser pulses.19, 25 Therefore, criterion 10 was easily satisfied, and the measurements were independent of the speed of the shock wave.To monitor bubble dynamics with high temporal resolution and over long periods of time, the ultrasound pulses, synchronized with the laser shots, must be transmitted into the medium at a high pulse repetition rate. The temporal resolution is proportional to the pulse repetition frequency of the ultrasound pulse-echo probe. In our experimental system, we used a maximum pulse repetition frequency of , which allowed assessments of the cavitation bubble size approximately every . Clearly, such temporal probing is too coarse to accurately capture bubble behavior with an average lifespan on the order of (see Fig. 2). To overcome this technical but not fundamental limitation, the experiments were repeated using a variable time delay ( to ) between the laser and the ultrasound pulses. Initially, the ultrasound pulses and laser shots were generated simultaneously, so was equal to zero. Since the speed of sound is much smaller than the speed of light, the ultrasound pulse arrived at the cavity site approximately after the laser pulse was triggered. The experiment was repeated 50 times, and all ultrasound signals were stored for later off-line processing. The was then increased by increments and the experiments were repeated 50 times, and the corresponding signals were recorded. Therefore, the dynamic behavior of the cavity was measured every over a time interval where each measurement included both passive and active ultrasound signatures of the cavitation bubble. However, a new bubble was generated and measured in every experiment, thus requiring statistical analysis of the data. The processes of nanosecond laser-induced optical breakdown, and consequently the formation of the cavitation bubble, are highly irregular.5 The modest variations of the laser energy or natural local changes of refraction and absorption coefficients of the medium lead to a wide size distribution of the cavitation bubbles. Therefore, to analyze our data, we divided the entire dataset into smaller subsets based on the cavitation bubbles’ lifespans. It was assumed that the cavitation bubbles within a small range of lifespan were formed under approximately the same conditions, such as laser energy and local optical properties of water. 2.4.Optical Verification of Ultrasound MeasurementsThe accuracy of the ultrasound measurements of the laser-induced cavitation bubble size was initially verified using direct optical measurements of the cavitation bubble size at the equilibrium. To avoid any translational motions of the bubbles during cavity formation and oscillation, the experiments were performed in a hydrogel sample made of 10% gelatin. The -thick layer of the liquid gelatin was poured in the water cuvette and stored in a refrigerator for 10 hours to solidify. The sample was then removed from the refrigerator and kept at room temperature for 5 hours to warm up and to reach a uniform temperature distribution. Since the typical bubble sizes induced in the gelatin were smaller than those formed in water, the focal point of the laser beam was moved closer to the bottom optical window such that the typical distance from the origin of the cavity to the glass was about . The cavitation bubbles were imaged by an optical microscope—a charge-coupled device (CCD) camera equipped with a 200x objective lens with an NA of 0.1. The working distance of the objective lens was , so, the optical imaging assembly did not interfere with the ultrasound measurements. Prior to the experiments, the microscope was calibrated using an image analysis micrometer with a step scale (Edmund Optics, Inc.). To assess the accuracy of optical measurement, a sapphire sphere was embedded into 10% gel and measured 15 times. The measured size of the sphere was , agreeing well with the expected values. At the beginning of the experiment, an ultrasound RF signal similar to that shown in Fig. 2 was recorded during the bubble formation. The passive acoustic emission from the cavity was used to calculate the origin of the laser-tissue interaction using Eq. 5. The cavity was then periodically probed using the pulse-echo ultrasound. At the same time, the formed bubble was monitored using the optical microscope. After about 30 minutes, the last ultrasound pulse was sent to probe the cavitation bubble. This particular record was analyzed together with the previously captured passive acoustic emission signal to calculate the bubble size based on Eqs. 6, 7. Simultaneously with the last ultrasound measurement, the bubble inside the gelatin sample was imaged using the CCD camera, and the radius of the cavitation bubble was measured directly from the calibrated optical image. The ultrasound and optical measurements of the microbubble size were compared to initially validate the accuracy of the developed quantitative ultrasound technique. However, due to the limited frame rate of the CCD camera of the optical microscope, an assessment of the temporal accuracy of the ultrasound measurements of the transient bubble size was not possible. 2.5.Verification of Ultrasound Measurements using Rayleigh Model of Cavitation Bubble CollapseThe temporal accuracy of the developed ultrasound method was verified by comparing the measured behavior of the laser-induced cavitation bubble in water with that estimated from the Rayleigh model of a spherical cavitation bubble collapse in an incompressible liquid.26, 27 The equation to describe the radial motion of the cavitation bubble surface is where is the current radius of the bubble, is time, is the hydrostatic pressure outside of the bubble, is the vapor pressure inside the bubble, is the density of the surrounding liquid, and is the maximum size of the bubble. In the present calculations, the static pressure was assumed to be atmospheric , and the vapor pressure inside the cavitation bubble was neglected . The density of water was taken as . The initial condition for Eq. 11 wasi.e., the speed of the bubble collapse was equal to zero when the bubble reached its maximum size.Integration of Eq. 11 with respect to time gives the collapse time of the cavitation bubble: To fully describe the dynamic behavior of the laser-induced cavitation bubbles in water, we assumed that the expansion of the cavity and the subsequent collapse of the bubble were symmetric processes, and the Rayleigh model was expanded symmetrically around the point of maximum radius,28 i.e., the lifespan of the cavity was simply twice as long as the cavity collapse time . Therefore, once the lifespan of the cavitation bubble formed in water was measured (see Fig. 2) and its collapse time was estimated, its temporal behavior could be calculated using the Rayleigh model [Eqs. 11, 12, 13] and compared with the values measured using the ultrasound technique. 3.Results3.1.Optical Verification of Ultrasound MeasurementsThe ultrasound method was first verified by comparing ultrasound and optical measurements obtained from nine microbubbles generated using a pulse energy of . Each cavitation bubble was produced in gel and measured both optically and ultrasonically at equilibrium. Generally, due to the nature of the interaction of nanosecond laser pulses with a medium, the dimension of the cavitation bubbles ranged from to . Therefore, a comparison between optical and ultrasound measurements was performed for each bubble independently. An example of such analysis is presented in Figs. 4 and 5 . Fig. 4Optical image of a laser-induced cavitation bubble. The laser beam was delivered from the bottom and the ultrasound transducer was positioned at the top, as indicated in Fig. 1.  Fig. 5Temporal characteristics of (a) passive acoustic emission from the cavity, and (b) pulse-echo ultrasound probing of the cavitation microbubble (solid line). Prior to the experiment, the echo signal from the optical window at the bottom of the cuvette was captured [dashed line in Fig. 5b]. These acoustic signals were used to determine the radius of the microbubble at equilibrium.  Figure 4 presents an optical image of the cavitation bubble. Clearly, the bubble is slightly elongated in the vertical direction. Such distortion of the bubble shape from a perfect sphere is not unusual and is determined, among other parameters, by the focusing of the laser beam. The axial radius of the bubble (i.e., the distance between the origin of the bubble and its upper surface) was measured to be . Given the geometry of the experimental setup, the ultrasound measurements of the laser-induced cavitation bubbles were performed along the ultrasound beam axis, i.e., along the vertical direction in Fig. 4. Figure 5a shows the measured passive acoustic emission from the laser-induced cavitation bubble formed in gelatin by a single laser pulse. The first signal, located near , represents the shock wave propagating from the origin of the cavitation bubble directly to the ultrasound transducer. The second signal, located at , corresponds to the same shock wave after it is reflected from the optical window at the bottom of the cuvette before it reaches the transducer. The time delay between these two signals was estimated using the normalized cross-correlation procedure. Using the speed of sound of , the distance between the origin of the cavitation bubble and the optical window, calculated using Eq. 5, was estimated to be . Figure 5b presents the active ultrasound pulse-echo signals from the optical window before the cavitation bubble was formed and from the cavitation bubble surface after its formation. The first record (dashed line) was captured before the cavitation bubble was produced in the gel. The echo signal, located at approximately , corresponds to the pulse reflected from the optical window at the bottom of the cuvette. The solid line in this figure represents the pulse echo signals from the top surface of the cavitation bubble, located at , as well as from the optical window, located at approximately . Note that the ultrasound pulse-echo signals from the optical window at the bottom of the cuvette, recorded before and after the laser pulse, are slightly different due to the formation of an acoustic inhomogeneity along the propagation path of the ultrasound pulse. Therefore, the distance between the top surface of the bubble and the optical window was measured using the signal from the surface of the cavitation bubble and the signal from the optical window before the bubble formation. Given these temporal estimates and using Eq. 6, the distance from the topsurface of the bubble to the optical window was found to be about . Based on these results, the radius of the cavitation bubble was calculated as . Therefore, in this particular case, the absolute difference between the ultrasound and optical measurements of the bubble radius was . That corresponds to a relative difference of 2.9%. For the entire set of experiments, the mean values of absolute and relative differences were and 8.9%, respectively. 3.2.Verification of Ultrasound Measurements using Rayleigh Model of Cavitation Bubble CollapseTo compare measured bubble evolution with theoretically predicted behavior, another set of experiments was performed and the lifespans of the bubbles in water were measured. In our experimental studies, the overall range of bubble lifespans was (mean value and standard deviation), corresponding to a maximum cavity radius of . This large variation in bubble size measurements was related primarily to the repeatability of the nanosecond laser-induced cavitation bubbles and to nonsignificant local changes of refraction and absorption coefficients of the medium. To reduce these possible error sources, the data analysis was performed on small subsets of data identified by a narrow range of cavity lifespans. It was assumed that all cavitation bubbles within a certain range of lifespans were formed under approximately the same conditions, such as laser energy and local optical properties of water. Figure 6 presents the dynamic behavior of the cavitation bubbles in water, obtained from one of the subsets. Only appropriate RF signals corresponding to bubbles with a lifespan ranging between 135 to were used for these calculations. The number of RF signals and the error bars (plus/minus one standard deviation) were slightly different for each experimental point. The ultrasound measurements were also compared with the Rayleigh model of the cavitation bubble with a lifespan of , corresponding to a maximum bubble radius of . The temporal dependence of the bubble radius was calculated using Eqs. 11, 12, 13, assuming no vapor pressure inside the bubble and for the water density. Fig. 6Measured (time-of-flight method) and modeled (cavity lifespan or collapse time and Rayleigh equation) dynamic behavior of cavities produced by the pulsed nanosecond laser. Only a subset of data corresponding to cavitation bubbles with a lifespan between 135 to was used. The error bars represent plus/minus one standard deviation of the estimates.  Figure 7 demonstrates the measured dynamics of the laser-induced cavitation bubbles with lifespans ranging between 115 to , 130 to , and 140 to in water. Using Eq. 13, the maximum average sizes of these cavities were calculated as , , and for the bubble lifespans of , , and , respectively. The experimentally measured temporal behaviors of the cavitation bubbles are in good agreement with the theoretical predictions based on the Rayleigh model. Note that since the ratio of the distance from the bubble origin to the cuvette bottom and the maximum bubble radius [see Fig. 3a] exceeded 4 for all measured microbubbles, the dynamic behavior of the bubble was not affected by the presence of the cuvette’s glass bottom. Fig. 7Comparison of measured (time-of-flight) and modeled (Rayleigh equation) temporal behavior of cavitation bubbles characterized by different lifespans.  The measurements noted above were conducted using the glass bottom as a reference point and for the speed of sound. The approach utilizing the transducer as a reference point [Eq. 3] was also applied to measure the evolution of bubbles in water. The same dataset was used for these calculations. Since initially the speed of the shock wave was several times higher than the speed of sound, the bubble radii were underestimated. As expected, this underestimation was constant for all experiments and did not depend on the time delay between the laser and ultrasound pulses. The average difference between the radii obtained with the two methods was (mean value and standard deviation). This difference vanishes if the average speed of the shock wave over the distance from the bubble’s origin to the transducer is assumed to be . This assumption is reasonable since the shock wave, initially propagating with a higher speed, becomes an acoustic wave within a few millimeters of propagation19, 25 4.DiscussionThe laser-induced cavitation bubbles can be accurately located and measured using the developed ultrasound technique. The direct optical measurements of bubble sizes at equilibrium agree with the measurements of the size of the same bubbles obtained using the developed ultrasound method. Furthermore, the time-of-flight measurements of the cavitation bubble sizes agree, both qualitatively and quantitatively, with the theoretical model of cavity collapse. The propagation of the ultrasound waves does not depend on the optical properties of the surrounding medium, although the current ultrasound measurements were performed in a transparent liquid and hydrogel. Therefore, the developed ultrasound technique can be used in opaque tissues, allowing the monitoring of the tissue-laser interaction at relatively large depths. The experimental results presented in Figs. 6 and 7 indicate that the first cycle of oscillation of the bubble, produced by a pulsed nanosecond laser in water near the bottom of the cuvette, was found to be approximately symmetric (i.e., the expansion and collapse of a cavitation bubble are nearly identical mechanical processes reversed in time). However, for a given lifespan of a cavity formed in water, the bubble size estimated from the Rayleigh model of a cavity collapse is slightly bigger than the measured size of the laser-induced cavitation bubble. One possible explanation of this result is that the rigid surface of the cuvette bottom located next to the bubble affects bubble behavior, and the Rayleigh formula should be corrected with a shortening (or lengthening) factor which, in turn, depends on the proximity of the bubble to the surface characterized by the parameter (defined as a ratio between the distance from the origin of the bubble to the surface and the maximum bubble radius).7, 29 But the shortening factor approaches 1 when the parameter exceeds 2 for microbubbles formed near the surface of a soft boundary29 and when the parameter exceeds 3.5 for bubbles near a rigid surface.8 In our experiments, the parameter exceeded 4, indicating negligible interaction of the bubbles with the cuvette bottom. Therefore, the difference between measurements and the Rayleigh model is more likely due to neglect of the vapor pressure inside of the bubbles. The products of a plasma recombination are present inside of a laser-induced microbubble, and the cavity cannot be assumed to be absolutely empty. To match the model-based and measured sizes of the bubbles, Eqs. 11, 13 must include the vapor pressure inside of a bubble. The vapor pressure inside of the cavity can be on the order of several thousands of Pascals.9, 30 In the reported experiments, we used the cavity collapse measurements simply to compare our experimental results with the Rayleigh model and thus verify the developed ultrasound technique. In practice, the analysis of both the passive acoustic emission during a cavity formation and the ultrasound pulse-echo signals from a laser-induced cavity is sufficient to directly estimate the location and size of the cavity or bubble. The developed ultrasound technique does not rely on either the detection of the shock wave associated with the cavity collapse or on any subsequent shock waves. In addition, the bubble collapse signal may not appear in elastic tissues like the cornea.9 Furthermore, the Rayleigh formula is not valid for microbubbles formed in elastic materials such as gelatin.6 Therefore, the ultrasonically measured sizes of microbubbles formed in gelatin were compared with the optically assessed sizes but not with the theoretical model. Fundamentally, a microbubble cannot be measured when the cavity was just formed but did not yet expand or when the cavity collapsed. In both of these cases, there is no measurable acoustic inhomogeneity, and therefore no reflected echoes are possible. In addition, in the vicinity of these points, the passive acoustic emission will dominate the signal. It is expected that the measurement error will be greater in these regions. However, the measurement error is small when the cavitation bubble has reliably been formed, reached the maximum size, and started to collapse. A reasonable accuracy was achieved in the measurements presented in Figs. 6 and 7 with the largest error not exceeding about 8% of the maximum radius of the cavitation bubble. The average error calculated at all points was less than 5%. Generally, the accuracy of the proposed ultrasound method depends on the accuracy of the time-of-flight estimation. This, in turn, depends on several factors, including the signal-to-noise ratio of the ultrasound signals, the speed of sound estimation, or the frequency and bandwidth of the ultrasound waves. All of our experiments were performed in water and ultrasonically transparent gelatin, i.e., in materials that do not backscatter the ultrasound waves. In most soft tissues, however, an ultrasound echo, backscattered from a tissue, will overlap with the ultrasound echo reflected from a laser-induced microbubble. The overlap will decrease the signal-to-noise ratio of the measurements, and therefore limit the size of the smallest detectable cavity. This limitation can be partially addressed by increasing the frequency of the ultrasound waves. It reduces the width of the ultrasound beam, and therefore increases the ratio of the bubble size to the ultrasound wavelength and the relative magnitude of the reflected signal. Furthermore, a baseline ultrasound pulse-echo signal can be recorded prior to the formation of the cavitation bubble. This will allow cavity measurements based on a differential analysis of the ultrasound RF signals acquired before and after the laser-tissue interaction. As reported in the literature,19 for cavitation bubbles created by , laser pulses, a length of a shock-to-acoustic wave conversion in water was about , where the speed of the propagation of the shock wave in water was measured by a beam-deflection probe and an arm-compensated interferometer. These results allow the estimation of the average shock wave speed for the initial distance, where the shock wave is not yet converted to a sound wave. Our crude estimation gives approximately . This value is also in agreement with published data25 for the speed of shock waves produced by a cavitation bubble formed with laser pulses and energies of 1 and . In our experiments, we used laser pulses with of energy per pulse, and the distance from the transducer to the cavitation point was about . Assuming that the length of the shock-to-acoustic wave conversion in our experiments is also and the acoustic wave then propagates at , the average propagation speed of the acoustic emission from the bubble to the transducer is on the order of . Thisvalue is in good agreement with the estimated speed of sound determined from the experimental RF signals. However, the length of the shock-to-acoustic wave conversion depends on the specific characteristics of the laser pulse, including the energy and the duration of a laser pulse, the focusing conditions, etc. For picosecond and femtosecond laser pulses, for example, shock waves are converted to acoustic ones over much shorter distances,9, 25 and the impact of the shock waves’ speed should be significantly smaller than nanosecond laser pulses. The accuracy of ultrasound measurements depends on the speed of the shock waves unless the tissue has an internal surface or boundary and the experimental conditions meet criterion 10. Indeed, if either the distance between a microbubble and a transducer is too small or an internal boundary is not available, then both the cavity location and size must be estimated in relation to the transducer using Eqs. 1, 2, 3. A faster shock wave speed will result in an underestimation of the distance between the transducer and the origin of the cavity. Thus, the assessed radius of the cavitation bubble will appear smaller than it really is. This underestimation increases with the length of the shock-to-acoustic wave conversion and decreases with the total distance between the transducer and the origin of the microbubble. Note, however, that the results of the ultrasound measurements presented in this paper do not depend on the speed of the shock waves. The speed of sound itself affects measurement accuracy regardless of the choice of the reference surface. Whether the cavity location and size are assessed in relation to either the transducer [Eqs. 1, 2, 3] or the optical window [Eqs. 5, 6, 7], the result will be linearly scaled by the speed of sound. The values of the speed of sound in each soft tissue are well known and do not vary significantly. For example, the speed of sound for a wide range of ultrasound frequencies in an iris, a ciliary body, a sclera, and a cornea are , , , and , respectively.31, 32, 33 Overall, the average velocity of sound in ocular tissues is and varies from to . Even if a human eye is considered as a homogeneous object, the measurement error of the bubble size will not exceed 4%. Therefore, variations in the sound velocity affect the accuracy of measurements, but this effect is relatively small and, more importantly, affect each measurement equally. To achieve high-resolution temporal measurements of dynamic bubble behavior, our experiments were repeated with variable delays between the ultrasound and laser pulses. In each experiment, a new bubble was produced. However, a single bubble can be monitored if a high-repetition frequency of the ultrasound pulses is used. For example, in the experimental results presented here, the time resolution of corresponds to a pulse repetition frequency of . Such a frequency is possible if a relatively superficial bubble positioned at 3 to depth is imaged. To derive Eqs. 1, 2, 3 and Eqs. 5, 6, 7, we assumed that a laser pulse produces a uniformly expanding (or collapsing) spherical cavity and the center of mass remains stationary during the measurements. These assumptions are valid if the microbubble is created in a somewhat homogeneous medium and away from a mechanical surface or an interface. The microbubble created about four radii apart from such a boundary is more likely to remain spherical.11, 25, 29 In our studies the microbubbles were originated in either water or the gelatin and remained stationary over the short observation time. The magnitude of the passive acoustic emission directly detected by the transducer is several times greater than the magnitude of the same passive acoustic wave reflected from the optical window [see Figs. 3d and 5a]. The cavity does not affect the shock wave propagating spherically outward from the site of the laser-induced optical breakdown. However, the wave reflected from the cuvette bottom must travel through the medium with the rapidly expanding cavity. Indeed, in several microseconds the cavity can reach several hundreds of micrometers in diameter (see Figs. 6 and 7), thus blocking this reflected ultrasound wave and effectively reducing the amplitude of the passive acoustic emission reflected from the bottom of the cuvette. If the reflected wave is attenuated significantly, the accuracy of the measurements will decrease. In contrast, the ultrasound measurements using the transducer as a reference point avoid this difficulty. The developed technique can be used to measure microbubbles produced by picosecond and femtosecond pulsed lasers. Our initial results demonstrated that bubbles of diameter can be measured using the ultrasound technique; the applicability of this technique to measure smaller gas bubbles (below ) is being investigated. However, for smaller bubbles created by a femtosecond laser, higher-frequency ultrasound must be used. By choosing the correct parameters of the ultrasound system, one can achieve ultrasound measurements of small cavities and microbubbles with acceptable sensitivity and error. 5.ConclusionsAn ultrasound technique to monitor the spatial and temporal behavior of a cavitation bubble was developed and tested using microbubbles produced by single nanosecond laser pulses. This method is based on simultaneous analysis of temporal characteristics of both the passive acoustic emission from the cavitation bubble and the active ultrasound pulse-echo probing of the laser-induced bubble. To demonstrate the accuracy of the ultrasound method, measurements of the cavitation microbubble sizes were compared with direct optical measurements and with estimations obtained from the Rayleigh model of cavity collapse. Overall, the developed technique can be used in various biomedical and clinical applications. AcknowledgmentsThis work was partially supported by the National Institutes of Health under grants EB004963, EY018081, and NS060129, and by the National Science Foundation under grants BES-0548673 and BES-0508266. Mrs. Srivalleesha Mallidi of the Department of Biomedical Engineering at the University of Texas at Austin is acknowledged for her help with the design and implementation of the data capture software. ReferencesR. F. Steinert and
C. A. Puliafito, The Nd:YAG Laser in Ophthalmology: Principles and Clinical Applications of Photodisruption, W.B. Saunders Company, Philadelphia (1985). Google Scholar
H. Lubatschowski,
G. Maatz,
A. Heisterkamp,
U. Hetzel,
W. Drommer,
H. Welling, and
W. Ertmer,
“Application of ultrashort laser pulses for intrastromal refractive surgery,”
Clin. Investig., 238 33
–39
(2000). 0941-0198 Google Scholar
A. Vogel,
J. Noack,
G. Huttman, and
G. Paltauf,
“Mechanisms of femtosecond laser nanosurgery of cells and tissues,”
Appl. Phys. B, 81 1015
–1047
(2005). https://doi.org/10.1007/s00340-005-2036-6 0946-2171 Google Scholar
A. Vogel,
M. R. C. Capon,
M. N. Asiyo-Vogel, and
R. Birngruber,
“Intraocular photodisruption with picosecond and nanosecond laser pulses:tissue effects in cornea, lens, and retina,”
Invest. Ophthalmol. Visual Sci., 35 3032
–3044
(1994). 0146-0404 Google Scholar
A. A. Oraevsky,
L. B. D. Silva,
A. M. Rubenchik,
M. D. Feit,
M. E. Glinsky,
M. D. Perry,
B. M. Mammini,
I. Ward Small, and
B. C. Stuart,
“Plasmamediated ablation of biological tissues with nanosecond-to-femtosecond laserpulses: relative role of linear and nonlinear absorption,”
IEEE J. Sel. Top. Quantum Electron., 2 801
–809
(1996). https://doi.org/10.1109/2944.577302 1077-260X Google Scholar
E.-A. Brujan and
A. Vogel,
“Stress wave emission and cavitation bubble dynamics by nanosecond optical breakdown in a tissue phantom,”
J. Fluid Mech., 558 281
–308
(2006). https://doi.org/10.1017/S0022112006000115 0022-1120 Google Scholar
E.-A. Brujan,
K. Nahen,
P. Schmidt, and
A. Vogel,
“Dynamics of laser-induced cavitation bubbles near an elastic boundary,”
J. Fluid Mech., 433 251
–281
(2001). 0022-1120 Google Scholar
A. Vogel and
W. Lauterborn,
“Acoustic transient generation by laser-produced cavitation bubbles near solid boundaries,”
J. Acoust. Soc. Am., 84 719
–731
(1988). https://doi.org/10.1121/1.396852 0001-4966 Google Scholar
T. Juhasz,
G. A. Kastis,
C. Sudrez,
Z. Bor, and
W. E. Bron,
“Time-resolved observations of shock waves and cavitation bubbles generated by femtosecond laser pulses in corneal tissue and water,”
Lasers Surg. Med., 19 23
–31
(1996). https://doi.org/10.1002/(SICI)1096-9101(1996)19:1<23::AID-LSM4>3.0.CO;2-S 0196-8092 Google Scholar
K. R. Rau, A. Guerra III, A. Vogel, and
V. Venugopalan,
“Investigation of laser-induced cell lysis using time-resolved imaging,”
Appl. Phys. Lett., 84 2940
–2942
(2004). https://doi.org/10.1063/1.1705728 0003-6951 Google Scholar
A. Vogel,
P. Schweiger,
A. Frieser,
M. N. Asiyo, and
R. Birngruber,
“Intraocular Nd:YAG laser surgery: light-tissue interaction damage range and reduction of collateral effects,”
IEEE J. Quantum Electron., 26 2240
–2260
(1990). https://doi.org/10.1109/3.64361 0018-9197 Google Scholar
W.-S. Chen,
T. J. Matula, and
A. Crum,
“A light scattering technique for investigating the destruction of ultrasound contrast agents,”
Proc.-IEEE Ultrason. Symp., 2 1683
–1686
(2001). 1051-0117 Google Scholar
G. Gouesbet,
B. Maheu, and
G. Grehan,
“Light scattering from a sphere arbitrarily located in a Gaussian beam using a Bromwich formulation,”
J. Opt. Soc. Am. A, 5 1427
–1443
(1988). 0740-3232 Google Scholar
H. Qui,
“Eliminating high-order scattering effects in optical microbubble sizing,”
J. Opt. Soc. Am. A, 20 690
–697
(2003). https://doi.org/10.1364/JOSAA.20.000690 0740-3232 Google Scholar
T. O’hern,
J. R. Torczynski,
S. Tassin,
S. Ceccio,
G. Chahine,
R. Duraiswami, and
K. Sarkar,
“Development of an electrical impedance tomography system for an air-water vertical bubble column,”
Forum on Measurement Techniques in Multiphase Flows, 1
–9 ASME IMEC&E, pp.1995). Google Scholar
G. L. Chahine,
K. M. Kalumuck,
J.-Y. Cheng, and
G. S. Frederick,
“Validation of bubble distribution measurements of the ABS acoustic bubble spectrometer with high speed video photography,”
1
–8
(2001) Google Scholar
R. Duraiswami,
S. Prabhukumar, and
G. L. Chahine,
“Bubble counting using an inverse acoustic scattering method,”
J. Acoust. Soc. Am., 104 2699
–2717
(1998). https://doi.org/10.1121/1.423854 0001-4966 Google Scholar
C. B. Schaffer,
N. Nishimura,
E. N. Glezer,
A. M.-T. Kim, and
E. Mazur,
“Dynamics of femtosecond laser-induced breakdown in water from femtoseconds to microseconds,”
Opt. Express, 10 196
–203
(2002). 1094-4087 Google Scholar
R. Petkovšek,
J. Možina, and
G. Močnik,
“Optodynamic characterization of the shock waves after laser-induced breakdown in water,”
Opt. Express, 13 4107
–4112
(2005). https://doi.org/10.1364/OPEX.13.004107 1094-4087 Google Scholar
W. Lauterborn,
T. Kurz,
R. Mettin, and
C. D. Ohl,
“Experimental and theoretical bubble dynamics,”
Adv. Chem. Phys., 110 295
–380
(1999). 0065-2385 Google Scholar
N. Bang,
M. B. Nielsen,
A. N. Rasmussen,
P. A. Osterhammel, and
J. F. Pedersen,
“Hepatic vein transit time of an ultrasound contrast agent: simplified procedure using pulse inversion imaging,”
Br. J. Radiol., 74 752
–755
(2001). 0007-1285 Google Scholar
S. Hilgenfeldt,
D. Lohse, and
M. Zomack,
“Response of bubbles to diagnostic ultrasound: a unifying theoretical approach,”
Eur. Phys. J. B, 4 247
–255
(1998). https://doi.org/10.1007/BF02422838 1434-6028 Google Scholar
S. M. Milas,
J. Y. Ye,
T. B. Norris,
K. W. Hollman,
S. Y. Emelianov, and
M. O’Donnell,
“Acoustic characterization of microbubble dynamics inlaser-induced optical breakdown,”
IEEE Trans. Ultrason. Ferroelectr. Freq. Control, 50 517
–522
(2003). https://doi.org/10.1109/TUFFC.2003.1201464 0885-3010 Google Scholar
M. A. Lubinski,
S. Y. Emelianov, and
M. O’Donnell,
“Speckle tracking methods for ultrasonic elasticity imaging using short-time correlation,”
IEEE Trans. Ultrason. Ferroelectr. Freq. Control, 46 82
–96
(1999). https://doi.org/10.1109/58.741427 0885-3010 Google Scholar
A. Vogel,
S. Busch, and
U. Parlitz,
“Shock wave emission and cavitation bubble generation by picosecond and nanosecond optical breakdown in water,”
J. Acoust. Soc. Am., 100 148
–165
(1996). https://doi.org/10.1121/1.415878 0001-4966 Google Scholar
O. M. Rayleigh,
“On the pressure developed in a liquid during the collapse of a spherical cavity,”
Philos. Mag., 34 94
–98
(1917). 0031-8086 Google Scholar
G. T. Leighton, The acoustic bubble, Academic Press, London (1994). Google Scholar
S. Buogo and
G. B. Cannelli,
“Implosion of an underwater spark-generated bubble and acoustic energy evaluation using the Rayleigh model,”
J. Acoust. Soc. Am., 111 2594
–2600
(2002). https://doi.org/10.1121/1.1476919 0001-4966 Google Scholar
E.-A. Brujan,
K. Nahen,
P. Schmidt, and
A. Vogel,
“Dynamics of laser-induced cavitation bubbles near elastic boundaries: influence of the elastic modulus,”
J. Fluid Mech., 433 283
–314
(2001). 0022-1120 Google Scholar
B. Ward and
D. C. Emmony,
“Interferometric studies of the pressures developed in a liquid during infrared-laser-induced cavitation-bubble oscillation,”
Infrared Phys., 32 489
–515
(1991). https://doi.org/10.1016/0020-0891(91)90138-6 0020-0891 Google Scholar
S. F. Urbak,
“Ultrasound biomicroscopy. III. Accuracy and agreement of measurements,”
Acta Ophthalmol. Scand., 77 293
–297
(1999). 1395-3907 Google Scholar
H. R. Atta,
“New applications in ultrasound technology,”
Br. J. Ophthamol., 83 1246
–1249
(1999). 0007-1161 Google Scholar
S. G. Ye,
K. A. Harasiewicz,
C. J. Pavlin, and
F. S. Foster,
“Ultrasound characterization of ocular tissue in the frequency range from to ,”
Proc.-IEEE Ultrason. Symp., 2 1107
–1112
(1992). 1051-0117 Google Scholar
|


