|
|
1.IntroductionEstablishing an understanding of the relationship between the micro-optical properties of tissue constituents and the overall optical response of tissues is of paramount importance for development and optimization of optical technologies targeting early cancer diagnosis. Modeling studies play a key role in this respect; photon propagation models developed to computationally predict the optical response of normal and precancerous tissues can be used to suggest guidelines for better interpretation of acquired signals and for optimized design of optical sensors to maximize diagnostic contrast. Monte Carlo (MC) modeling offers a flexible statistical approach to computationally analyze photon propagation on the bulk or macroscopic tissue level and has, over the years, provided significant insight to understand the potential of optical techniques for capturing cancer-related changes in tissues1, 2, 3, 4, 5 or to fine-tune fiber optic probe designs for optimum performance. 6, 7, 8, 9, 10, 11, 12, 13, 14 Most MC studies, however, are generally performed using simplified phase functions that only approximate the angular scattering probability distributions of microscopic tissue constituents. A common example is the well-known Henyey-Greenstein phase function, which is given by a simple analytical expression and resembles scattering patterns computed on the basis of the Mie theory for homogeneous spherical scatterers.15 Tissue scatterers are, in reality, not homogeneous spheres but rather complex, irregularly shaped structures, and the Henyey-Greenstein phase function may not be sufficient to fully characterize their angular scattering properties. The influence of angular scattering probability distribution on tissue reflectance has previously been investigated using alternative and more complex analytical phase functions16, 17, 18 or phase functions directly obtained with the Mie theory.17, 19, 20 Results of these studies demonstrate that photon transport depends on the exact form of the angular scattering probability distribution function when measurements are performed with small source-detector separations. Analytical or Mie phase functions used in these studies are still approximations that may not be valid for characterizing the probability of scattering at different angles. Over the past decade, finite-difference time-domain (FDTD) modeling has emerged as a powerful tool to quantify the micro-optical properties of tissue constituents. The FDTD method numerically solves Maxwell’s equations and can be used to compute realistic phase functions for microscopic tissue scatterers with no restrictions on either the shape or dielectric structure.21 A series of modeling studies 22, 23, 24, 25, 26, 27, 28, 29, 30, 31 focused on investigating the scattering properties of cells or cell components established the FDTD method as a powerful computational tool for biophotonic analysis. In the context of epithelial precancer detection, it is especially important to characterize the scattering properties of cells that occupy the superficial layer of epithelial tissues. Structural and morphological changes in the nuclei of epithelial cells are the most important indicators of precancer development,32 and FDTD modeling can be used to quantify alterations in cellular scattering properties arising from these precancerous changes.26, 27 The goal of the research presented in this work is to develop a computational framework that combines MC and FDTD modeling. We describe an algorithm that can be used to incorporate FDTD phase functions into MC modeling and allows photon propagation according to angular scattering probability distributions computed using the FDTD method. We construct normal and precancerous epithelial tissue models consisting of a thin cellular epithelium on top of an underlying stromal layer, we use the FDTD method to compute phase functions for normal and precancerous epithelial cells, and we then carry out simulations using the combined MC/FDTD algorithm to assess the influence of incorporating these realistic FDTD phase functions on modeling spectroscopic reflectance signals. Optical probing depth of an illumination and detection system depends on the geometry of the source and detector fibers. We simulate three fiber optic probe designs that are feasible to implement in real clinical settings and that demonstrate progressively increasing levels of sensitivity to the top epithelial layer. The first design represents a commonly encountered geometry, where source and detector fibers are oriented perpendicular to the tissue surface.33 The second design involves source and detector fibers tilted at an angle with respect to the tissue surface. 9, 10, 11, 12, 14, 34, 35, 36 Finally, the third design involves lens coupled source and detector fibers.10 Simulations are performed to determine the extent of the influence of using FDTD-generated cellular phase functions when these different probe geometries are employed for optical measurements. 2.Methods2.1.Combined Monte Carlo/Finite-Difference Time-Domain AlgorithmIn MC modeling, each tissue layer is described by a thickness and several optical properties, including the refractive index , absorption coefficient , scattering coefficient , and scattering phase function that characterizes probability of scattering from unit direction to unit direction . If the tissue layer is isotropic, scattering depends only on the deflection angle between unit vector directions and .15, 16 The Henyey-Greenstein (HG) function has evolved as a simple and convenient expression that is frequently used to approximate the scattering patterns of tissue scatterers. This function describes the probability density for and is specified fully by only a single model parameter as15 where the anisotropy factor represents the expected value of . Note that the probability that a photon is scattered in the angular interval is , andHG probability density for , hereafter referred to as HG phase function, can be expressed as37 such thatDuring conventional photon propagation, the inverse-transform technique15 is applied to Eq. 1 to sample values for , and hence for the deflection angle . The azimuthal scattering angle is generally assumed to be uniformly distributed between 0 and .FDTD modeling can be used to compute scattering patterns of tissue constituents. These scattering patterns describe the intensity of scattered light at discrete angles and cannot be described analytically. Hence, a discrete random-variate generation algorithm is needed to allow sampling of the scattering direction from scattering patterns obtained using the FDTD method. Assume that the scattering pattern is denoted by , where is the scattering angle in degrees. The scattering phase function is then given by the probability mass function that describes the probability that the scattering angle : Note that in defining the probability mass function in Eq. 5, the scattering pattern has been multiplied by .28 The angular interval equals 1 and cancels out in Eq. 5, but it has been included for completeness. The inverse-transform technique can be used to sample from the FDTD phase function .17, 19, 20, 38, 39, 40 First, the cumulative distribution function is computed using where is a nondecreasing function that assumes values between 0 and 1. Now, let be a uniformly distributed random variable in (0,1), and let be a generated value of . Also, let denote the ’th largest in {0, 1, …, 180}. The cumulative distribution function is searched to find the smallest where . The value of the sampled scattering angle is then given byNote that Eq. 7 represents an interpolation scheme that allows generation of continuous scattering angles from an FDTD phase function. In general, the inverse-transform technique may not be highly efficient, since it requires a search on . However, tissue scatterers are mostly forward scattering and scattering angles are usually restricted to small angles. The search on is most of the time expected to terminate without having to scan a large number of entries. Therefore, the presented sampling method does not suffer from significant computational burden. 2.2.Model Input2.2.1.Finite-difference time-domain simulation parametersDetails regarding the implementation of the C/C++ FDTD code used in this study have been described elsewhere.27 Simulations were performed at three different wavelengths, namely , 500, and . Grid spacing for the FDTD computational domain was set to for each simulation. Epithelial cells were modeled as spheres having a fixed overall diameter of and embedded in an outside medium of refractive index 1.35.41 The refractive index of the cytoplasm was 1.36.41 Construction of ellipsoidal nuclei within normal and precancerous cells was based on morphological and textural parameters obtained through analysis of an extensive set of cervical quantitative histopathology data published previously27 and summarized in Table 1 . Note that the values given in Table 1 for mean radius, eccentricity, mean refractive index , and refractive index fluctuation , correspond to acceptable ranges for normal and highly dysplastic cell nuclei at basal and intermediate epithelial depths. These values are indicative of precancerous changes, including increased nuclear size, asymmetric nuclear shape, increased DNA content, and hence increased optical density, and coarse and irregular chromatin texture, as evidenced by increased refractive index fluctuations and larger chromatin clumps. Nuclear refractive index variations were created by placing small cubes of various sizes randomly throughout the ellipsoidal volume. The refractive index of each cube was selected from the interval , and the size was selected from a range with a lower limit of , which corresponded to the resolution of the quantitative histopathologic images analyzed, while the upper limit was determined by the size of the largest chromatin clump characterizing each diagnostic category. These heterogeneities were inserted one by one until the nuclear volume was filled out, so that it was impossible to place another nonoverlapping cube within the available space. To fully characterize epithelial cells, we also randomly placed a given fraction of nonoverlapping organelles in the cytoplasm. Organelles were created as uniform ellipsoids with dimensions randomly selected from the interval ,42, 43, 44 and their total number was adjusted to give a volume fraction of about 5%.22, 23, 45 The refractive index of each organelle was chosen from the interval 1.40 to 1.55 to bracket a wide range of values reported in the literature.41, 42, 43, 44, 45, 46 Organelle parameters were kept the same for normal and precancerous cells, since we are not aware of a study that quantifies changes, if any, in organelle morphology and volume fraction with precancer progression. Three simulations were carried out for each wavelength and diagnostic category, with nuclear parameters randomly selected from the ranges given in Table 1, and the results presented represent averages over three different simulation runs. All simulations were performed on a personal computer with of RAM. Table 1Nuclear parameters for FDTD simulations of normal and precancerous epithelial cells.27
2.2.2.Combined Monte Carlo/finite-difference time-domain simulation parametersEpithelial tissue was modeled as consisting of two layers, the top thin layer being the epithelium with a thickness of ,47 and the second layer being the semi-infinite stroma. Table 2 lists the absorption and scattering coefficients of both the epithelium and the stroma for normal and precancerous epithelial tissue. The values listed for normal tissue were based on measurements from cervical tissue or other epithelial tissues having a similar architecture, and were reported in a recent paper by Arifler 5 Optical parameters used in modeling precancer were obtained by increasing the epithelial scattering coefficient by a factor of 3, increasing the stromal absorption coefficient by a factor of 2, and decreasing the stromal scattering coefficient by 25%. These changes were adopted to represent increased epithelial scattering due to structural and morphological alterations in cell nuclei, angiogenic activity, and hence increased hemoglobin content in the stroma, and degradation of collagen fibers in the stroma. The coefficients listed in Table 2 for precancerous tissue have been observed to generate reflectance spectra consistent with measurements from highly dysplastic cervical tissue.5 The three wavelengths chosen for simulations sample the visible part of the electromagnetic spectrum, where corresponds to the hemoglobin absorption peak. The refractive index of both tissue layers was set to . Note that even though the refractive index of the outside medium was assumed to be 1.35 for FDTD computations, rounding this number to 1.4 in MC modeling does not cause a significant deviation in simulation results as previously demonstrated.5 HG phase function with was used to describe angular scattering probability distribution in the stromal layer. For the epithelial layer, phase functions computed using the FDTD method were employed, while HG phase functions with identical values as the FDTD functions were also tested to present a comparative analysis. Table 2Absorption and scattering coefficients for normal and precancerous epithelial tissue.5
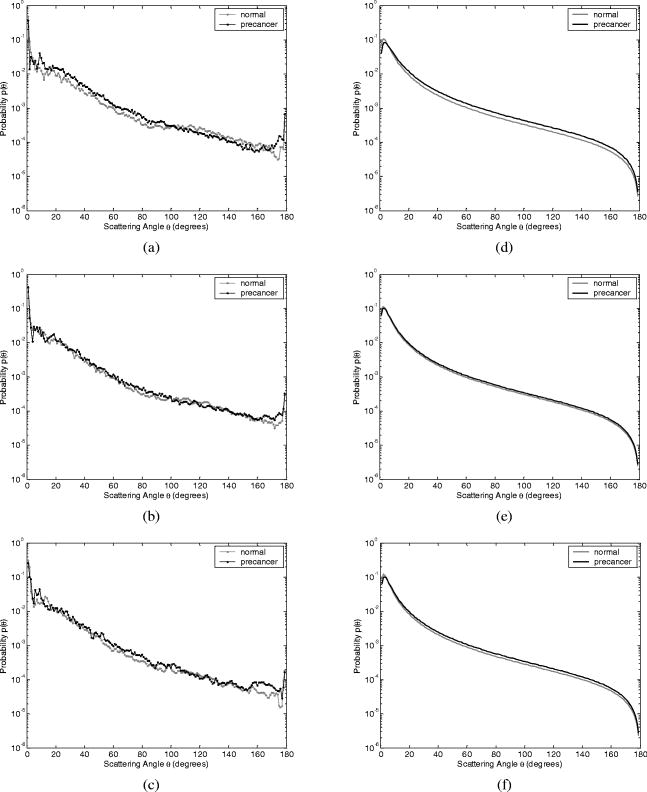
Optical probing depth, or the extent of the tissue volume to which the optical probe is most sensitive, depends on the source-detector geometry. We model three fiber optic probe geometries to determine the extent of influence of using FDTD phase functions for different designs. The first design represents the simplest arrangement, where the source and detector fibers are oriented side by side and perpendicular to the surface, and is widely used in research and clinical settings.33 Extensive efforts have recently been made to design probe geometries with increased selectivity for optical signals from the top epithelial layer, since early identification of changes in epithelial cells is expected to be of significant importance in cancer diagnostics. The second and third designs are based on previous studies that suggest using tilted source and detector fibers to limit the penetration depth of photons, 9, 10, 11, 12, 14, 34, 35, 36 or coupling fibers to a half-ball lens such that the flat surface of the lens faces the tissue.10 The three different probe geometries modeled are illustrated in Fig. 1 . In all cases, both the source fiber and the detector fiber were assigned a diameter and a numerical aperture of 0.11 (in air), and their refractive indices were set to 1.5. The material between the fiber tips was assumed to be highly absorptive, suppressing any internal reflection of incoming photons. For the first two designs [Figs. 1a and 1b], center-to-center source-detector separation was , whereas for the third design [Fig. 1c], was set to . The tilt angle for the second design was chosen to be . The third design involved a sapphire half-ball lens of radius and a flat sapphire window of thickness , while the thickness of the air gap between the fiber tips and the top of the lens was . The refractive index of sapphire is known to be wavelength dependent and was set to 1.78 at , 1.77 at , and 1.76 at . Fig. 1Fiber optic probe geometries with (a) perpendicularly oriented, (b) tilted, and (c) half-ball lens coupled source and detector fibers. In (a) and (b), fiber tips are polished parallel to the tissue surface, and in (c), the source and detector fibers are symmetrically oriented about the central axis of the lens.  The fixed-weight Monte Carlo code used for the simulations presented in this work was implemented in C/C++ and has been previously described.10 The output of each simulation includes the total number of reflected photons detected, maximum penetration depths of detected photons, and scattering angles that detected photons undergo in each tissue layer. Three simulations, each with input photons, were carried out for each set of optical properties and phase function, and the results presented represent averages over these three simulations. 3.Results3.1.Finite-Difference Time-Domain Simulation ResultsFigure 2 shows the phase functions obtained using the FDTD method at , 500, and . These functions, denoted by , describe the probability of scattering at an angle and have been calculated using Eq. 5, where the descriptive subsript FDTD in has been dropped for notational simplicity. The plots on the left side of the figure [Figs. 2a, 2b, 2c] present the phase functions for normal epithelial cells, and the plots on the right side [Figs. 2d, 2e, 2f] present the phase functions for precancerous epithelial cells. Note again that the results shown for each wavelength and for each diagnostic category correspond to the averages over three simulations with different cell parameters. The angular resolution for the scattering angle is for each plot. The probability of scattering at 0 and is zero due to the inclusion of the factor, and these data points have been excluded from the semilog plots. Fig. 2Comparison of FDTD and HG phase functions for normal epithelial cells at (a) , ; (b) , ; and (c) , ; and for precancerous epithelial cells at (d) , ; (e) , ; and (f) , .  To facilitate comparison of the FDTD phase functions to analytical HG phase functions with identical anisotropy factors, Fig. 2 also shows the HG functions computed using a discretized version of Eq. 3 and plotted over the FDTD results. The subscript HG in has again been dropped for notational simplicity. It is observed that HG phase functions are mainly good approximations of the FDTD results that show quite frequent variations over the entire angular range . However, there exist subtle but distinct differences between FDTD and HG functions. FDTD functions are characterized by relatively higher forward scattering probability and higher high-angle scattering probability for all six cases considered. It is also apparent that FDTD functions tend to suggest decreased probability of scattering for the angular range , increased probability of scattering for , and decreased probability of scattering for compared to HG functions. For normal epithelial cells, the behavior of phase functions over the angular range is wavelength dependent: for , scattering probability for this range is higher for the FDTD phase function compared to the HG phase function [Fig. 2a]; for , FDTD and HG phase functions overlap [Fig. 2b]; and for , scattering probability is higher for the HG phase function compared to the FDTD phase function [Fig. 2c]. Phase functions for precancerous epithelial cells demonstrate a more consistent trend over this same angular range: for all the wavelengths considered, scattering probability is higher for HG phase functions, and the largest differences between FDTD and HG functions arise for . Figure 3 combines the FDTD or HG results for normal and precancerous cells on the same plot for each of the wavelengths simulated. As in the case of Fig. 2, the data points for 0 and have been excluded from the semilog plots. FDTD results on the left side of the figure [Figs. 3a, 3b, 3c] highlight the changes in phase functions of epithelial cells due to precancer. At , the FDTD phase function for precancerous cells is well above the phase function for normal cells over the angular range , indicating increased probability of scattering for this range. The trend reverses for , where the probability of scattering for precancerous cells appears to be lower compared to the normal case. For angles , the scattering probability for precancerous cells exceeds the scattering probability for normal cells. At and , the phase functions for precancerous cells tend to be slightly higher compared to the phase functions for normal cells up to . For the angular range , the phase functions for normal and precancerous cells overlap, and for , the scattering probability for precancerous cells again exceeds the scattering probability for normal cells at both wavelengths. The plots on the right side of Fig. 3 [Figs. 3d, 3e, 3f] show the corresponding HG phase functions with identical anisotropy factors as the FDTD phase functions. It is apparent that differences between HG phase functions for normal and precancerous cases are very similar for all wavelengths, and scattering probability is almost always higher for precancerous cells. 3.2.Verification of the Combined Monte Carlo/Finite-Difference Time-Domain AlgorithmIt is possible to keep track of the scattering angles sampled from a given probability distribution during a Monte Carlo run. A normalized histogram generated from the sampled values simply describes the relative frequency of scattering angles and can be directly compared to the input function . Figure 4 shows the results for a standard HG phase function with [Fig. 4a] and for an FDTD phase function with [Fig. 4b]. In both cases, the original HG or FDTD phase function used for model input is represented by a solid line. Histograms of sampled scattering angles have been generated with a bin width of and are plotted using a circular symbol at each data point. The values for 0 and have again been excluded from the plots. Fig. 4Verification of the sampling algorithm used to generate scattering angles from a given probability distribution . (a) Sampling from a standard HG phase function with , and (b) sampling from an FDTD phase function with . In both cases, the histogram of sampled scattering angles generated during a Monte Carlo run (●) is compared to the original HG or FDTD function used as model input (—).  The results in Fig. 4 verify that the sampling algorithm can regenerate used as input for Monte Carlo simulations. There is extremely good agreement between the original HG or FDTD phase functions and the corresponding histograms generated from the sampled scattering angles. Some deviations occur for large scattering angles close to , but considering that the probability functions cover a dynamic range of about five orders of magnitude, it is not surprising to see slight discrepancies for large angles where the probability of scattering is usually the lowest. Note that when scattering angles are obtained using the HG phase function in a standard MC implementation, the expression given in Eq. 1 can easily be inverted to obtain an analytical function to be used in conjunction with a random number generator.15 Here, a discretized version of the function has been created to be used as model input only for verification purposes. An angular distribution identical to that shown in Fig. 4a is obtained when the conventional inverse-transform technique15 is applied to an HG phase function with . 3.3.Combined Monte Carlo/Finite-Difference Time-Domain Simulation ResultsMonte Carlo simulations were performed to assess the influence of using FDTD phase functions on modeled tissue reflectance. To this extent, simulations with FDTD phase functions were repeated using standard HG phase functions with identical anisotropy factors and keeping all the other optical properties constant. Parameters analyzed include detected reflectance intensity that corresponds to the number of photons remitted and collected out of input photons, average maximum penetration depth of detected photons, which provides information about the optical probing depth of a given source-detector fiber geometry, and percentage of photons collected from epithelium that reveals the layer selectivity associated with the source-detector geometry in question. As indicated before, three simulations were carried out for each case considered, and the results presented correspond to the averages over three different simulations. The standard errors computed were negligibly small compared to the averages , indicating convergence of Monte Carlo results. 3.3.1.Detected reflectance intensityFigure 5 shows the detected reflectance intensity at , 500, and for three different fiber optic probe designs illustrated in Fig. 1. Simulation results for HG and FDTD phase functions are plotted separately for both normal and precancerous epithelial tissue. Error bars corresponding to the standard error values over three simulations are the same size as or smaller than the symbols shown. Fig. 5Number of detected photons for normal and precancerous epithelial tissue at , 500, and for three different probe designs, where the source and detector fibers are (a) oriented perpendicular to the tissue surface, (b) tilted at with respect to the tissue surface, and (c) half-ball lens coupled. 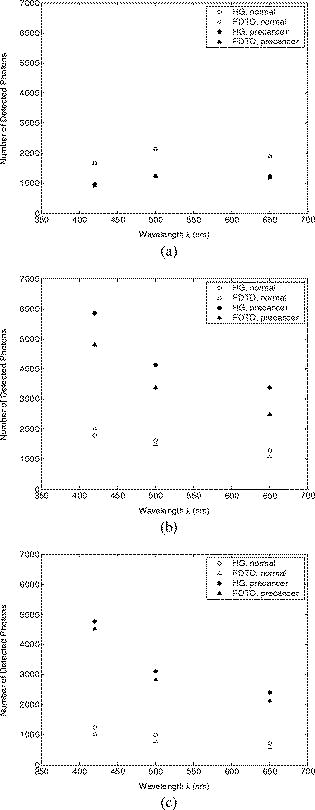 The results in Fig. 5 demonstrate that for the probe design with perpendicularly oriented source and detector fibers, the detected reflectance intensity does not depend on the phase function used, since the total number of photons detected is the same for both HG and FDTD phase functions [Fig. 5a]. For probe designs with tilted and lens coupled fibers, however, the exact form of the phase function used strongly affects the detected reflectance intensity, especially for precancerous tissue [Figs. 5b and 5c]. In almost all cases, the number of photons detected decreases when FDTD phase functions are used. The only exception to this trend occurs for normal tissue at when tilted fibers are used, and the number of photons detected in this case increases when the FDTD phase function is used. The probe design where the source and detector fibers are tilted at with respect to the tissue surface appears to be the most sensitive to the form of the phase function; HG and FDTD simulation results for precancerous tissue differ by , where the high end of this percentage range corresponds to the values at . Note that precancer leads to a decrease in the number of detected photons for perpendicularly oriented fibers, whereas it causes a significant increase in reflectance intensity for the other two probe designs. 3.3.2.Optical probing depth profilesMaximum penetration depths of all the photons collected have been recorded during the MC simulations. Note that maximum penetration depth for a given photon is defined to be the maximum depth in tissue at which the photon undergoes a scattering event. Average maximum penetration depth corresponds to the maximum penetration depth averaged over all detected photons, and this parameter gives valuable information regarding the optical probing depth of a given probe design. Figure 6 shows the average maximum penetration depths computed using HG and FDTD phase functions at , 500, and . Standard error bars for three simulations are again the same size as or smaller than the symbols shown. Horizontal lines in Fig. 6 represent the boundary between the epithelium and the stroma. Fig. 6Average maximum penetration depths for normal and precancerous epithelial tissue at , 500, and for three different probe designs, where the source and detector fibers are (a) oriented perpendicular to the tissue surface, (b) tilted at with respect to the tissue surface, and (c) half-ball lens coupled. Horizontal lines represent the boundary between the epithelium and the stroma.  The results in Fig. 6 show that for all three probe designs simulated, the average maximum penetration depths are not strongly sensitive to the exact form of the phase function used. This is in contrast to the sensitivity observed in Fig. 5 for detected reflectance intensity. In most cases, the use of FDTD phase functions leads to a slight increase in average maximum penetration depth, and the most significant difference occurs at for normal tissue when tilted fibers are used. It is important to note that for the probe design with perpendicularly oriented fibers, the average maximum penetration depth is always greater than the thickness of the epithelial layer [Fig. 6a], suggesting that photons penetrate deep into the stroma. Probe geometries with tilted and lens coupled source and detector fibers, on the other hand, are most of the time preferentially sensitive to the epithelium, as evidenced by average maximum penetration depths that are smaller than the thickness of the epithelial layer [Figs. 6b and 6c]. Also note that the penetration depths calculated for precancerous tissue are smaller compared to the depths calculated for normal tissue, and this suggests that the same geometry probes more superficial tissue depths when precancer is present. 3.3.3.Layer selectivityFigure 7 shows the percentage of detected photons that only scatter in the epithelium without penetrating into the stroma. This parameter is expected to provide information about the layer selectivity of a given probe design. Simulation results for HG and FDTD phase functions are plotted separately at , 500, and . Error bars corresponding to the standard error values over three simulations are negligibly small and have been omitted from the plots. Fig. 7Percentage of photons collected from epithelium for normal and precancerous epithelial tissue at , 500, and for three different probe designs, where the source and detector fibers are (a) oriented perpendicular to the tissue surface, (b) tilted at with respect to the tissue surface, and (c) half-ball lens coupled.  As in the case of average maximum penetration depths, the results for percentage of photons detected from epithelium are not very sensitive to the exact form of the phase function used. The most significant differences are observed for tilted fibers [Fig. 7b], where FDTD results are characterized by up to a 5% decrease in fraction of photons that only scatter in the epithelium and do not penetrate into the stroma before being remitted and collected. Figure 7 also shows that sensitivity to the epithelial layer increases with precancer, and layer selectivity is best achieved with half-ball lens coupled fibers, where the fraction of photons collected from epithelium is always . 4.Discussion4.1.Finite-Difference Time-Domain Phase FunctionsSince the HG phase function can be described by a simple analytical expression, it is commonly used to describe angular scattering properties of tissues when developing photon propagation models or when implementing inverse algorithms to extract tissue optical properties from measurements. FDTD phase functions and the corresponding HG functions presented in Fig. 2 demonstrate that HG approximation is indeed representative of the overall characteristics of more realistic FDTD functions that incorporate complex interior morphology and dielectric structure of epithelial cells. There are, however, subtle differences between HG and FDTD phase functions, and the main goal of this study was to determine whether these subtle differences lead to significant changes in spectroscopic reflectance signals. In all cases, forward scattering is higher for FDTD functions, and inclusion of nucleus in FDTD modeling is likely to account for this behavior.24 High-angle scattering is sensitive to smaller inclusions such as organelles or nuclear refractive index heterogeneities in the form of chromatin clumps.24, 26, 27 Therefore, increased high-angle scattering probability observed for FDTD functions is again a result of using more realistic cell geometries in FDTD computations. FDTD phase functions are also characterized by a sharp increase in scattering probability at angles very close to . This behavior is consistent with earlier measurements by Flock, Wilson, and Patterson,48 and Mourant, 49 and also with recent findings by Mishchenko 50 about scattering by random particulate media. It is apparent that the differences between HG and FDTD phase functions at intermediate angles depend on wavelength as well as on diagnostic category. Phase functions computed using the FDTD method and presented in Figs. 2 and 3 reflect morphological and structural changes associated with precancer. Increased probability of scattering up to for precancerous cells is most likely due to increased nuclear size and nuclear refractive index.24, 26, 27 The most significant increase tends to occur at , the smallest wavelength considered. This is consistent with the fact that for small wavelengths, changes in size and refractive index of the scattering structure are expected to have a more dramatic effect on its small-angle scattering properties. Since the phase functions presented are by definition normalized, a large increase in small-angle scattering probability at for precancerous cells has resulted in a relative decrease of scattering probability over . Increased scattering probability of precancerous cells at all wavelengths for is most likely due to aggregation of chromatin clumps and hence increased variation in nuclear refractive index profile.24, 26, 27 Increase in high-angle scattering from tumorigenic cells has been previously reported by Ramachandran, 51 who carried out angle-dependent light-scattering measurements on tumorigenic and nontumorigenic cells. 4.2.Influence of Using Finite-Difference Time-Domain Phase Functions on Modeled ReflectanceThe results presented indicate that when the optical illumination and detection system is sensitive to the epithelial layer, detected reflectance intensity is highly dependent on the exact form of the phase function used to describe scattering from epithelial cells. MC simulations carried out using HG phase functions with identical anisotropy factors as the FDTD phase functions, and keeping all other optical properties constant, illustrate that there can be extensive differences in the number of photons collected from tissue, and the extent of these differences can vary depending on the probing depth of the probe geometry, as well as on changes in optical properties due to precancer. When perpendicularly oriented source and detector fibers are used to illuminate tissue and to collect remitted photons, the form of the phase function employed in simulations does not have any influence on the number of detected photons, as evidenced in Fig. 5. The probe geometry with perpendicularly oriented source and detector fibers is largely sensitive to deep portions of the tissue; most of the photons collected enter the stroma and scatter multiple times before being remitted at the tissue surface. This is verified later in Figs. 6 and 7 that provide information about the probing depth of the probe geometry and the percentage of photons that only scatter in epithelium and do not enter the stroma before being detected. The results shown indicate that this geometry is characterized by a probing depth that is much greater than the epithelial thickness and cannot selectively target the epithelial layer. In this case, it is not surprising at all that the form of the epithelial phase function does not have any influence on detected reflectance. Note that increased epithelial scattering, increased stromal absorption, and decreased stromal scattering that accompany precancer progression lead to an overall decrease in reflectance intensity, again consistent with the fact that perpendicularly oriented source and detector fibers are sensitive to stromal optical properties. The most significant difference in probing depth and percentage of photons collected from epithelium for normal and precancerous tissue occurs at , where stromal absorption is the greatest. The probe geometry with tilted source and detector fibers shows increased selectivity for epithelium and hence increased sensitivity to the exact form of the phase function used. Moreover, when the phase functions presented in Fig. 2 are examined in detail, it is possible to find a one-to-one correspondence between differences in HG and FDTD phase functions and the resulting differences in the number of detected photons shown in Fig. 5. For example, it is obvious that tilted source and detector fibers are very sensitive to the phase function over the angular range . At , the FDTD phase function exceeds the HG phase function for normal epithelial cells, resulting in a greater number of detected photons when the FDTD phase function is used in Monte Carlo simulations. At , HG and FDTD phase functions for normal epithelial cells overlap, and no significant phase function dependency can be observed in detected reflectance intensity. Finally, at , the FDTD phase function for normal epithelial cells is below the corresponding HG phase function, and this directly leads to a decrease in detected reflectance intensity when the FDTD function is used in MC simulations. The observation that tilted fibers are sensitive to the phase function over holds true for precancerous tissue as well. The most significant difference in detected reflectance intensity occurs at , where the extent of differences between HG and FDTD phase functions over this angular range is the greatest. In contrast to the case with perpendicularly oriented fibers, precancer leads to an increase in detected reflectance intensity, since increased epithelial scattering is the decisive factor and precancerous changes in stromal optical properties do not contribute extensively to alterations in reflectance profiles. It is important to note that the form of the phase function used has a greater influence on detected reflectance when precancerous tissue is modeled. This is in line with increased epithelial scattering associated with precancer, and hence a greater sensitivity to any changes in angular scattering properties of epithelial cells. The probe design with lens coupled fibers shows the greatest selectivity for the epithelial layer, as evidenced in Figs. 6 and 7. The use of FDTD phase functions leads to a consistent decrease in detected reflectance intensity. This behavior suggests that lens coupled fibers are likely to be most sensitive to the phase function over . Precancer leads to an increase in the number of detected photons and an increase in sensitivity to the phase function, as was the case with tilted fibers. In addition to basing the relationship between the phase functions and the corresponding Monte Carlo modeling results on visual inspection of these functions, we can carry out a more quantitative analysis to identify specific angular ranges to which each probe design is most sensitive. This can be achieved computationally by keeping track of all the angles each detected photon scatters through before getting detected. Figure 8 shows typical distributions of angles through which detected photons scatter in the epithelium for probe designs where the source and detector fibers are tilted and lens coupled. These results have been obtained using HG or FDTD phase function and optical properties for precancerous epithelial tissue at . The normalized histograms generated with a bin width of validate our observations that tilted fibers are sensitive to the phase function over , whereas lens coupled fibers are sensitive to the phase function over . Similar distributions (not shown) are obtained for other combinations of optical properties and HG or FDTD phase functions. It is important to note that when each fiber is tilted at , most photons have to undergo scattering through to reach the detector fiber. Therefore, the peak in angular distribution at around is not surprising for the case of tilted fibers [Figs. 8a and 8c]. The distribution of scattering angles peaks at around for lens coupled fibers [Figs. 8b and 8d], indicating that this geometry can be considered to be roughly equivalent to a design where the source and detector fibers are tilted at . Also note that the distributions shown in Fig. 8 represent averages over three simulations with input photons. Keeping track of all scattering angles during MC simulations is memory intensive, and a smaller number of input photons were used to generate the histograms presented. Even though the distributions are characterized by sudden jumps, they provide a useful insight into the basic trends observed. In our simulations, we also recorded the number of scattering events each detected photon undergoes in each tissue layer. The results for both tilted and lens coupled fiber geometries suggest that the majority of detected photons either undergo a single intermediate-angle scattering event in the epithelium, or experience one to three near-forward or small-angle scattering events, followed by an intermediate-angle scattering event that reverses their path toward the detector before they even reach the stroma. This is consistent with the distributions in Fig. 8, where small-angle scattering probability is observed to be highly pronounced, along with the apparent enhancement of scattering probability over an intermediate angular interval identified earlier as the sensitivity range for each probe design. Fig. 8Distribution of angles through which detected photons scatter in the epithelium for two probe designs, where the source and detector fibers are (a) and (c) tilted at with respect to the tissue surface, and (b) and (d) half-ball lens coupled. The normalized histograms shown correspond to simulation results obtained using HG or FDTD phase function and optical properties for precancerous epithelial tissue at . 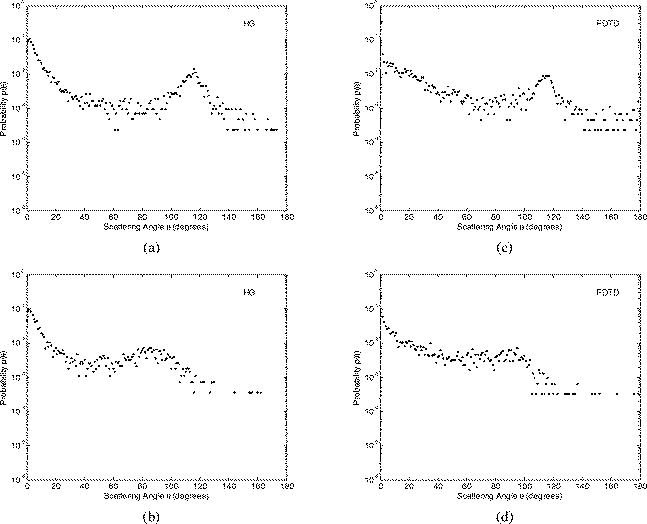 It should be emphasized that probe designs used in this study were characterized by small-sized fibers with a low numerical aperture. This is especially important for tilted and lens coupled fiber geometries that are optimized to demonstrate significant sensitivity to the top epithelial layer and hence to the epithelial phase function. If we increase the size or the numerical aperture of the source and detector fibers, or if we change the source-detector separation, photons will no longer be effectively localized to the epithelium and the contribution of stromal scattering will increase, diminishing the influence of epithelial phase function on detected reflectance. Using small-sized fibers with a low numerical aperture surely results in collection of fewer photons, but a decrease in optical signal strength down to an acceptable level is a tradeoff to ensure selective probing of the epithelial layer, which is of extreme importance in cancer diagnostics.10 4.3.ImplicationsThe work described here combines MC modeling with the powerful FDTD technique that can be used to generate realistic tissue phase functions. The results presented provide strong evidence that the form of the phase function can play an important role in determining the reflectance profile of tissues. MC simulations indicate that when the probe geometry is sensitive to the epithelium, subtle differences in the shape of epithelial phase functions translate into significant changes in the number of photons detected; FDTD and HG phase functions with the same anisotropy factor but different shapes can lead to significantly different results for detected reflectance intensity. It is interesting to note, however, that these differences do not lead to major changes in the probing depth of the geometry considered. This suggests that even though the form of the phase function does not affect the depth range to which the probe geometry is sensitive, it may lead to the collection of more or fewer photons from the same tissue volume, resulting in changes in the intensity of the optical signals acquired. The form of the phase function may also alter the wavelength dependence of the measured light intensity. The dependence of tissue reflectance on the exact form of the phase function needs to be taken into account when developing photon propagation models to computationally predict the optical response of tissues. It is also necessary to consider the influence of the phase function when implementing inverse algorithms to analyze optical measurements and to estimate tissue optical parameters from these measurements. Most studies tend to focus on extracting scattering and absorption coefficients from optical signals by assuming a simple analytical form for the phase function. This may lead to possible errors in reconstructed optical parameters and hence to misinterpretation of the measurements, especially when small source-detector separations are used. It should be noted that this study focused on analyzing the effect of angular scattering properties of epithelial cells. The FDTD method has recently been applied to study micro-optical properties of collagen fibers that constitute the stromal layer.52 The work presented here can be extended to use combined MC/FDTD modeling to assess the influence of using realistic phase functions for the stroma as well. In that case, probe designs that target the stromal layer are expected to demonstrate significant sensitivity to the exact form of the phase function used. 5.ConclusionsIn summary, combined MC/FDTD modeling provides a useful computational framework that allows simultaneous consideration of macroscopic as well as microscopic optical properties of tissues. The exact form of the angular scattering probability distribution for tissue scatterers can significantly influence photon transport and needs to be taken into account in biophotonic analysis. AcknowledgmentsThis research was funded by TRNC Ministry of Education and Culture and Eastern Mediterranean University (grants MEKB-06-01 and BAP-A-07-21). ReferencesR. Drezek,
K. Sokolov,
U. Utzinger,
I. Boiko,
A. Malpica,
M. Follen, and
R. Richards-Kortum,
“Understanding the contributions of NADH and collagen to cervical tissue fluorescence spectra: modeling, measurements, and implications,”
J. Biomed. Opt., 6
(4), 385
–396
(2001). https://doi.org/10.1117/1.1413209 1083-3668 Google Scholar
I. V. Meglinski and
S. J. Matcher,
“Computer simulation of the skin reflectance spectra,”
Comput. Methods Programs Biomed., 70 179
–186
(2003). https://doi.org/10.1016/S0169-2607(02)00099-8 0169-2607 Google Scholar
D. Hidovic-Rowe and
E. Claridge,
“Modelling and validation of spectral reflectance for the colon,”
Phys. Med. Biol., 50 1071
–1093
(2005). https://doi.org/10.1088/0031-9155/50/6/003 0031-9155 Google Scholar
J. Swartling,
J. Svensson,
D. Bengtsson,
K. Terike, and
S. Andersson-Engels,
“Fluorescence spectra provide information on the depth of fluorescent lesions in tissue,”
Appl. Opt., 44 1934
–1941
(2005). https://doi.org/10.1364/AO.44.001934 0003-6935 Google Scholar
D. Arifler,
C. MacAulay,
M. Follen, and
R. Richards-Kortum,
“Spatially resolved reflectance spectroscopy for diagnosis of cervical precancer: Monte Carlo modeling and comparison to clinical measurements,”
J. Biomed. Opt., 11 064027
(2006). https://doi.org/10.1117/1.2398932 1083-3668 Google Scholar
T. J. Pfefer,
K. T. Schomacker,
M. N. Ediger, and
N. S. Nishioka,
“Light propagation in tissue during fluorescence spectroscopy with single-fiber probes,”
IEEE J. Sel. Top. Quantum Electron., 7 1004
–1012
(2001). https://doi.org/10.1109/2944.983306 1077-260X Google Scholar
T. J. Pfefer,
K. T. Schomacker,
M. N. Ediger, and
N. S. Nishioka,
“Multiple-fiber probe design for fluorescence spectroscopy in tissue,”
Appl. Opt., 41 4712
–4721
(2002). https://doi.org/10.1364/AO.41.004712 0003-6935 Google Scholar
C. Zhu,
Q. Liu, and
N. Ramanujam,
“Effect of fiber optic probe geometry on depth-resolved fluorescence measurements from epithelial tissues: a Monte Carlo simulation,”
J. Biomed. Opt., 8
(2), 237
–247
(2003). https://doi.org/10.1117/1.1559058 1083-3668 Google Scholar
M. C. Skala,
G. M. Palmer,
C. Zhu,
Q. Liu,
K. M. Vrotsos,
C. L. Marshek-Stone,
A. Gendron-Fitzpatrick, and
N. Ramanujam,
“Investigation of fiber-optic probe designs for optical spectroscopic diagnosis of epithelial pre-cancers,”
Lasers Surg. Med., 34 25
–38
(2004). https://doi.org/10.1002/lsm.10239 0196-8092 Google Scholar
D. Arifler,
R. A. Schwarz,
S. K. Chang, and
R. Richards-Kortum,
“Reflectance spectroscopy for diagnosis of epithelial precancer: model-based analysis of fiber-optic probe designs to resolve spectral information from epithelium and stroma,”
Appl. Opt., 44 4291
–4305
(2005). https://doi.org/10.1364/AO.44.004291 0003-6935 Google Scholar
T. J. Pfefer,
A. Agrawal, and
R. A. Drezek,
“Oblique-incidence illumination and collection for depth-selective fluorescence spectroscopy,”
J. Biomed. Opt., 10 044016
(2005). https://doi.org/10.1117/1.1989308 1083-3668 Google Scholar
A. M. J. Wang,
J. E. Bender,
J. Pfefer,
U. Utzinger, and
R. A. Drezek,
“Depth-sensitive reflectance measurements using obliquely oriented fiber probes,”
J. Biomed. Opt., 10 044017
(2005). https://doi.org/10.1117/1.1989335 1083-3668 Google Scholar
C. Zhu,
G. M. Palmer,
T. M. Breslin,
F. Xu, and
N. Ramanujam,
“Use of a multiseparation fiber optic probe for the optical diagnosis of breast cancer,”
J. Biomed. Opt., 10 024032
(2005). https://doi.org/10.1117/1.1897398 1083-3668 Google Scholar
A. Wang,
V. Nammalavar, and
R. Drezek,
“Targeting spectral signatures of progressively dysplastic stratified epithelia using angularly variable fiber geometry in reflectance Monte Carlo simulations,”
J. Biomed. Opt., 12 044012
(2007). https://doi.org/10.1117/1.2769328 1083-3668 Google Scholar
L. Wang,
S. L. Jacques, and
L. Zheng,
“MCML—Monte Carlo modeling of light transport in multi-layered tissues,”
Comput. Methods Programs Biomed., 47 131
–146
(1995). https://doi.org/10.1016/0169-2607(95)01640-F 0169-2607 Google Scholar
F. Bevilacqua and
C. Depeursinge,
“Monte Carlo study of diffuse reflectance at source-detector separations close to one transport mean free path,”
J. Opt. Soc. Am. A, 16 2935
–2945
(1999). 0740-3232 Google Scholar
A. Kienle,
F. K. Forster, and
R. Hibst,
“Influence of the phase function on determination of the optical properties of biological tissue by spatially resolved reflectance,”
Opt. Lett., 26 1571
–1573
(2001). https://doi.org/10.1364/OL.26.001571 0146-9592 Google Scholar
H. Tian,
Y. Liu, and
L. Wang,
“Influence of the third-order parameter on diffuse reflectance at small source-detector separations,”
Opt. Lett., 31 933
–935
(2006). 0146-9592 Google Scholar
J. R. Mourant,
J. Boyer,
A. H. Hielscher, and
I. J. Bigio,
“Influence of the scattering phase function on light transport measurements in turbid media performed with small source-detector separations,”
Opt. Lett., 21 546
–548
(1996). 0146-9592 Google Scholar
M. Canpolat and
J. R. Mourant,
“High-angle scattering events strongly affect light collection in clinically relevant measurement geometries for light transport through tissue,”
Phys. Med. Biol., 45 1127
–1140
(2000). https://doi.org/10.1088/0031-9155/45/5/304 0031-9155 Google Scholar
A. Taflove and
S. C. Hagness, Computational Electrodynamics: The Finite-Difference Time-Domain Method, Artech House, Norwood, MA
(2005). Google Scholar
A. Dunn and
R. Richards-Kortum,
“Three-dimensional computation of light scattering from cells,”
IEEE J. Sel. Top. Quantum Electron., 2 898
–905
(1996). https://doi.org/10.1109/2944.577313 1077-260X Google Scholar
R. Drezek,
A. Dunn, and
R. Richards-Kortum,
“Light scattering from cells: finite-difference time-domain simulations and goniometric measurements,”
Appl. Opt., 38 3651
–3661
(1999). https://doi.org/10.1364/AO.38.003651 0003-6935 Google Scholar
R. Drezek,
A. Dunn, and
R. Richards-Kortum,
“A pulsed finite-difference time-domain (FDTD) method for calculating light scattering from biological cells over broad wavelength ranges,”
Opt. Express, 6 147
–157
(2000). 1094-4087 Google Scholar
N. N. Boustany,
R. Drezek, and
N. V. Thakor,
“Calcium-induced alterations in mitochondrial morphology quantified in situ with optical scatter imaging,”
Biophys. J., 83 1691
–1700
(2002). 0006-3495 Google Scholar
R. Drezek,
M. Guillaud,
T. Collier,
I. Boiko,
A. Malpica,
C. MacAulay,
M. Follen, and
R. Richards-Kortum,
“Light scattering from cervical cells throughout neoplastic progression: influence of nuclear morphology, DNA content, and chromatin texture,”
J. Biomed. Opt., 8
(1), 7
–16
(2003). https://doi.org/10.1117/1.1528950 1083-3668 Google Scholar
D. Arifler,
M. Guillaud,
A. Carraro,
A. Malpica,
M. Follen, and
R. Richards-Kortum,
“Light scattering from normal and dysplastic cervical cells at different epithelial depths: finite-difference time-domain modeling with a perfectly matched layer boundary condition,”
J. Biomed. Opt., 8
(3), 484
–494
(2003). https://doi.org/10.1117/1.1578640 1083-3668 Google Scholar
J. He,
A. Karlsson,
J. Swartling, and
S. Andersson-Engels,
“Light scattering by multiple red blood cells,”
J. Opt. Soc. Am. A, 21 1953
–1961
(2004). 0740-3232 Google Scholar
C. Liu,
C. Capjack, and
W. Rozmus,
“3-D simulation of light scattering from biological cells and cell differentiation,”
J. Biomed. Opt., 10 014007
(2005). https://doi.org/10.1117/1.1854681 1083-3668 Google Scholar
X. Li,
A. Taflove, and
V. Backman,
“Recent progress in exact and reduced-order modeling of light-scattering properties of complex structures,”
IEEE J. Sel. Top. Quantum Electron., 11 759
–765
(2005). https://doi.org/10.1109/JSTQE.2005.857691 1077-260X Google Scholar
R. S. Brock,
X. Hu,
D. A. Weidner,
J. Mourant, and
J. Q. Lu,
“Effect of detailed cell structure on light scattering distribution: FDTD study of a B-cell with 3D structure constructed from confocal images,”
J. Quant. Spectrosc. Radiat. Transf., 102 25
–36
(2006). https://doi.org/10.1016/j.jqsrt.2006.02.075 0022-4073 Google Scholar
L. G. Koss, Diagnostic Cytology and Its Histopathologic Bases,
(1992) Google Scholar
U. Utzinger and
R. Richards-Kortum,
“Fiber optic probes for biomedical optical spectroscopy,”
J. Biomed. Opt., 8
(1), 121
–147
(2003). https://doi.org/10.1117/1.1528207 1083-3668 Google Scholar
L. Nieman,
A. Myakov,
J. Aaron, and
K. Sokolov,
“Optical sectioning using a fiber probe with an angled illumination-collection geometry: evaluation in engineered tissue phantoms,”
Appl. Opt., 43 1308
–1319
(2004). https://doi.org/10.1364/AO.43.001308 0003-6935 Google Scholar
A. Wang,
V. Nammalavar, and
R. Drezek,
“Experimental evaluation of angularly variable fiber geometry for targeting depth-resolved reflectance from layered epithelial tissue phantoms,”
J. Biomed. Opt., 12 044011
(2007). https://doi.org/10.1117/1.2769331 1083-3668 Google Scholar
J. R. Mourant,
T. J. Bocklage,
T. M. Powers,
H. M. Greene,
K. L. Bullock,
L. R. Marr-Lyon,
M. H. Dorin,
A. G. Waxman,
M. M. Zsemlye, and
H. O. Smith,
“In vivo light scattering measurements for detection of precancerous conditions of the cervix,”
Gynecol. Oncol., 105 439
–445
(2007). 0090-8258 Google Scholar
T. Binzoni,
T. S. Leung,
A. H. Gandjbakhche,
D. Rüfenacht, and
D. T. Delpy,
“Comment on ‘The use of the Henyey-Greenstein phase function in Monte Carlo simulations in biomedical optics’,”
Phys. Med. Biol., 51 L39
–L41
(2006). 0031-9155 Google Scholar
J. Banks, J. S. Carson II, B. L. Nelson, and
D. M. Nicol, Discrete-Event System Simulation, Pearson Prentice Hall, Englewood Cliffs, NJ
(2005). Google Scholar
P. Thueler,
I. Charvet,
F. Bevilacqua,
M. St. Ghislain,
G. Ory,
P. Marquet,
P. Meda,
B. Vermeulen, and
C. Depeursinge,
“In vivo endoscopic tissue diagnostics based on spectroscopic absorption, scattering, and phase function properties,”
J. Biomed. Opt., 8
(3), 495
–503
(2003). https://doi.org/10.1117/1.1578494 1083-3668 Google Scholar
E. Berrocal,
D. L. Sedarsky,
M. E. Paciaroni,
I. V. Meglinski, and
M. A. Linne,
“Laser light scattering in turbid media—Part I: Experimental and simulated results for the spatial intensity distribution,”
Opt. Express, 15 10649
–10665
(2007). https://doi.org/10.1364/OE.15.010649 1094-4087 Google Scholar
J. M. Schmitt and
G. Kumar,
“Turbulent nature of refractive-index variations in biological tissue,”
Opt. Lett., 21 1310
–1312
(1996). 0146-9592 Google Scholar
H. Fang,
M. Ollero,
E. Vitkin,
L. M. Kimerer,
P. B. Cipolloni,
M. M. Zaman,
S. D. Freedman,
I. J. Bigio,
I. Itzkan,
E. B. Hanlon, and
L. T. Perelman,
“Noninvasive sizing of subcellular organelles with light scattering spectroscopy,”
IEEE J. Sel. Top. Quantum Electron., 9 267
–276
(2003). https://doi.org/10.1109/JSTQE.2003.812515 1077-260X Google Scholar
J. D. Wilson,
C. E. Bigelow,
D. J. Calkins, and
T. H. Foster,
“Light scattering from intact cells reports oxidative-stress-induced mitochondrial swelling,”
Biophys. J., 88 2929
–2938
(2005). https://doi.org/10.1529/biophysj.104.054528 0006-3495 Google Scholar
M. Xu and
R. R. Alfano,
“Fractal mechanisms of light scattering in biological tissue and cells,”
Opt. Lett., 30 3051
–3053
(2005). https://doi.org/10.1364/OL.30.003051 0146-9592 Google Scholar
B. Beauvoit,
T. Kitai, and
B. Chance,
“Contribution of the mitochondrial compartment to the optical properties of the rat liver: a theoretical and practical approach,”
Biophys. J., 67 2501
–2510
(1994). 0006-3495 Google Scholar
J. D. Wilson,
W. J. Cottrell, and
T. H. Foster,
“Index-of-refraction-dependent subcellular light scattering observed with organelle-specific dyes,”
J. Biomed. Opt., 12 014010
(2007). https://doi.org/10.1117/1.2437765 1083-3668 Google Scholar
D. C. Walker,
B. H. Brown,
A. D. Blackett,
J. Tidy, and
R. H. Smallwood,
“A study of the morphological parameters of cervical squamous epithelium,”
Physiol. Meas, 24 121
–135
(2003). 0967-3334 Google Scholar
S. T. Flock,
B. C. Wilson, and
M. S. Patterson,
“Total attenuation coefficients and phase functions of tissues and phantom materials at ,”
Med. Phys., 14 835
–841
(1987). https://doi.org/10.1118/1.596010 0094-2405 Google Scholar
J. R. Mourant,
T. M. Johnson,
V. Doddi, and
J. P. Freyer,
“Angular dependent light scattering from multicellular spheroids,”
J. Biomed. Opt., 7
(1), 93
–99
(2002). https://doi.org/10.1117/1.1427053 1083-3668 Google Scholar
M. I. Mishchenko,
L. Liu,
D. W. Mackowski,
B. Cairns, and
G. Videen,
“Multiple scattering by random particulate media: exact 3D results,”
Opt. Express, 15 2822
–2836
(2007). https://doi.org/10.1364/OE.15.002822 1094-4087 Google Scholar
J. Ramachandran,
T. M. Powers,
S. Carpenter,
A. Garcia-Lopez,
J. P. Freyer, and
J. R. Mourant,
“Light scattering and microarchitectural differences between tumorigenic and non-tumorigenic cell models of tissue,”
Opt. Express, 15 4039
–4053
(2007). https://doi.org/10.1364/OE.15.004039 1094-4087 Google Scholar
D. Arifler,
I. Pavlova,
A. Gillenwater, and
R. Richards-Kortum,
“Light scattering from collagen fiber networks: micro-optical properties of normal and neoplastic stroma,”
Biophys. J., 92 3260
–3274
(2007). 0006-3495 Google Scholar
|
||||||||||||||||||||||||||||||||||||||||||||||||||||||||||||||||||||||||