|
|
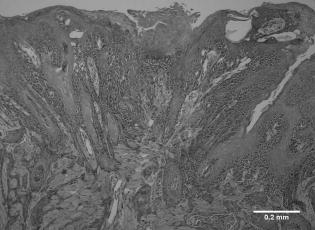
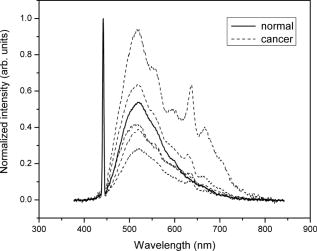
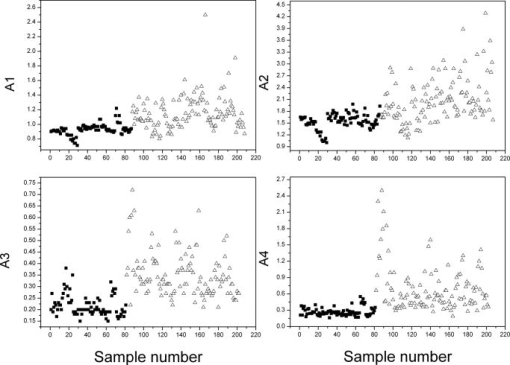
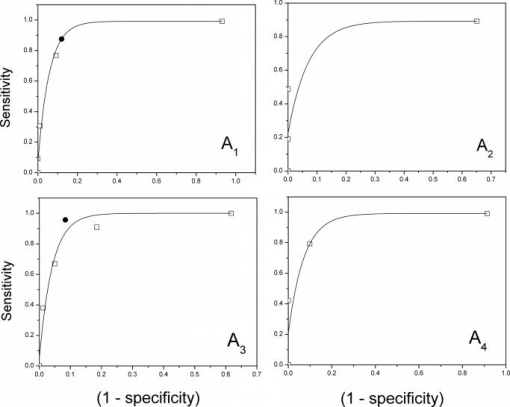
1.IntroductionOral and pharyngeal cancers constitute the sixth most common cancer type globally. In 2002 alone, 274,000 cases of oral cancer were diagnosed.1 Most lesions of the oral cancer originate from the epithelial tissue, which lines the oral cavity, and its etiology is mainly related to tobacco and alcohol intake. Even though the oral cavity is easily accessible for examination, many malignant lesions are still diagnosed at advanced stages, contributing to the high morbidity and mortality rates that have persisted for the past . The 5-yr survival rate for localized disease is 81% but for those with distant metastases2 is only 28%, therefore, early detection of malignant changes in oral cavity may be the most relevant method to improve the treatment success and survival rate. Even with this well-accepted concept, there is no oral cancer screening guideline standardized to low- and/or high-risk populations,3 and it seems that no conclusion can be made about the effectiveness or benefits of current screening programmes based on reported clinical studies.4, 5 The detection of early stages of malignant oral lesions is not simple, since its initial clinical features are very similar to those presented by the more frequent benign conditions. The gold standard for oral cancer diagnosis is histopathological analysis of the suspected lesion. This current procedure is highly dependent on the clinician’s ability to recognize malignant phenotypic features of oral cancer: clinically, to choose a relevant biopsy site, and histologically, to discriminate cellular and tissue characteristics of carcinogenesis. Optical detection has been proposed as an auxiliary tool for the diagnosis of several cancer lesions at different sites including lung, skin, esophagus, and oral cavity. 6, 7, 8, 9, 10, 11, 12 The major advantage pointed out is the fast response through a noninvasive investigation, enabling, for instance, the scanning of large areas in high-risk patients or a better selection of a biopsy site. This is interesting especially considering the field cancerization and condemned mucosa, common features presented by subjects of high tobacco and/or alcohol consumption and patients with history of oral cancer.13, 14 For oral investigation, this technique seems to be attractive since the oral cavity provides easy access and the additional information provided by fluorescence may help clinicians to achieve the diagnosis, especially of those occult lesions. Laser-induced fluorescence (LIF) can provide information regarding the biochemical composition and tissue architecture. In this way, each biological tissue shows a characteristic spectrum. This technique, also called point spectroscopy, evaluates the reemitted light collected from the target tissue after light excitation. Differences in tissue components and structure modifies the fluorescence emission, including its intensity and behavior, so that normal and cancer tissues may be discriminated after fluorescence analysis.12 A fluorescence spectroscopy system is usually composed of a light source for tissue excitation, an investigation Y-type probe, a spectrometer, and a computer. In the probe, a central fiber delivers the excitation light while others collect the light being emitted from the tissue.12 The fluorescence spectrum of each lesion type must be obtained to enable the determination of the unique spectral features that discriminates as neoplasia. This may enable the detection of a lesion through an optical analysis, with no necessity for an invasive procedure. The tongue is a major oral site for squamous cell carcinoma, and even though the oral cavity constitutes a site of direct investigation, it shows poor prognosis mainly due to the delayed diagnosis.2 A noninvasive and direct investigation may play an important role in the diagnosis of oral lesions; physicians and patients are often reluctant to have a biopsy performed on suspicious lesions that have a high probability of benign diagnosis, as well as to perform multiple biopsies in multiple primary tumors or large lesions. The contribution of more information will help the clinician to distinguish the tissue characteristics relevant for diagnosis. The first step for the validation of a diagnostic tool is to evaluate its sensitivity and specificity for detection. The current model involving chemical induction of carcinoma at the lateral tongue in Golden Syrian hamsters provides an appropriate model for the study of the carcinogenic process and enables the evaluation of our proposed diagnostic procedure. Even though humans are not usually exposed to 7,12 dimethylbenz[a]anthracene (DMBA), this carcinogenic agent was chosen due to its application in several animal models for the study of the response of different types of cancer treatment and carcinogenesis characterization. 15, 16, 17, 18, 19, 20, 21 2.Materials and Methods2.1.Carcinoma InductionSeventy-two Golden Syrian hamsters were divided into 12 groups: a control group without any carcinogen contact and the others with DMBA (7,12 dimethylbenz[a]anthracene) induction. The 0.5% DMBA in acetone was topically placed at the central area of the left lateral tongue, three times a week.18 The animals were kept without water supply for to minimize the spread of the carcinogenic solution in the oral cavity and its deglutition. The experimental groups were investigated every 2 weeks after the first month of induction to evaluate the fluorescence and histological changes induced by the carcinogenesis. 2.2.Fluorescence SystemThe fluorescence spectroscopy system used is composed by an excitation laser, a Y-type probe, a spectrometer and a computer (Spectr-Cluster, Cluster, Russia). A laser and a laser were employed as excitation light sources. The probe was connected at one end to the laser and to the spectrometer at the other. A central fiber delivers the excitation light and six surrounding ones, each, collect the reemitted light from the target tissue; the total diameter of the investigation tip is around . The excitation light at the investigation tip is around for both lasers, and each fluorescence spectrum is collected in less than . The spectrometer evaluates the 378- to 842-nm range and its spectrum resolution is . 2.3.Fluorescence MeasurementsThe animals were previously anesthetized with ketamine (Francotar, Virbac, Brazil) and xylazine (Virbaxyl, Virbac, Brazil). The investigated tissue was gently scraped with cotton tips soaked in 0.9% solution to remove any debris covering the tongue surface. The right and the left lateral borders of the tongue were investigated in a posterior/anterior direction; if a clinically visible lesion was present, an adequate number of point measurements were taken to scan the entire altered surface. The probe was perpendicularly placed in gentle contact with the tissue surface. The animals were evaluated every 2 weeks after the first month of induction, monitoring the carcinogenic process. The visual characteristics were recorded for each clinically detectable lesion, taking into account its surface color and heterogeneities. Some examples of clinical appearances are leukoplakia, erythroplakia, heterogenous leukoplakia, ulcerative or exophytic lesion, and presence of necrotic covering tissue or bleeding. An attempt was made to correlate the clinical features for each fluorescence spectrum recorded. 2.4.Histological AnalysisAfter the fluorescence measurements, the animals were sacrificed with anesthesia overdose and the tongues were removed for histological analysis. The diagnosis was performed by three oral pathologists under evaluation of hematoxylin-eosin stained slides of both lateral borders of the tongue. The assigned diagnosis was one of the following: normal squamous mucosa; mild, moderate, or severe epithelial dysplasia; carcinoma in situ, and invasive squamous cell carcinoma. 2.5.Spectrum AnalysisThe spectroscopic data was classified according to the histological diagnosis. The fluorescence spectra from normal and abnormal lateral borders of the tongue were compared to recognize any spectral signature consistent with malignancy. Indices were empirically determined as the ratio of integrated intensities over a selected bandwidth emission. Two discrimination indices were determined for each excitation wavelength. A cut-off value differentiating normal and carcinoma was set for each index and the sensitivity and specificity determined for each condition. The same spectral data set was also processed using a multivariate data analysis at a commercially available software Unscrambler v.9.1 (CAMO, Oslo, Norway). This analysis aims to recognize spectral features that cluster the samples into different groups; it provides a pattern recognition and classification. The first spectral analysis was a type of intraspectral analysis since we determined indices based on a ratio of two emission regions of the same spectrum. The multivariate data analysis is a type of an interspectral analysis where each spectrum is compared to other ones from the same group and the other group. In this last case, the entire spectrum is considered during the analysis to recognize the most valuable diagnostic features. The intra- and interspectral analyses were compared to determine the one showing the highest levels of sensitivity and specificity as a diagnostic tool. 3.Results and DiscussionA high variability of the induced lesions was observed even between the same induction time groups. This is probably due to the inherent intersubject systemic and local differences associated with the carcinogenic process. In this sense, the animals were regrouped following the histopathological analysis, despite the initial grouping. The number of dysplasia samples was small and evaluation of the efficacy of the fluorescence detection for premalignant lesions during the carcinogenic process was not possible. The analysis was then focused on discrimination of normal versus cancer. Even though the clinical characteristics of the squamous cell carcinoma were distinct between the lesions, they were all grouped together according to the histological diagnosis. A histological example of a carcinoma sample is presented at Fig. 1 . This resulted in a cancer group with a dispersed behavior since the distinct clinical characteristics showed different fluorescence spectra; on the other hand, the normal group showed a very similar behavior, even between different animals. Fig. 1Histological slide showing an example of an induced squamous cell carcinoma at the tongue of a hamster.  To eliminate the possible influence of aging at the fluorescence behavior, a group of 10 animals with no exposure to DMBA were investigated monthly up to the total period of 26 weeks. The fluorescence spectra obtained at the right and left lateral tongue showed similar behavior during the total investigated time; the differences observed were only at overall intensity. At the end of 26 weeks, five animals were sacrificed and the tongues removed for histological analysis. No malignant or displastic changes were present, all lateral tongues were diagnosed as showing normal mucosa. An example of the fluorescence spectrum discrimination between normal, at the right lateral tongue, and cancer is shown in Fig. 2 . Each curve represents the fluorescence spectrum collected from an investigation point; note the spectral differences observed for distinct sites with the same squamous cell carcinoma diagnosis. Fig. 2Fluorescence spectra under 442-nm excitation from normal (contralateral) and squamous cell carcinoma at the left lateral tongue are compared. Each curve represents an investigated point and all spectra were normalized at the backscattered excitation wavelength. These are some examples of the variable fluorescence behavior obtained from the cancer lesions.  Several clinical cancer types were achieved: exophytic, ulcerated, showing different levels of invasion, associated or not with leukoplakia and erythroplakia, single or multiple lesions. These all presented with different spectral characteristics. For some cancer lesions, the blue excitation was more efficient and for others the green excitation was better. This illustrates the distinct light interactions that exist for different lesion types, since distinct biochemical and structural characteristics will take place. The inherent difference associated with the use of two wavelengths pertains to the excitation of distinct fluorophores or of the same fluorophores but with different quantum efficiency; and to the light scattering and penetration wavelength dependence. In this way, the 532-nm excitation laser can induce fluorescence from deeper biomolecules and tissue structures. For 442-nm LIF, the major related endogenous fluorophores are flavins (FAD) and porphyrins.12 The FAD fluorescence decrease and the porphyrin-like fluorescence are associated with malignant transformation. Several studies have investigated the fluorescence spectroscopy efficacy for cancer detection in the SCC-induced model of a hamster cheek pouch.19, 20, 21 Our results, even targeting a distinct oral tissue, are in agreement with these studies, showing an increased fluorescence emission around 620 and . The use of endogenous porphyrin as a biomarker for cancer detection is still controversial, as its origin may be related to superficial microbial contamination or neoplastic metabolism.22 However, two main emission peaks were evident in the carcinoma spectra, one around and the other around . This was the optical feature more common at the obtained carcinoma spectra. In the first spectral processing, these emission peaks were considered as markers for malignancy, and four indices were obtained correlating two spectral regions at the same spectrum [Eq. 1], one set as the reference intensity , the more intense emission region, and the other one as the diagnostic intensity . The wavelength intervals for were established according to the laser excitation, the values are shown in Table 1 . Table 1The reference (Ir) and the diagnostic intervals (Id) for each index are presented.
Note that
Ir
was determined as the spectral region of higher fluorescence intensity at the normal spectrum, and the
Id
as the region where distinct emission bands were identified in the cancer spectrum. The dispersed fluorescence behavior observed for different stages of carcinoma development was confirmed according to defined indices. For the four indices determined for each point spectroscopy (sample), the carcinoma group showed the highest degree of variability (Fig. 3 ). Even though the spectral dispersion shows the fluorescence sensitivity for clinical alterations, it results in less specificity when considering the validation of a diagnostic technique due to classification in a single group. The distinct fluorescence behavior will probably confound any kind of mathematical tool proposed for discrimination analysis. Fig. 3Plots of the determined indices for each sample (fluorescence spectrum). The filled squares represent normal samples and the open triangles the cancer samples. Note the variability for the cancer group for all indices.  With the indices, it is possible to establish a limit below which the values indicate a normal site and those above, a carcinoma site. This enables the determination of the sensitivity and specificity of the proposed spectral processing. By varying the limit for the four indices, the best result was achieved with the index , under blue excitation, with a sensitivity of 90.9% and a specificity of 81.5%. The best result under green excitation showed a sensitivity of 76.9% and a specificity of 90.8% for index . Multivariate data analysis can be used for interspectral investigation where different mathematical and statistical analyses are performed to obtain pattern recognition for sample classification. Unscrambler v.9.1 was used for different multivariate analyses and the best results for this group of spectra were obtained with -nearest neighborhood (KNN) analysis showing a sensitivity of 95.7% and a specificity of 91.6% for 442-nm excitation and a sensitivity of 87.5% and a specificity of 88% for . This type of analysis makes a comparison of all samples, in this case, all fluorescence spectra, and clusters the groups, according to their specific fluorescence profiles, but it is not possible to propose a model for the discrimination of an unknown sample, i.e., without defined histological classification. Evaluating the receiver operating characteristic (ROC) curves it is possible to determine the best limits for each index as well as to compare the two spectral analyses employed, the inter- and intraspectral processing. The determination of the limit must take into account both sensitivity and specificity, and because when one increases the other decreases, it is necessary to balance them. Figure 4 presents the ROC curves obtained for the four indices and the results obtained with KNN analysis. In theory, KNN analysis and the intraspectral analysis for the green excitation showed similar results, but for the blue excitation the KNN result was still superior. Fig. 4ROC curves obtained for the four indices varying the limit value for normal versus cancer discrimination. Each open square represents one set limit and the filled diamond shows the KNN result.  The high level of sensitivity and specificity obtained using a noninvasive procedure demonstrates the power of fluorescence spectroscopy as a diagnostic tool for detecting carcinoma, especially considering that the carcinoma group showed such variability. A diagnostic technique with fast response may provide important information for the clinician, helping in lesion classification, the scanning of extensive areas, the lesion margin delineation, and also in choosing the biopsy site. Another attractive application would be for monitoring treatment response where repeated biopsies may be not reasonable. The point spectroscopy can investigate only superficial lesions, since its response is dependent on the excitation light penetration into the tissue and on the collection of the fluorescence exiting from the surface. The volume of the excited tissue and the origin of the emitted fluorescence, are not yet completely understood. The amount of keratinized layer or the presence of a high vascularization will influence the collected fluorescence, the first showing a higher light scattering and the second a higher absorption and so minimizing and modifying the fluorescence evaluated. Another relevant issue that must be noted is that a carcinoma lesion is usually heterogeneous; areas of normal and premalignant pathology are often present side-by-side with neoplastic regions. For diagnostic and treatment purposes, the final diagnosis of the whole lesion is the most malignant pathology, in this case squamous cell carcinoma, even though the fluorescence spectrum could be collected from a displastic or even normal surface of the malignant lesion. This definitely affected our results, since all the spectra from a carcinoma lesion were grouped together, despite the histological and clinical distinct features of the investigated spot. Many factors influence the spectral intensity and structure of the collected fluorescence, and they remain to be defined. Nevertheless, it was possible to achieve levels of 95.7% of sensitivity and 91.6% of specificity, using the LIF spectroscopy in this experimental animal model. The LIF spectroscopy under 442-nm laser excitation was efficient as a diagnostic tool for induced squamous cell carcinoma at the lateral border of the tongue. The distinct clinical characteristics were evident in different fluorescence spectral behaviors. The blue excitation showed the best sensitivity and specificity levels for the normal versus carcinoma discrimination, compared to 532-nm excitation. The inter- and intraspectral analyses performed were similar for green excitation but the KNN analysis showed superior result for blue excitation compared to the index analysis. The results obtained in this study show the viability of using a noninvasive and safe optical technique with a fast response to discriminate induced carcinoma and normal hamster tongue. The spectroscopic fluorescence pattern was efficient in detecting cancer with high sensitivity even in this specific model where the observed high variability in clinical lesion aspects showed in distinct fluorescence spectra. A clinical translation of fluorescence spectroscopy for cancer diagnosis is of great relevance, especially considering its potential use to detect premalignant and occult lesions, to help in the biopsy site location, to monitor treatment response, and in the follow-up of high-risk cancer patients. AcknowledgmentsFAPESP (Fundação de Amparo à Pesquisa do Estado de São Paulo) is acknowledged for financial support and we thank Dr. MMC Ferreira for analysis software use. ReferencesD. M. Parkin,
F. Bray,
J. Ferlay, and
P. Pisani,
“Global cancer statistics, 2002,”
Ca-Cancer J. Clin., 55 74
–108
(2005). 0007-9235 Google Scholar
American Cancer Society,
(2006) Google Scholar
R. Zoorob,
R. Anderson,
C. Cefalu, and
M. Sidani,
“Cancer screening guidelines,”
Am. Fam. Physician, 63
(6), 1101
–1112
(2001). 0002-838X Google Scholar
M. C. Downer,
D. R. Molesm,
S. Palmer, and
P. M. Speight,
“A systematic review of measures of effectiveness in screening for oral cancer and precancer,”
Oral Oncol., 42 551
–560
(2006). https://doi.org/10.1016/j.oraloncology.2005.08.006 0964-1955 Google Scholar
O. Kujan,
A. M. Glenny,
R. J. Oliver,
N. Thakker, and
P. Sloan,
“Screening programmes for the early detection and prevention of oral cancer (review),”
The Cochrane Collaboration, John Wiley & Sons, Ltd.(2006). Google Scholar
E. Profio and
D. R. Doiron,
“A feasibility study of the use of fluorescence bronchoscopy for localization of small lung tumours,”
Phys. Med. Biol., 22
(5), 949
–957
(1977). https://doi.org/10.1088/0031-9155/22/5/014 0031-9155 Google Scholar
G. Zonios,
J. Bykowski, and
N. Kollias,
“Skin melanin, hemoglobin, and light scattering properties can be quantitatively assessed in vivo using diffuse reflectance spectroscopy,”
J. Invest. Dermatol., 117
(6), 1452
–1457
(2001). https://doi.org/10.1046/j.0022-202x.2001.01577.x 0022-202X Google Scholar
S. Anderson-Engels,
G. Canti,
R. Cubeddu,
C. Eker,
C. Klinteberg,
A. Pifferi,
K. Svanberg,
S. Svanberg,
P. Taroni,
G. Valentini, and
I. Wang,
“Preliminary evaluation of two fluorescence imaging methods for the detection and delineation of basal cell carcinomas of the skin,”
Lasers Surg. Med., 26 76
–82
(2000). https://doi.org/10.1002/(SICI)1096-9101(2000)26:1<76::AID-LSM11>3.0.CO;2-4 0196-8092 Google Scholar
I. Georgakoudi,
B. C. Jacobson,
J. Van Dam,
V. Bakman,
M. B. Wallace,
M. G. Muller,
Q. Zhang,
K. Badizadegan,
D. Sun,
G. A. Thomas,
L. T. Perelman, and
M. S. Feld,
“Fluorescence, reflectance, and light-scattering spectroscopy for evaluating dysplasia in patients with Barrett’s esophagus,”
Gastroenterology, 120 1620
–1629
(2001). https://doi.org/10.1053/gast.2001.24842 0016-5085 Google Scholar
A. Gillenwater,
R. Jacob,
R. Ganeshappa,
B. Kemp,
A. K. El-Naggar,
J. L. Palmer,
G. Clayman,
M. F. Mitchell, and
R. Richards-Kortum,
“Noninvasive diagnosis of oral neoplasia based on fluorescence spectroscopy and native tissue autofluorescence,”
Arch. Otolaryngol. Head Neck Surg., 124 1251
–1258
(1998). 0886-4470 Google Scholar
C. S. Betz,
M. Mehlmann,
K. Rick,
H. Stepp,
G. Grevers,
R. Baumgartner, and
A. Leunig,
“Autofluorescence imaging and spectroscopy of normal and malignant mucosa in patients with head and neck cancer,”
Lasers Surg. Med., 25 323
–334
(1999). https://doi.org/10.1002/(SICI)1096-9101(1999)25:4<323::AID-LSM7>3.3.CO;2-G 0196-8092 Google Scholar
N. Ramanujam,
“Fluorescence spectroscopy of neoplastic and non-neoplastic tissues,”
Neoplasia, 2
(1–2), 89
–117
(2000). https://doi.org/10.1038/sj.neo.7900077 1522-8002 Google Scholar
P. J. Thomson and
O. Hamadah,
“Cancerisation within the oral cavity: the use of ‘field mapping biopsies’ in the clinical management,”
Oral Oncol., 43
(1), 20
–26
(2007). 0964-1955 Google Scholar
M. P. Tabor,
R. H. Brakenhoff,
H. J. Ruijter-Schippers,
J. E. van der Wal,
G. B. Snow,
C. R. Leemans, and
B. J. M. Braakhuis,
“Multiple head and neck tunours frequently originate for a single preneoplastic lesion,”
Am. J. Pathol., 161 2051
–2060
(2002). 0002-9440 Google Scholar
B. Mognetti,
F. DiCarlo, and
G. N. Berta,
“Animal models in oral cancer research,”
Oral Oncol., 42 448
–460
(2006). https://doi.org/10.1016/j.oraloncology.2005.07.014 0964-1955 Google Scholar
H. Nakaya,
S. Kawashiri,
A. Tanaka,
N. Noguchi,
K. Kato,
T. Hase, and
E. Yamamoto,
“Influences of angiogenesis and lymphangiogenesis on cancerous invasion in experimentally induced tongue carcinoma,”
J. Oral Pathol. Med., 34 87
–92
(2005). 0904-2512 Google Scholar
S. Wada,
K. Tazawa,
I. Furuta, and
H. Nagae,
“Antitumor effect of new local hyperthermia using dextran magnetite complex in hamster tongue carcinoma,”
Oral Dis., 9 213
–223
(2003). 1354-523X Google Scholar
A. A. Fassoni,
C. L. F. Sales, and
A. Consolaro,
“Carcinogênese bucal quimicamente induzida por DMBA: estudo em hamsters sírios dourados,”
Rev. Odontol. (La Paz), 7
(4), 285
–291
(1993). Google Scholar
S. Balasubramaniam,
V. Elangovan, and
S. Govindaswamy,
“Fluorescence spectroscopic identification of 7,12-dimethylbenz[a]anthracene-induced hamster buccal pouch carcinogenesis,”
Carcinogenesis, 16
(10), 2461
–2465
(1995). https://doi.org/10.1093/carcin/16.10.2461 0143-3334 Google Scholar
N. Vengadesan,
P. Aruna, and
S. Ganesan,
“Characterization of native fluorescence from DMBA-treated hamster cheek pouch bucal mucosa for measuring tissue transformation,”
Br. J. Cancer, 77
(3), 391
–395
(1996). 0007-0920 Google Scholar
J. K. Dhingra,
X. Zhang,
K. McMillian,
S. Kabani,
R. Manoharan,
I. Itzkan,
M. S. Feld, and
S. M. Shapshay,
“Diagnosis of head and neck precancerous lesions in an animal model using fluorescence spectroscopy,”
Laryngoscope, 108
(4, Pt 1), 471
–475
(1998). https://doi.org/10.1097/00005537-199804000-00002 0023-852X Google Scholar
M. Inaguma and
K. Hashimoto,
“Porphyrin-like fluorescence in oral cancer: In vivo fluorescence spectral characterization of lesions by use of a near-ultraviolet excited autofluorescence diagnosis system and separation of fluorescent extracts by capillary electrophoresis,”
Cancer, 86
(11), 2201
–2211
(1999). 0008-543X Google Scholar
|

