|
|
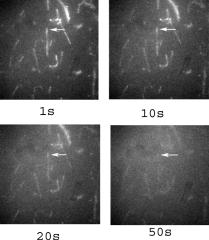
1.IntroductionRecently, it has become possible to study single protein molecules in a cell.1, 2 The advantage of single molecule detection (SMD) is that it studies behavior of proteins in their native (crowded) environment, and avoids problems associated with averaging responses of an assembly of molecules with different kinetics. But the single molecule approach is complicated by photobleaching and cell damage, which arise because a sample must be illuminated with the intense laser beam to assure adequate signal-to-noise ratio (SNR). In earlier work, we were able to decrease photobleaching and reduce photodamage by making measurements on glass coated with nanoparticles known as surface island films (SIFs).3 SIFs are nanoparticles 4, 5, 6, 7, 8, 9, 10 that can support confined charge density oscillations11 called localized surface plasmon polariton (LSP) modes. Excitation of LSPs causes a strong enhancement of local electric fields and a substantial decrease of the fluorescence lifetime caused by the distance-dependent changes in radiative decay rates.12 Specifically, the intensity of rhodamine fluorescence increased four to five fold, and its fluorescence lifetime decreased on average 23 fold. As a consequence, the rate of photobleaching of rhodamine actin in a myofibril placed on glass coverslips coated with SIF decreased approximately seven fold in comparison with photobleaching of myofibrils placed on uncoated coverslips. Recently, we showed that the enhancement could be even further increased when LSPs in nanoparticles were combined with propagating surface plasmons (PSPs) traveling in coverslips covered with a continuous film of noble metal. The interaction of these two kinds of plasmons with fluorophores in muscle caused more than a 200-fold increase of brightness.13 The price of the reduction of bleaching and photodamage was loss of optical resolution and nonuniformity of illumination, because SIF refracted exciting and fluorescent light. Moreover, nanoparticles were distributed randomly on the surface of a coverslip, and therefore reduction of photobleaching and photodamage was nonuniform. This prevented the use of SIF in single molecule detection, because maximal optical resolution is important in resolving single molecules. In studying cells, it is important to observe only a specific area [region of interest (ROI)], where interaction of interest occurs (e.g., cell nucleus). In the example used here—skeletal muscle myofibrils—actin and myosin filaments interact to produce contractile force in a narrow area known as the overlap zone (O-band). It spans the distance of 0.7 to in resting length myofibrils,14, 15 and its length is comparable to the maximal resolution of optical microscopes. The use of SIF prevents one from achieving this resolution. In this work, we show that replacing random, multilayered SIF with nanoparticle monolayers (NMLs) covalently bound to glass does not affect the optical resolution of a microscope while preserving field enhancement and lifetime decrease of SIF, thus leading to reduced photobleaching. This made it possible to observe, for the first time, single molecules in muscle. Muscle is particularly difficult to work with in the SMD regime, because concentration of actin and myosin is in mM range.16 The SMD of motor protein in vitro was accomplished earlier. Novel methods such as total internal reflection fluorescence (TIRF) polarization microscopy17 and defocused orientation/position imaging18 were used to achieve this feat. Earlier work showed that single molecule motion of smooth muscle myosin,19, 20 myosin 5, 18, 21, 22 myosin 6,23, 24 kinesin,25, 26 cytoplasmic dynein, 27 RNA polymerase,28 ATP synthase,29 and the flagellar motor30 can be measured in vitro. The task is more formidable in vivo, where the concentration of proteins is greater ( segment of a single muscle fiber may contain more than actin monomers). Recently, orientation of a single cross-bridge in rigor has been measured in vivo.31 In this work, we visualized single molecules of actin in muscle by labeling actin with phalloidin. Labeling actin with phalloidin offers the essential advantages in that the degree of labeling can be strictly controlled, and that in skeletal muscle (in contrast to cardiac muscle), only the ends of thin filaments are initially labeled.32 This is the region where actin and cross-bridges interact. Thus our data do not contain information contributed by actin in the I-bands or Z-lines, where it does not interact with cross-bridges. Additional advantages are that actin labeling does not affect enzymatic properties of muscle,33, 34 that myofibrils are well preserved, because labeling does not require harsh conditions such as raising the temperature to label myosin light chains, and that fluorescence brightness of phalloidin increases on binding to actin,34 thus increasing SNR. Muscle was illuminated by total internal reflection, and fluorescence was detected using an electron-multiplying charge-coupled device (EMCCD). Back-thinned electron-multiplying CCD cameras have 60% greater quantum efficiency than instruments based on photomultipliers. Wide-field TIRF illumination exploits the fact that a camera is a parallel acquisition device (as opposed to a point-by-point serial scanner), which allows light to be collected over a much longer integration time at each pixel than is possible with scanning devices. A new generation of back-thinned EMCCD has improved photosensitivity, and has a wider dynamic range. These performance characteristics enable imaging at very low light levels.35 The time course of photobleaching was followed with subsecond time resolution. Myofibrils were labeled with decreasing ratios of fluorescence: nonfluorescent phalloidin ranging from to to assure that less than one actin monomer per overlap zone was fluorescent. On glass substrate, the fluorescence of the O-bands decayed in a step-wise fashion due to the discrete bleaching of a fluorophore. On NML coated glass, the fluorescence of a single actin molecule remained approximately constant over . On the average, it decayed four to five times slower than on glass substrate. NML decreased the average amplitude weighted fluorescence lifetime 17 times, and enhanced the fluorescence intensity ten times in comparison with glass. NML decreased photobleaching because decrease in the lifetime of the fluorophore minimized the probability of oxygen attack during the time a fluorescent molecule was in the excited state, and decreased photodamage because field enhancement allowed illumination with a weaker laser beam. 2.Materials and Methods2.1.Chemicals and SolutionsRhodamine-phalloidin (RP) was from Molecular Probes (Eugene, Oregon). Unlabeled phalloidin (UP) was from Sigma (Saint Louis, Missouri). All other chemicals, including phosphocreatine, creatine kinase, glucose oxidase, catalase, and ATP, were from Sigma. Ethylene diamine tetraacetic acid (EDTA)-rigor solution contained , EDTA, DTT, and buffer pH 7.5. Ca-rigor solution contained , , , dithiothreitol (DTT), and buffer pH 7.5. Contracting solution was the same as Ca-rigor, except that it contained in addition ATP. 2.2.Preparation of MyofibrilsMuscle was first washed with cold EDTA-rigor solution for to avoid shortening when transferred from glycerinating solution to homogenizing solution. It was followed by extensive wash with Ca-rigor solution. Myofibrils were homogenized in Ca-rigor as described before.36 2.3.Labeling and Sample PreparationLabeling was carried out in solution. Myofibrils were labeled for with a mixture containing 0.05 to RP containing always UP in Ca-rigor solution. of labeled myofibrils were applied to number 1 cover slips (Corning, New York) precleaned with 90% ethanol. A narrow channel was created by applying a thin layer of Vaseline along the edges of the cover slip. To align myofibrils as much as possible, along the long axis of a cover slip, the sample was applied by streaking the pipette along the long axis. The sample was left for 3 min to allow myofibrils to adhere to glass. The long cover slip was covered with a small cover slip and washed with at least 5 vol of Ca-rigor solution by applying the solution to one end of the channel and absorbing with number 1 filter paper at the other. 2.4.Preparation of Nanoparticle MonolayersAll necessary glassware was soaked in a base bath overnight and washed with deionized water. A solution of silver nitrate was heated and stirred in a Erlenmeyer flask at . aliquots of trisodium citrate solution were added drop-wise. The solution was stirred for and warmed to 96 to . Then five aliquots ( each) of trisodium citrate were added drop-wise to the reaction mixture every 15 to . Stirring was continued for until the milky yellow color remained. Then the mixture was cooled in an ice bath for . The colloids were separated by centrifugation at for . The residues were collected and dissolved in trisodium citrate. For covalent attachment of the nanoparticles to glass cover slips, the cover slips were washed with Alconox soap and rinsed with distilled water. The cover slips were soaked for in to activate the surface, rinsed copiously with distilled water, and soaked overnight at 80 to in a solution of 5% (v/v) aminopropyltriethoxysilane buffered with acetic acid (pH 5.5). The coverslips were rinsed with deionized water, air dried, and placed into a petri dish for drop coating with the sol of silver colloids. About of the colloidal silver sol was drop coated on the desired area of the glass slide/coverslip. The excess of colloidal silver sol was rinsed with deionized water after incubation for two hours at room temperature. The glass coverslips with attached silver nanoparticles were air dried and stored in vials. 2.5.Atomic Force Microscope ImagingImaging was performed on the AFM Explorer ThermoMicroscope (Veeco Instruments, Incorporated, Plainview, New York) in contact scanning mode with a Non-Conductive Silicon Nitride Probe (Veeco Instruments, Incorporated). Images were acquired at a 2- to scan rate with a resolution of 300 pixels per line. Images were then processed with WSxM Version 4.0 software for 3-D structure and analyzed with the Veeco SPMLab Version 6.0.2 software for , , and distance quantification. 2.6.Measuring Fluorescence LifetimesFluorescence lifetimes were measured by time-domain technique using a FluoTime 200 fluorometer (PicoQuant, Incorporated, Berlin, Germany). The sample was positioned in front-face configuration inside the fluorometer chamber. Excitation was by a laser pulsed diode, and the observation was through a monochromator at with a supporting -long wave pass filter. Full width at half maximum (FWHM) of pulse response function was (measured by PicoQuant, Incorporated). Time resolution was better than . Less than 0.5% background was detected from the NML slide. The intensity decays were analyzed in terms of a multiexponential model using FluoFit ver4 software (PicoQuant, Incorporated). 2.7.Optical ImagingThe instrument was described before,37, 38 except that an Olympus IX71 (Olympus, Melville, New York) was used. A Hamamatsu ImagEM CCD camera (Hamamatsu, Bridgewater, New Jersey) was mounted in the right exit port (model IX2 RSPC-2) of the microscope. The left exit port contained a confocal aperture and the avalanche photodiode, as previously described.38 It was used for statistical analysis of the reduction of photobleaching. Excitation light from an expanded diode pumped solid state (DPSS) laser beam (Compass 215M, Coherent, Santa Clara, California) was coupled by the polarization-preserving-fiber to a commercial TIRF attachment (Olympus), which was mounted on the back port of the microscope. The attachment expanded the laser beam, focused it at the back focal plane of the objective, and directed it by the movable optical fiber adapter to the periphery of the objective (Olympus Apo , , or PlanApo , ). Excitation light totally internally reflected at the interface and produced an evanescent wave on the aqueous side of the interface.39 Exciting light was s-polarized (perpendicular to the incidence plane), giving an evanescent field similarly linearly polarized.40 Fluorescence was excited with linearly polarized light parallel or perpendicular to the myofibrillar axis. The sample rested on a moveable piezo stage (Nano-H100, Mad City Labs, Madison, Wisconsin) controlled by a nano-drive. The fluorescent light was collected through the same objective, projected onto a tube lens and to a calcite prism (Melles Griot, Carlsbad, California), which split the fluorescent light into two orthogonally polarized components. The light was focused on the photosensitive area of the camera. The insertion of the calcite prism did alter by a few millimeters the position of the conjugate image plane, but in practice it made a negligible difference to the focus because the high magnification objective (with long back focal distance) was used. The coupling of the DPSS laser to the TIRF module was done through polarization preserving single mode optical fibers. Those fibers have small diameters and are notoriously difficult to couple efficiently with the laser beam. We used a commercial fiber (kineFlex, PointSource, England) mounted into a kinematic adapter (Model KC1, Thor, Newton, New Jersey) to assure high coupling efficiency , i.e., of light was launched into a TIRF module. 2.8.Spatial SamplingThe pixel size of the camera is . For the NA 1.45 objective with 532-nm illumination, the Rayleigh resolution limit is . According to the Nyquist sampling theorem, the ideal spatial sampling rate should have been . However, in our experiments the image was undersampled. The back-projected size of the pixel of the camera is . Therefore, the images are undersampled by a factor of . For the NA 1.65 objective, the back-projected size of the pixel of the camera is , and the images are undersampled by factor of . Undersampling allows the light to be concentrated on fewer pixels. Under the present low-light conditions, this creates a signal that has greater amplitude relative to the background noise, and therefore boosts SNR. 2.9.Choice of Sampling TimeThe whole field ( pixels) is collected at time intervals . The choice of is crucial in SMD. Decreasing increases time resolution but decreases the number of fluorescent photons detected from each half-sarcomere. Increasing improves SNR but decreases time resolution. We took to as a reasonable compromise, because the characteristic time for ATP hydrolysis by glycerinated skeletal myofibrils is .41 The time resolution can be increased by increasing camera gain at the expense of image quality. 2.J.Image AnalysisHCImage software (Hamamatsu) was used. Rectangular ROI was created corresponding to each O-band in a image. The intensity measurement tool was used to measure the mean gray value of all the defined ROIs in all 500 images. ROI was pixels (slightly smaller than a half-sarcomere). These data were saved as tabbed text files. The ASCII file was plotted in SigmaPlot (Systat, San Jose, California). The deconvolution of point spread function (PSF) was done to see if weak uniform fluorescence of unstained myofibrils was due to the spread of fluorescence. The analysis showed that it was not. The MATLAB function deconvblind (MathWorks Incorporated, Natick, Massachusetts) was used. It uses a maximum likelihood algorithm to iteratively optimize the PSF when deconvolving the image. The algorithm maximizes the likelihood that the resulting image, when convolved with the resulting PSF, is an instance of the blurred image, assuming Poisson noise statistics. Deconvolution made images less blurred, but the basic observation, that unstained myofibrils were fluorecsent, was unchanged. 3.Results3.1.Number of Observed MoleculesWe first measured the volume of muscle sarcomere to estimate the number of observed actin molecules. Figure 1 shows AFM images of unlabeled (top) and labeled (bottom) myofibril. The AFM image reports on the resistance to stress encountered by the atomic probe. The images look different, but it is important to emphasize that the difference in AFM image does not suggest that phalloidin induces changes in the sarcomere structure. Because phalloidin binding makes the ends of thin filaments stiffer, this region of a sarcomere is more difficult for an atomic probe to deform. It is known that the pattern of phalloidin labeling changes with time. Initially only the ends of thin filaments are labeled.32 Redistribution of phalloidin to the I-band takes several hours.42 Myofibrils used here were observed 5 to after labeling, so only the ends of thin filaments were labeled. Fig. 1AFM image of a native myofibril on glass coverslip and of a myofibril labeled with UP. The color scale bar indicates distance from coverslip in nanometers.  The average height of 12 phalloidin-labeled myofibrils was . The typical width and length of a sarcomere are 0.8 and , respectively, so the typical volume of a half-sarcomere is . Since the concentration of actin in muscle is ,16 this volume contains on average actin monomers. For “heavily” labeled muscle (see Fig. 2 ), where 1 in molecules are labeled, we have labeled actin molecules per half-sarcomere. For “lightly” labeled muscle (see Fig. 3 ), where 1 in molecules are labeled, we have on average labeled actin molecules per half-sarcomere. For “extremely lightly” labeled muscle (see Fig. 6) where 1 in molecules are labeled, we have on average labeled actin molecules per half-sarcomere. Fig. 2The time course of photobleaching of heavily labeled rigor myofibril. Top panel: myofibril at times indicated below each frame. Exciting light polarized vertically, emitted light polarized horizontally. The bar is . Sarcomere length= . Bottom panel: the time course of photobleaching of the O-band pointed to by the arrow in the top panel (black). The least-square three-parameter exponential fit (yellow) is . The inset is the difference between the signal and the exponential function showing that the exponential is a good fit to the data. Red is the best linear fit to residuals, and green is 95% confidence limit. Myofibril is labeled with UP. Myofibrils are on sapphire, viewed by objective. (Color online only.)  Fig. 3The time course of photobleaching. Top panel: the whole field. Myofibril enclosed in the box was analyzed. The arrow points to the background ROI. Bottom: intensity of fluorescence of the sarcomere, pointed to by an arrow, was measured every . The times at which images were taken after opening the shutter are shown at the bottom left. The bar is . Sarcomere length= . Myofibrils are labeled with UP.  Fig. 6The time course of photobleaching of an O-band pointed to by an arrow in Fig. 5. Signal change (black) suggests a single step. The least square three-parameter exponential fit (yellow) is . Myofibrils were labeled with UP. The background has been subtracted.  3.2.Photobleaching of Heavily Labeled Myofibrils on GlassIf the concentration of the label is high, many actins carry the fluorophores. For heavily labeled myofibrils, we used RP ( nonfluorescent label), i.e., 1 in 100 actin monomers carry fluorescent phalloidin. The number of observed actin molecules is per half-sarcomere. The top panel of Fig. 2 shows the time course of photobleaching of the myofibrils labeled with UP. 500 images were captured every ; but only frames 1, 50, 100, 200, and 300 are shown. The time course of photobleaching of the O-band pointed to by the arrow in the top panel is plotted in the bottom panel of Fig. 2. The three-parameter exponential (yellow) fits the data closely. The half-time is . It is important to point out that we measure polarized intensity of fluorescence. The sample was always illuminated with light polarized vertically relative to the laboratory frame of reference. The microscope field of view is split into two orthogonally polarized parts by the calcite prism inserted before the camera (see Sec. 2). This causes the camera to see two images simultaneously, obtained with the analyzer oriented horizontally and vertically. The myofibril shown in Fig. 2 was viewed with the analyzer oriented horizontally. 3.3.Photobleaching of Lightly Labeled Myofibrils on GlassIn contrast to smooth photobleaching of the heavily labeled O-bands, sarcomeres of lightly labeled myofibrils bleached in step-wise fashion. The example is shown in Fig. 3. For myofibrils labeled with UP and using the value of actin monomers per half-sarcomere, we estimate that it contains molecules of phalloidin. Figure 3 shows images that were captured every . The time course of photobleaching of the O-band pointed to by the arrow in the bottom panel of Fig. 3 after subtracting the background is plotted in Fig. 4 . It suggests the presence of two discrete steps. Most of the O-bands in the top panel of Fig. 3 also bleached in step-wise fashion. However, not all of the steps were as clearly defined. We estimate that only of 480 spots analyzed in 12 separate experiments in which sarcomeres were not uniformly labeled bleached in a clearly defined step-wise fashion. The pattern of photobleaching varied from O-band to O-band. Even the O-bands immediately adjoining each other gave different patterns. For example, the O-band immediately to the right of the one pointed to by an arrow in Fig. 3 suggested that bleaching occurred in four steps. The fact that not all sarcomeres bleached in a step-wise fashion is perhaps due to the fact that some sarcomeres we selected for analysis were not containing fluorophores at all, but were fluorescent due to waveguide effect. Fig. 4(a) The time course of photobleaching of the O-band pointed to by the arrow in the bottom panel of Fig. 3, suggesting the presence of discrete steps. Other O-bands in this frame also bleached in a step-wise fashion. Signal change suggests two steps. Note that the vertical scale is the intensity after subtracting background. The inset shows the time course of photobleaching of an O-band labeled with RP. (b) shows the time course of photobleaching of the background pointed to by the arrow in the top panel of Fig. 3. The least square three-parameter exponential fit (yellow) is . (Color online only.)  The time course of the bleaching of the background from the same sized ROI used to collect data from the O-band (pointed to by an arrowhead in the top panel of Fig. 3) is plotted as an inset to Fig. 4. It displays fluorescence equal to of the signal (recall that the signal is plotted after subtracting the background). However, the inset shows that the bleaching occurs smoothly. The residuals of the least-squares fit to the three-parameter exponential decay function (data not shown) suggested that the exponential is a good fit to the data. This bleaching is most likely due to residual fluorophores remaining stuck to the glass after washing. The rest of the background is due to the autofluorescence of glass. It does not photobleach at all. 3.4.Photobleaching of Extremely Lightly Labeled Myofibrils on GlassTo image a half-sarcomere containing on average less than one fluorescent actin per half-sarcomere, we used UP. For an estimated number of actin molecules in a half-sarcomere of , this gives molecules of phalloidin actin in a ROI. Figure 5 shows the time course of photobleaching of the myofibrils irrigated with UP. The time course of photobleaching of the O-band pointed to by the arrow in Fig. 5 is plotted in Fig. 6 . It suggests the presence of a single discrete step. 3.5.Photobleaching of Heavily and Lightly Labeled Myofibrils on the Nanoparticle MonolayerFigure 7 (top panel) shows the representative examples of images of myofibrils on glass. The images are of good quality, as evidenced by the fact that the Z-bands (pointed to by the arrowheads) and the H-zones (pointed to by the arrows) are well resolved. The bottom panel of Fig. 7 shows representative examples of myofibrils on the NML. The comparison with images on glass shows that image quality remains equally good, as evidenced by the resolution of the Z-bands (arrowheads) and the H-zones (arrows). The intensity is larger in the bottom panels than in the top because colloids increase brightness an average of ten times. This is not reflected in brightness of images because camera gain was adjusted automatically. We did not observe any photobleaching within . The same was true for lightly labeled myofibrils ( UP). Fig. 7Representative images of myofibrils on glass (top panels) and on NML (bottom panels). Arrowheads point to the Z-lines and arrows point to the H-zones. Myofibrils are labeled with rhodamine phalloidin unlabeled phalloidin. Bar is . TIRF excitation. The fact that myofibrils are on average 10 times brighter on NML than on glass is not well illustrated in this figure, because the gain of the camera adjusted itself automatically.  3.6.Photobleaching of Extremely Lightly Labeled Myofibrils on the Nanoparticle MonolayersNanoparticle monolayers reduced photobleaching principally through the reduction of fluorescent lifetime (see Discussion Sec. 4). The top panel of Fig. 8 shows the image of a myofibril labeled with UP on NML. It is important to point out that NML signal from myofibril was enhanced approximately ten times in comparison with signal on glass (see next). The increase of brightness reduced photodamage because it allowed illumination with a weaker laser light. The bottom panel compares signal from a sarcomere containing fluorophore (red) with a signal from the background (black). The transient is caused by “blinking” of silver particles on glass. Metallic silver nanoparticles display curious “blinking,” even in the absence of the fluorophores.43, 44 Fortunately, blinking is rare. In one half-sarcomere, we have detected on average only three to four events during . Fig. 8The time course of photobleaching of myofibrils labeled with UP. The intensity of fluorescence of the sarcomere pointed to by an arrow in the top panel was measured every . The horizontal scale is the times at which images were taken after opening the shutter. Note that NML increased the brightness ten fold. The data were taken through 1 OD filter. (Color online only.) 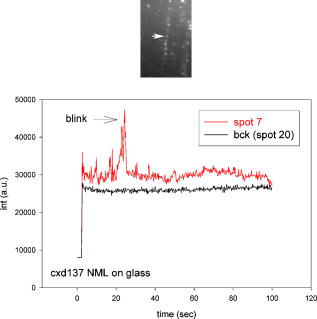 3.7.Rate of PhotobleachingTo obtain an average reduction of photobleaching, we measured signal by avalanche photodiode. We used , objective and confocal aperture. This makes the depth of the detection volume (equal to the depth of the evanescent wave) . The dimension of the detection volume is equal to the diameter of the confocal aperture divided by the magnification of the objective. With an aperture and objective, it is smaller than the diffraction limit of the objective i.e., the diameter of the volume is ,45 giving the detection volume of . Actin concentration in muscle implies that there are actin protomers in this volume. The ratio of fluorescent phalloidin to nonfluorescent phalloidin was fixed at 1:1000, suggesting that the signal was contributed by approximately seven to eight actin molecules. Figure 9a shows that the NML enhanced intensity of fluorescence ten fold in comparison with glass. Figure 9b compares the rate of photobleaching of the myofibrillar overlap zone on glass (green) and NML (red). NML signal from myofibril was enhanced ten times in comparison with signal on glass, so signal on NML was divided by this factor to make intensities at time 0 the same. The half-time of decay on glass and on large colloids was increased approximately four times, but in 12 experiments this time increased on average from to (approximately four to five times). Fig. 9(a) Comparison of spectra of myofibrils labeled with fluorescein-phalloidin on a glass coverslip coated with monolayers containing colloids (circles). The spectra were measured at a angle in a Varian Eclipse spectrofluorometer. Excitation wavelength was . The spectrum of glass alone is shown as triangles. The spectrum of a colloid monolayer in the absence of muscle was comparable to glass alone. (b) Comparison of the rate of photobleaching of the myofibrillar overlap zone on glass and NML. The overlap zone of a myofibril was viewed through a back-projected confocal aperture. Gray—myofibrils on glass. Decay of fluorescence is best fitted by three-parameter exponential fit (black curve). Black—myofibrils on NML. Decay of fluorescence is best fitted by three-parameter exponential fit (black curve). Intensity is measured in counts-per- bin. Colloid enhanced the signal times, so the signal on MNL was divided by this factor to make intensities at time 0 the same. Myofibrils were labeled with rhodamine-phalloidin unlabeled phalloidin. TIRF illumination, sarcomere viewed through an aperture. objective. 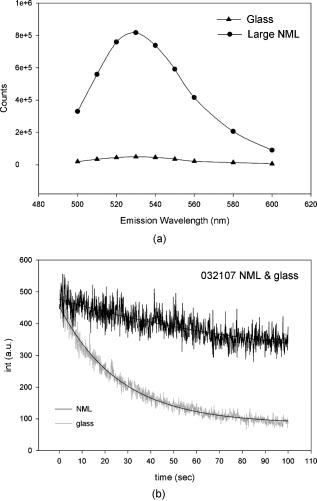 3.8.Decrease of Fluorescent LifetimeFigure 10 shows that the enhancement of intensity and decrease of photobleaching is indeed due to decrease of lifetime. NML augmented the fast decay of fluorescein-labeled myofibrils (arrow). The fluorescence decay (black) after a laser flash (gray) is best fitted (black) by the two exponentials with lifetimes and , with the relative contributions to the total amplitude of 48.5 and 51.5%, respectively. The average amplitude weighted lifetime was . The arrows point to the fast decay of fluorescence. NML significantly decreased the lifetime signal. It is now best fitted (white) by three exponentials with lifetimes , , and with the relative contributions to the total amplitude of 2.0, 1.8, and 96.2%, respectively. The average amplitude weighted lifetime was . The arrows point to the fast decay of fluorescence. The average decrease of lifetime was 17 times, but it is worth pointing out that, whereas there was no ultrafast component of decay of myofibrils on glass, such a component constituted 96% of a signal on NML. Fig. 10Decrease of fluorescent lifetime by NML. (a) Lifetime signal from myofibrils on glass (black). The signal is best fitted (white line) by the two exponentials with lifetimes and , with the relative contributions to the total amplitude of 48.5 and 51.5%. The average amplitude weighted lifetime was . The arrow points to the fast decay of fluorescence. The gray signal is the exciting pulse from the diode laser. The bottom inset is the residual fit to all 9567 data points. (b) Lifetime signal from myofibrils on glass coated with a SIF monolayer (black) is best fitted (white line) by three exponentials with lifetimes , , and , with the relative contributions to the total amplitude of 2.0, 1.8, and 96.2%, respectively. The average amplitude weighted lifetime was . The arrow points to the fast decay of fluorescence. The gray signal is the exciting pulse. The bottom inset is the residual fit to all 5308 data points. myofibrils were labeled with rhodamine-phalloidin.  4.DiscussionBy observing muscle on glass with sensitive EMCCD, it was possible, for the first time, to visualize single actin molecules in muscle. Discrete photobleaching observed on glass is a useful indicator of a single molecule regime, but it is an obstacle when making kinetic measurements, because photobleaching steps obscure intensity fluctuations due to molecular motions. For example, in muscle, intensity fluctuates because of rotations of myosin molecules. Changes of intensity due to photobleaching are superimposed on rotational signals, making rotations impossible to detect. By observing muscle on nanoparticle monolayers, it was possible to image single molecules for at least 100 sec without photobleaching them. Observing single molecules in muscle is particularly important, because the molecules that are responsible for contraction, myosin cross-bridges, act asynchronously. Probing single molecules avoids the averaging inherent in studying large assemblies of molecules. Further, observing single molecules in situ avoids possible alteration of cross-bridge kinetics by the regular arrangement of actin and myosin in arrays of filaments, by molecular crowding and the dependence of kinetic rates on position within a sarcomere. Even though it is possible to avoid asynchrony by applying transients in length or ATP concentration and thus forcing thousands of cross-bridges to act as one,46, 47 there are differences between isometric and transient experiments. In the isometric case, cross-bridges act against steady maximum force, whereas during transients they act initially, acting against no load. The presence of nanoparticles has three effects. 1. In a close proximity, below , there is a strong quenching of fluorescence. The excitation energy is being damped to the metal in a nonradiative way. This does not affect fluorescence from myofibrils, because they rise at least above the surface of the nanoparticles.3 2. An electric field of excitation light is significantly altered near nanoparticles. Locally, this field can be very strong. The fluorophores in this region are exposed to a strong excitation, which results in an increased brightness. The enhanced local field is responsible also for surface-enhanced Raman scattering (SERS). 3. The interaction of excited molecules with metallic nanoparticles results in a rapid emission of a photon to the far field. This effect (known also as a radiative decay engineering) increases a radiative rate of fluorophore deactivation.48 In this case, the quantum efficiency increases, and the lifetime decreases. Decrease of lifetime is sufficient proof that the radiative rate is increased. Indeed, in conventional fluorescence, the changes in quantum efficiency always occur by modulation of the nonradiative rate constant , be it by solvent relaxation, nonradiative decay, quenching by the solvent, or transfer of the energy to an acceptor. The radiative rate constant remains constant. Thus a decrease in always causes an increase of fluorescence lifetime, . In contrast, the proximity of fluorophores to metallic particles provides an opportunity to modify radiative rate . For example, suppose the metallic particles result in a -fold increase in the radiative decay rate to . The lifetime becomes shorter. Our experiments confirmed that lifetime indeed decreased (Fig. 10). Increase in causes fluorescence to become brighter, because quantum yield now becomes , i.e., it becomes closer to the maximum value of 1. (In our case, is near 1 anyway (because we are using rhodamine); this increase is not very significant.) However, the main beneficial effect is a decrease of lifetime. This causes significant decrease of bleaching, because the fluorophore spends less time in the excited state, and leads to a more effective excitation rate, because fluorophores are more often excited. To strengthen the conclusion that the step-wise decrease in signal results from photobleaching of a single molecule of phalloidin, we need to estimate the number of fluorescent photons given off by one rhodamine molecule before bleaching. To do so, we need to convert the gray values of EMCCD to the number of photons. We took advantage of our ability to direct the signal either to the EMCCD camera or to the avalanche photodiode (see Materials and Methods in Sec. 2). For the data shown as inset in Fig. 4, we determined that the number of photons corresponding to the signal at time 0 was . The corresponding gray level of the camera was . From the figure, we estimate that the change of gray level associated with one step is 2000, i.e., we get photons/step. A step lasted , i.e., we observed photons from a fluorophore before it photobleached. (The duration of the first step is underestimated, because it takes a few seconds to focus the image. During this time, photobleaching is already in progress.) The geometrical collection efficiency of the instrument is 38 thus a fluorophore emitted a total of photons before irreversible bleaching. This is consistent with the known photostability of rhodamine.49 5.ConclusionsOn a glass substrate, molecules photobleach rapidly. If many molecules are observed, photobleaching is smooth (Fig. 2). If a few molecules (Fig. 4) or one molecule (Fig. 6) is observed, photobleaching is step-wise, reflecting individual bleaching events. Nanoparticle monolayers, in contrast to multilayers, do not decrease the quality of images of myofibrils (Fig. 7). Monolayers increase the brightness [Fig. 9a], thus reducing photodamage because it allows illumination with weaker laser light. The significant decrease of photobleaching [Figs. 8 and 9b] is caused by a reduction of fluorescent lifetime (Fig. 10). Reduction of photobleaching and photodamage makes single molecule detection in tissue less problematic than detection on glass. ReferencesE. Betzig,
R. J. Chichester,
F. Lanni, and
D. L. Taylor,
“Near field fluorescence imaging of cytoskeletal actin,”
Bioimaging, 1 129
–133
(1993). https://doi.org/10.1002/1361-6374(199309)1:3<129::AID-BIO1>3.0.CO;2-8 0966-9051 Google Scholar
E. Betzig,
G. H. Patterson,
R. Sougrat,
O. W. Lindwasser,
S. Olenych,
J. S. Bonifacino,
M. W. Davidson,
J. Lippincott-Schwartz, and
H. F. Hess,
“Imaging intracellular fluorescent proteins at nanometer resolution,”
Science, 313
(5793), 1642
–1645
(2006). https://doi.org/10.1126/science.1127344 0036-8075 Google Scholar
P. Muthu,
I. Gryczynski,
Z. Gryczynski,
J. Talent,
I. Akopova,
K. Jain, and
J. Borejdo,
“Decreasing photobleaching by silver island films: application to muscle,”
Anal. Biochem., 366
(2), 228
–236
(2007). 0003-2697 Google Scholar
D. A. Weitz,
S. Garoff,
C. D. Anson, and
T. J. Gramila,
“Fluorescent lifetimes of molecules on silver-island films,”
Opt. Lett., 7 89
–91
(1982). 0146-9592 Google Scholar
A. Leitner,
M. E. Lippitch,
S. Draxler,
M. Riegler, and
F. R. Aussenegg,
“Fluorescence properties of dyes absorbed to silver islands, investigated by picosecond techniques,”
Appl. Phys. B, 36 105
–109
(1985). https://doi.org/10.1007/BF00694696 0721-7269 Google Scholar
I. Gryczynski,
J. Malicka,
Y. Shen,
Z. Gryczynski, and
J. R. Lakowicz,
“Multiphoton excitation of fluorescence near metallic particles: Enhanced and localized excitation,”
J. Phys. Chem. B, 106 2191
–2195
(2002). https://doi.org/10.1021/jp013013n 1089-5647 Google Scholar
B. P. Maliwal,
J. Malicka,
I. Gryczynski,
Z. Gryczynski, and
J. R. Lakowicz,
“Fluorescence properties of labeled proteins near silver colloid surfaces,”
Biopolymers, 70
(4), 585
–594
(2003). https://doi.org/10.1002/bip.10501 0006-3525 Google Scholar
C. D. Geddes,
H. Cao,
I. Gryczynski,
Z. Gryczynski, and
J. R. Lakowicz,
“Metal-enhanced fluorescence (MEF) due to silver colloid on a planar surface: Potential applications of indocyanine green to in vivo imaging,”
J. Phys. Chem. A, 107 3443
–3449
(2003). https://doi.org/10.1021/jp022040q 1089-5639 Google Scholar
J. Malicka,
I. Gryczynski, and
J. R. Lakowicz,
“DNA hybridization assays using metal-enhanced fluorescence,”
Biochem. Biophys. Res. Commun., 306
(1), 213
–218
(2003). https://doi.org/10.1016/S0006-291X(03)00935-5 0006-291X Google Scholar
J. Malicka,
I. Gryczynski,
J. Fang, and
J. R. Lakowicz,
“Photostability of Cy3 and Cy5-labeled DNA in the presence of metallic silver particles,”
J. Fluoresc., 12 439
–447
(2002). https://doi.org/10.1023/A:1021370111590 1053-0509 Google Scholar
“Spectroscopy of gap modes in metal particle-surface systems,”
Topics in Applied Physics, Near Field Optics and Surface Plasmon Polaritons, 71
–95 Springer-Verlag, Berlin (2001). Google Scholar
J. R. Lakowicz,
Y. Shen,
S. D’Auria,
J. Malicka,
J. Fang,
Z. Gryczynski, and
I. Gryczynski,
“Radiative decay engineering 2. Effects of silver island films on fluorescence intensity, lifetimes, and resonance energy transfer,”
Anal. Biochem., 301 261
–277
(2002). https://doi.org/10.1006/abio.2001.5503 0003-2697 Google Scholar
P. Muthu,
I. Gryczynski,
Z. Gryczynski,
J. M. Talent,
I. Akopova, and
J. Borejdo,
“Decreasing photobleaching by silver nanoparticles on metal surfaces: application to muscle myofibrils,”
J. Biomed. Opt., 13 014033
(2008). https://doi.org/10.1117/1.2854120 1083-3668 Google Scholar
A. M. Gordon,
A. F. Huxley, and
F. J. Julian,
“The variation in isometric tension with sarcomere length in vertebrate muscle fibres,”
J. Physiol. (London), 184
(1), 170
–192
(1966). 0022-3751 Google Scholar
A. M. Gordon,
A. F. Huxley, and
F. J. Julian,
“Tension development in highly stretched vertebrate muscle fibres,”
J. Physiol. (London), 184
(1), 143
–169
(1966). 0022-3751 Google Scholar
C. R. Bagshaw, Muscle Contraction, Chapman and Hall, London (1982). Google Scholar
J. N. Forkey,
M. E. Quinlan, and
Y. E. Goldman,
“Measurement of single macromolecule orientation by total internal reflection fluorescence polarization microscopy,”
Biophys. J., 89
(2), 1261
–1271
(2005). https://doi.org/10.1529/biophysj.104.053470 0006-3495 Google Scholar
E. Toprak,
J. Enderlein,
S. Syed,
S. A. McKinney,
R. G. Petschek,
T. Ha,
Y. E. Goldman, and
P. R. Selvin,
“Defocused orientation and position imaging (DOPI) of myosin V,”
Proc. Natl. Acad. Sci. U.S.A., 103
(17), 6495
–6499
(2006). https://doi.org/10.1073/pnas.0507134103 0027-8424 Google Scholar
D. M. Warshaw,
E. Hayes,
D. Gaffney,
A. M. Lauzon,
J. Wu,
G. Kennedy,
K. Trybus,
S. Lowey, and
C. Berger,
“Myosin conformational states determined by single fluorophore polarization,”
Proc. Natl. Acad. Sci. U.S.A., 95
(14), 8034
–8039
(1998). https://doi.org/10.1073/pnas.95.14.8034 0027-8424 Google Scholar
M. E. Quinlan,
J. N. Forkey, and
Y. E. Goldman,
“Orientation of the myosin light chain region by single molecule total internal reflection fluorescence polarization microscopy,”
Biophys. J., 89
(2), 1132
–1142
(2005). 0006-3495 Google Scholar
J. N. Forkey,
M. E. Quinlan,
M. A. Shaw,
J. E. Corrie, and
Y. E. Goldman,
“Three-dimensional structural dynamics of myosin V by single-molecule fluorescence polarization,”
Nature (London), 422
(6930), 399
–404
(2003). https://doi.org/10.1038/nature01529 0028-0836 Google Scholar
A. Yildiz,
J. N. Forkey,
S. A. McKinney,
T. Ha,
Y. E. Goldman, and
P. R. Selvin,
“Myosin V walks hand-over-hand: single fluorophore imaging with 1.5-nm localization,”
Science, 300
(5628), 2061
–2065
(2003). https://doi.org/10.1126/science.1084398 0036-8075 Google Scholar
H. Park,
B. Ramamurthy,
M. Travaglia,
D. Safer,
L. Q. Chen,
C. Franzini-Armstrong,
P. R. Selvin, and
H. L. Sweeney,
“Full-length myosin VI dimerizes and moves processively along actin filaments upon monomer clustering,”
Mol. Cell, 21
(3), 331
–336
(2006). https://doi.org/10.1016/j.molcel.2005.12.015 1097-2765 Google Scholar
H. Park,
A. Li,
L. Q. Chen,
A. Houdusse,
P. R. Selvin, and
H. L. Sweeney,
“The unique insert at the end of the myosin VI motor is the sole determinant of directionality,”
Proc. Natl. Acad. Sci. U.S.A., 104
(3), 778
–783
(2007). 0027-8424 Google Scholar
M. E. Quinlan,
J. N. Forkey, and
Y. E. Goldman,
“Kinesin-ADP: whole lotta shakin’ goin’ on,”
Nat. Struct. Biol., 8
(6), 478
–480
(2001). 1072-8368 Google Scholar
A. Yildiz and
P. R. Selvin,
“Kinesin: walking, crawling or sliding along?,”
Trends Cell Biol., 15
(2), 112
–120
(2005). https://doi.org/10.1016/j.tcb.2004.12.007 0962-8924 Google Scholar
S. Toba,
T. M. Watanabe,
L. Yamaguchi-Okimoto,
Y. Y. Toyoshima, and
H. Higuchi,
“Overlapping hand-over-hand mechanism of single molecular motility of cytoplasmic dynein,”
Proc. Natl. Acad. Sci. U.S.A., 103
(15), 5741
–5745
(2006). https://doi.org/10.1073/pnas.0508511103 0027-8424 Google Scholar
E. A. Abbondanzieri,
W. J. Greenleaf,
J. W. Shaevitz,
R. Landick, and
S. M. Block,
“Direct observation of base-pair stepping by RNA polymerase,”
Nature (London), 438
(7067), 460
–465
(2005). https://doi.org/10.1038/nature04268 0028-0836 Google Scholar
H. Ueno,
T. Suzuki, K. Kinosita Jr., M. Yoshida,
“ATP-driven stepwise rotation of FoF1-ATP synthase,”
Proc. Natl. Acad. Sci. U.S.A., 102
(5), 1333
–1338
(2005). https://doi.org/10.1073/pnas.0407857102 0027-8424 Google Scholar
Y. Sowa,
A. D. Rowe,
M. C. Leake,
T. Yakushi,
M. Homma,
A. Ishijima, and
R. M. Berry,
“Direct observation of steps in rotation of the bacterial flagellar motor,”
Nature (London), 437
(7060), 916
–919
(2005). https://doi.org/10.1038/nature04003 0028-0836 Google Scholar
T. P. Burghardt,
K. Ajtai,
D. K. Chan,
M. F. Halstead,
J. Li, and
Y. Zheng,
“GFP tagged regulatory light chain monitors single myosin lever-arm orientation in a muscle fiber,”
Biophys. J., 18 18
(2007). 0006-3495 Google Scholar
D. Szczesna and
S. S. Lehrer,
“The binding of fluorescent phallotoxins to actin in myofibrils,”
J. Muscle Res. Cell Motil., 14
(6), 594
–597
(1993). https://doi.org/10.1007/BF00141556 0142-4319 Google Scholar
A. E. Bukatina,
F. Fuchs, and
S. C. Watkins,
“A study on the mechanism of phalloidin-induced tension changes in skinned rabbit psoas muscle fibres,”
J. Muscle Res. Cell Motil., 17
(3), 365
–371
(1996). https://doi.org/10.1007/BF00240934 0142-4319 Google Scholar
E. Prochniewicz-Nakayama,
T. Yanagida, and
F. Oosawa,
“Studies on conformation of F-actin in muscle fibers in the relaxed state, rigor, and during contraction using fluorescent phalloidin,”
J. Cell Biol., 97 1663
–1667
(1983). https://doi.org/10.1083/jcb.97.6.1663 0021-9525 Google Scholar
K. Garsha,
“Spectral methods for biological analysis,”
Photonics Spectra, 41
(8), 53
–58
(2007). 0731-1230 Google Scholar
J. Borejdo,
O. Assulin,
T. Ando, and
S. Putnam,
“Cross-bridge orientation in skeletal muscle measured by linear dichroism of an extrinsic chromophore,”
J. Mol. Biol., 158 391
–414
(1982). https://doi.org/10.1016/0022-2836(82)90205-4 0022-2836 Google Scholar
J. Borejdo,
J. Talent,
I. Akopova, and
T. P. Burghardt,
“Rotations of a few cross-bridges in muscle by confocal total internal reflection microscopy,”
Biochim. Biophys. Acta, 1763 137
–140
(2006). 0006-3002 Google Scholar
J. Borejdo,
P. Muthu,
J. Talent,
I. Akopova, and
T. P. Burghardt,
“Rotation of actin monomers during isometric contraction of skeletal muscle,”
J. Biomed. Opt., 12 014013
(2007). https://doi.org/10.1117/1.2697286 1083-3668 Google Scholar
D. Axelrod,
“Total internal reflection fluorescence microscopy,”
Methods Cell Biol., 30 245
–270
(1989). 0091-679X Google Scholar
T. P. Burghardt and
N. L. Thompson,
“Effect of planar dielectric interfaces on fluorescence emission and detection. Evanescent excitation with high-aperture collection,”
Biophys. J., 46 729
–737
(1984). 0006-3495 Google Scholar
E. J. Potma,
I. A. van Graas, and
G. J. Stienen,
“Effects of pH on myofibrillar ATPase activity in fast and slow skeletal muscle fibers of the rabbit,”
Biophys. J., 67
(6), 2404
–2410
(1994). 0006-3495 Google Scholar
X. Ao and
S. S. Lehrer,
“Phalloidin unzips nebulin from thin filaments in skeletal myofibrils,”
J. Cell. Sci., 108
(Pt. 11), 3397
–3403
(1995). 0021-9533 Google Scholar
L. A. Peyser,
A. E. Vinson,
A. P. Bartko, and
R. M. Dickson,
“Photoactivated fluorescence from individual silver nanoclusters,”
Science, 291
(5501), 103
–106
(2001). https://doi.org/10.1126/science.291.5501.103 0036-8075 Google Scholar
C. D. Geddes,
A. Parfenov,
I. Gryczynski, and
J. R. Lakowicz,
“Luminescent blinking from silver nanostructures,”
J. Phys. Chem., 107 9989
–9993
(2003). 0022-3654 Google Scholar
J. Borejdo,
Z. Gryczynski,
N. Calander,
P. Muthu, and
I. Gryczynski,
“Application of surface plasmon coupled emission to study of muscle,”
Biophys. J., 91 2626
–2635
(2006). https://doi.org/10.1529/biophysj.106.088369 0006-3495 Google Scholar
S. C. Hopkins,
C. Sabido-David,
J. E. Corrie,
M. Irving, and
Y. E. Goldman,
“Fluorescence polarization transients from rhodamine isomers on the myosin regulatory light chain in skeletal muscle fibers,”
Biophys. J., 74
(6), 3093
–3110
(1998). 0006-3495 Google Scholar
J. Borejdo,
A. Shepard,
D. Dumka,
I. Akopova,
J. Talent,
A. Malka, and
T. P. Burghardt,
“Changes in orientation of actin during contraction of muscle,”
Biophys. J., 86 2308
–2317
(2004). 0006-3495 Google Scholar
J. R. Lakowicz,
J. Malicka,
I. Gryczynski,
Z. Gryczynski, and
C. Geddes,
“Radiative decay engineering: the role of photonic mode density in biotechnology,”
J. Phys. D, 36 R240
–R249
(2003). https://doi.org/10.1088/0022-3727/36/14/203 0022-3727 Google Scholar
C. Eggeling,
J. Widengren,
R. Rigler, and
C. A. M. Seidel,
“Photobleaching of fluorescent dyes under conditions used for single-molecule detection: evidence of two-step photolysis,”
Anal. Chem., 70 2651
–2659
(1998). https://doi.org/10.1021/ac980027p 0003-2700 Google Scholar
|