
|
|
|
Previous studies suggest that retinal haemodynamics play an important role in glaucoma,1 diabetic retinopathy,2 and age-related macular degeneration.3 Therefore, it is desirable to assess retinal blood flow in vivo in order to investigate their role in major eye diseases. Although many flow measurement technologies have been developed, they do not provide adequate information for understanding the relationship between retinal blood flow and important ocular diseases.4 Doppler optical coherence tomography 5, 6, 7, 8, 9, 10, 11 (DOCT), a variation of optical coherence tomography (OCT) that combines coherence gating and laser Doppler effects, is an alternative that can overcome some limitations of the technologies mentioned above.4 Because of the unknown Doppler angle between the blood flow and incident light beam and the absence of a quantification method that can generate interpretable results for clinicians, DOCT is not widely used in eye clinics. Conventional DOCT only generates a snapshot of pulsatile ocular blood flow that is projected along the light beam direction in a cardiac cycle. Most recent developments in quantifying blood flow information of the human eye utilizes 3-D vascular orientation information to estimate Doppler angle and the absolute flow velocity.10, 11 On the other hand, it is noteworthy to quantify the pulsatile flow pattern as an alternative method to investigate retinal flow dynamics. A simple projected ocular blood flow velocity (integration over the whole blood vessel) plot through a cardiac cycle was chosen by White9 to demonstrate the pulsatile flow property, although it is possible to acquire much more hemodynamics information from the same raw data. The M-mode scanning method has been used to acquire temporal flow information in time-domain DOCT systems.12, 13 The short-time fast Fourier transformation method from Doppler ultrasound14 was used to generate Doppler spectrum wave forms13 but without further quantification, which provides the most valuable information for clinicians. The purpose of this paper is to implement the full concept of spectral Doppler imaging, developed by scientists and clinicians in ultrasound medicine, in a Fourier-domain DOCT system and provide an alternative quantification method for an ocular blood flow pattern that may be further investigated for vascular related eye diseases. “Spectral Doppler”14 is a terminology from Doppler ultrasound and should not be related to spectral OCT that uses spectral information as a contrast mechanism of OCT. Spectral Doppler imaging of pulsatile retinal blood flow includes Doppler spectrum visualization, using spectral Doppler wave forms, and a method for quantifying the temporal properties of flow, using various velocity envelopes and their corresponding Doppler-angle-independent indices.14 Continuous color Doppler data are acquired when the light beam performs repeated dense scans over the region of interest. Spectral Doppler analysis on the data shows how the velocity components and longitudinally projected flow-volume-rate change over time for scatters within the imaging volume with spectral Doppler wave forms. Various velocity envelope curves can be derived from spectral Doppler wave forms and used to extract the corresponding pulsatility index (PI), resistance index (RI) and several other indices that can provide interpretable Doppler-angle-independent information needed to quantify the pulsatile nature of ocular blood flow. A Fourier domain functional OCT system was developed for retinal blood flow imaging.8, 9 Briefly, low coherence light with a center wavelength of and FWHM bandwidth of was protected from optical feedback using a broadband optical isolator before entering a broadband fiber coupler-based interferometer. The light from the reference arm was focused onto a reference mirror with an optical attenuator inserted into the optical path. The sample arm was modified from the patient module of a Zeiss Stratus OCT instrument. The detection arm was connected to a high-performance spectrometer that allows the system bench-top sensitivity of with light out of the sample arm fiber and CCD integration. A of SNR roll-off from zero imaging depth to imaging depth was observed. The system has an axial resolution of . In this study, the system speed was set at A-lines/s with its CCD A-line integration time set at and the line period set at . The maximum longitudinal velocity in retinal tissue that corresponded to a phase difference of was determined to be according to , where is the line period of the CCD camera. The measured phase noise from a mirror was .9 The velocity measurement error was determined to be by imaging steady-state scattering flow (polystyrene bead solution with mean diameter of and volume concentration of 0.26%) pumped at different velocities. An improved phase-resolved algorithm that uses a Doppler variance image15 to select tissue pixels for histogram analysis16 of bulk phase was developed in this instrument to compensate for the axial eye movement. Most bulk motion presented in Fig. 1a has been corrected by the conventional histogram algorithm in Fig. 1b. Additional motion artifacts resulting from bulk motion phase estimation error by normal histogram algorithm shown in Fig. 1c were corrected in Fig. 1d by the improved phase-resolved algorithm that eliminates the assumption that the vessel has to be small compared to the tissues in the same A-line.16 Fig. 1(a) Doppler image without bulk phase correction, (b) Doppler image with bulk phase correction by the conventional histogram method, (c) enlarged Doppler image of a selected area within the red window in (b), (d) doppler image generated by the improved phase-resolved algorithm with more reduced artifacts than normal histogram method in (c), (e) Spectral Doppler scan trace shown on OCT fundus image ( A-lines), (f) the intensity and color Doppler image for one snapshot , (g) spectral Doppler wave forms that show the change of (axial) velocity and flow-volume-rate within a time span of (the right grayscale bar is used to represent the volume-rate contribution for a given velocity bin) and (h) the maximum velocity envelope curve of eight cardiac cycles from which the quantitative Doppler-angle-independent flow indices were calculated. 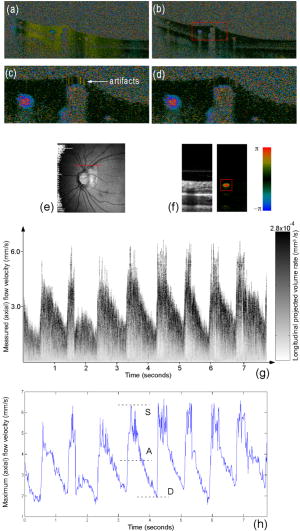 For the scan protocol of spectral Doppler imaging, repeated color Doppler scans over the broken region of the red line shown in Fig. 1e for a short period of time were performed after a specific vessel was selected from the OCT fundus17 image generated from a 3-D scan immediately before spectral Doppler imaging. Spectral Doppler analysis was performed on the color Doppler images. In order to evaluate variation of measurements within one session, spectral Doppler imaging of 512 snapshots through eight cardiac cycles in was performed on one normal subject after the vessel was selected as shown in Fig. 1e. Each snapshot used 256 A-lines on tissue. The imaging speed of 65 snapshots per second is fast enough to capture the dynamic flow during a cardiac cycle. The structure image and velocity image for a typical snapshot are shown in Fig. 1f. The longitudinal velocity sensitivity was by fitting the velocity profile and calculating the standard deviation for the velocity image across the center of the vessel8 in Fig. 1f. Before spectral Doppler analysis, a threshold was applied to the Doppler phase image and then some morphological operations were performed to get a vessel mask. The vessel center could then be easily determined from the peak positions after projecting the vessel mask to horizontal and vertical directions. A rectangular window centered at the estimated vessel center position can be applied to the velocity image in Fig. 1f. Next, the spectral Doppler wave forms in Fig. 1g could be generated after spectral Doppler analysis was performed for every velocity image snapshot that corresponded to one vertical line of the spectral Doppler wave forms. The velocity range was digitized into 256 velocity bins . An iteration of all the pixels within the window generates a function that represents the number of pixels having velocity of . Because each pixel represents a vortex for the vessel lumen area, the product of the velocity of the velocity bin and the number of pixels that fall within the velocity bin produced gray scale amplitude, which is proportional to the longitudinal projection of the flow-volume-rate contributed by each velocity bin. The summation of the gray scale amplitude along the -axis gives the total longitudinal projection of flow-volume-rate of a vessel at a given time point. The summation of the gray scale amplitude along the - and -axes for one cardiac cycle provides the longitudinal projection of total flow volume within that cardiac cycle. Note that spectral Doppler wave forms with other gray scale intensity definitions can be defined according to other physical meanings, such as particle numbers or particle energies. Different color channels may be introduced to represent multiple flow-related parameters in a color-coded plot of spectral Doppler wave forms. In order to obtain more quantitative, interpretable results, different Doppler velocity envelopes, such as maximum velocity envelope, mean velocity envelope, and flow-volume-rate envelope, can be derived from the spectral Doppler wave forms accordingly. Figure 1h shows an example of the maximum velocity envelope derived from the spectral Doppler wave forms in Fig. 1g. For each cardiac cycle in Fig. 1h, symbol represents the peak systolic maximum velocity, symbol represents the end diastolic maximum velocity and symbol A represents the temporal average of maximum velocity. The PI and RI are defined as follows to characterize the curve and remove the dependence on Doppler angle: Similar Doppler indices, such as the ratio and ratio, can be defined accordingly. Cycle 2 was excluded for statistical calculation due to eye motion. Table 1 summarizes the flow indices measured for other cardiac cycles, their average values, standard deviation values, and coefficients of variance for the maximum velocity envelope curve. The quantitative indices indicated above can be derived accordingly for other envelope curve definitions.Table 1Intrasession coefficient of variation of Doppler flow indices for one measurement.
The intersession repeatability18 of RI measurement was assessed from multiple pairs of measurements. One measurement pair was defined as two separate measurements on the same vessel site. We measured two retinal vessels from two normal patients. Each vessel was measured seven times in the same day. There were independent measurement pairs out of seven repeated measurements on each vessel. The intersession coefficient of repeatability18 (CoR) of 0.08336 was calculated from the 42 pairs of measurement on two vessels (see Table 2 ) according to the formula: . Table 2Intersession coefficient of repeatability18 for 42 pairs of measurements on two vessels.
In summary, we have developed a functional Fourier domain optical coherence tomography instrument that allows spectral Doppler flow imaging of in vivo human retinal flow. An improved phase-resolved algorithm was developed to correct the bulk motion artifacts. The COR was assessed for RI measurements using 14 measurements of two vessels within two normal subjects. This method provides an alternative way to quantify retinal blood flow with Doppler-angle-independent flow indices that may provide insight on the retinal flow in many vascular related eye diseases. AcknowledgmentThis work is supported by the National Institutes of Health (Grant No. EB-00293, No. NCI-91717, No. RR-01192), and the Air Force Office of Science Research (Grant No. FA9550-04-1-0101). Institutional support from the Beckman Laser Institute and Medical Clinic is also gratefully acknowledged. ReferencesG. Fuchsjager-Mayrl,
“Ocular blood flow and systemic blood pressure in patients with primary open-Angle glaucoma and ocular hypertension,”
Invest. Ophthalmol. Visual Sci., 45
(3), 834
–839
(2004). https://doi.org/10.1167/iovs.03-0461 0146-0404 Google Scholar
V. Patel,
“Retinal blood flow in diabetic retinopathy,”
Br. Med. J., 305 678
–683
(1992). 0007-1447 Google Scholar
E. Sato,
“Retinal haemodynamics in patients with age-related macular degeneration,”
Eye, 20 697
–702
(2006). 0950-222X Google Scholar
J. Flammer,
“The impact of ocular blood flow in Glaucoma,”
Prog. Retin Eye Res., 21 359
–393
(2002). 1350-9462 Google Scholar
Z. Chen,
“Noninvasive imaging of in vivo blood flow velocity using optical Doppler tomography,”
Opt. Lett., 22 1119
–1121
(1997). https://doi.org/10.1023/A:1027365202328 0146-9592 Google Scholar
J. A. Izatt,
“In vivo bidirectional color Doppler flow imaging of picoliter blood volumes using optical coherence tomography,”
Opt. Lett., 22 1439
–1441
(1997). https://doi.org/10.1364/OL.22.001439 0146-9592 Google Scholar
S. Yazdanfar,
“Imaging and velocimetry of the human retinal circulation with color Doppler optical coherence tomography,”
Opt. Lett., 25 1448
–1450
(2000). 0146-9592 Google Scholar
R. Leitgeb,
“Real-time assessment of retinal blood flow with ultrafast acquisition by color Doppler Fourier domain optical coherence tomography,”
Opt. Express, 11 3116
–3121
(2003). 1094-4087 Google Scholar
B. White,
“In vivo dynamic human retinal blood flow imaging using ultra-high-speed spectral domain optical coherence tomography,”
Opt. Express, 11 3490
–3497
(2003). 1094-4087 Google Scholar
Y. Wang,
“In vivo total retinal blood flow measurement by Fourier domain Doppler optical coherence tomography,”
J. Biomed. Opt., 12
(4), 041215
(2007). https://doi.org/10.1117/1.2772871 1083-3668 Google Scholar
H. Wehbe,
“Automatic retinal blood flow calculation using spectral domain optical coherence tomography,”
Opt. Express, 15 15193
–15206
(2007). 1094-4087 Google Scholar
H. Ren,
“Power optical Doppler tomography imaging of blood vessel in human skin and M-mode Doppler imaging of blood flow in chick chrioallantoic membrane,”
Proc. SPIE, 4956 225
–231
(2003). 0277-786X Google Scholar
V. Yang,
“High speed, wide velocity dynamic range Doppler optical coherence tomography (Part I): System design, signal processing, and performance,”
Opt. Express, 11 794
–809
(2003). 1094-4087 Google Scholar
D. Maulik, Doppler Ultrasound in Obstetrics and Gynecology, Springer-Verlag, New York
(2005). Google Scholar
Y. Zhao,
“Doppler standard deviation imaging for clinical monitoring of in vivo human skin blood flow,”
Opt. Lett., 25 1358
–1360
(2000). https://doi.org/10.1364/OL.25.001358 0146-9592 Google Scholar
S. Makita,
“Optical coherence angiography,”
Opt. Express, 14 7821
–7840
(2006). https://doi.org/10.1364/OE.14.007821 1094-4087 Google Scholar
S. Jiao,
“Registration of high-density cross sectional images to the fundus image in spectral-domain ophthalmic optical coherence tomography,”
Opt. Express, 14 3368
–3376
(2006). https://doi.org/10.1364/OE.14.003368 1094-4087 Google Scholar
J. M. Bland and
D. G. Altman,
“Statistical methods for assessing agreement between two methods of clinical measurement,”
Lancet, 1 307
–310
(1986). https://doi.org/10.1016/S0140-6736(86)90837-8 0140-6736 Google Scholar
|
|||||||||||||||||||||||||||||||||||||||||||||||||||||||||||||||||||||||||||||||||||||||


