|
|
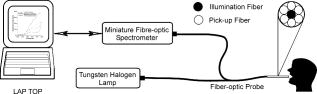
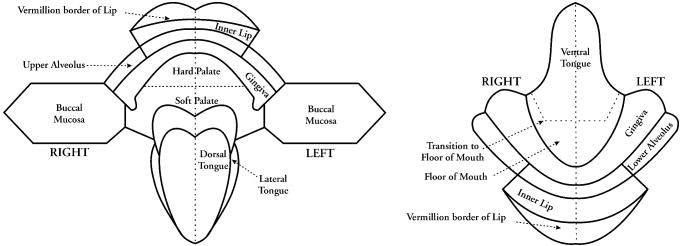
1.IntroductionEarly detection of precancer (premalignancy) is of great clinical significance in the management and treatment of cancers affecting the oral cavity. Oral premalignant dysplastic lesions often appear as leukoplakia (white patches) and erythroplakia (velvety red patches), believed to be precursors of oral cavity squamous cell carcinoma (SCC). 1, 2, 3, 4 Visual examination by an experienced clinician followed by biopsy and cytology is the current accepted practice for detection of oral cancer or its precursors. However, visual inspection does not permit identification of microscopic epithelial alterations, and it is often a difficult task for even experienced clinicians to determine the most malignant location for biopsy. Premalignancies are characterized by increased nuclear/cytoplasmic ratio, which is assessed by histopathology. An oral lesion that is premalignant at some part may not be malignant at another location. Therefore, biopsy from one location of the lesion cannot be a representative of the entire lesion. Also, the resemblances of tissue inflammation and irritation with premalignant oral mucosal alterations and field cancerous changes are often challenging. This usually leads to random or repeated biopsies to the discomfort of patients. Multiple stage sample preparations and processes are also time consuming and increase pathological costs. On the other hand, most of the existing screening and detection techniques for oral precancers do not provide satisfactory sensitivity and specificity.5 Currently, patients have to wait up to two months for treatment after the standard diagnostic procedure. All these factors necessitate the development of an adjunctive tool to facilitate noninvasive and instantaneous screening of oral precancer. In contrast to prevalent clinical practices, optical spectroscopic techniques provide noninvasive and real-time information free from artifacts that may arise due to cutting, freezing, and staining of the tissue. These optical techniques are sensitive to the biochemical and morphological properties of tissues, such as cellular metabolic rate, vascularity, intravascular oxygenation and alterations in tissue morphology, which helps in precisely locating neoplastic mucosal changes. Laser-induced autofluorescence spectroscopy (LIAFS), Raman spectroscopy (RS), and diffuse reflectance spectroscopy (DRS) are emerging as new-generation techniques in the diagnosis of different types of malignancies.6, 7, 8 Tissue fluorescence with ultraviolet-visible (UV-VIS) excitation can effectively probe multiple biochemical constituents that are present in normal and malignant tissues. The application of RS has been quite useful for characterization of small tissue samples and different cell layers with high sensitivity and specificity, but its application in a clinical environment is still very difficult.9 However, cost effectiveness, simplicity, and compactness of the DRS system make it a viable alternative for in vivo characterization of biological tissues. Diffuse reflectance spectroscopic diagnosis of cancer is based on the local architectural changes occurring at the cellular and subcellular levels and vascularization that affects the elastic scattering properties of the tissue. In DRS, light enters into the tissue and undergoes a combination of multiple elastic scattering and absorption. The radiation emitted from the tissue provides information about tissue absorbers and scatterers, which are believed to change with tissue transformation. Several researchers have used diffuse reflectance spectroscopy to study biological tissues and tissue characterization. 10, 11, 12, 13, 14, 15 Numerous new optical models and systems developed based on this technique have shown potential to discriminate malignancy with good sensitivity and specificity. Using an analytical diffusion model, Zonios 16 studied differences in hemoglobin concentration and effective scatter size of normal and adenomatous polyps of human colon. Trimodal spectroscopy using fluorescence, reflectance, and light scattering was used by Georgakoudi 17 individually and in combination for evaluating low and high grade dysplasia in patients with Barrett’s esophagus. They found that reflectance and light scattering spectroscopy provide morphologic information on tissue architecture and epithelial cell nuclei. The study results of Sokolov 18 with polarized light suggest that reflectance spectroscopy can provide quantitative morphological information that could potentially be used for noninvasive and real-time detection of epithelial neoplasia. The complimentarity of diffuse reflectance and its application to correct the distortions in the measured autofluorescence of oral mucosa was studied by de Veld 19 Utzinger 20 in a study of reflectance spectra of ovarian tissues in patients found that reflectance intensity in the 540 to range and slopes of the spectrum in the 490 to and 510 to ranges at different source–detector separations distinguish normal tissues from malignant with an overall specificity of 79% and sensitivity of 86%. Recently, in an ex vivo environment, Subhash 21 observed that dips due to blood absorption seen in the diffuse reflectance spectra of oral mucosa could be used to classify different grades of cancer. They reported that the reflectance intensity ratio R540/R575 of oxygenated hemoglobin absorption maxima at 542 and vary with the histological grade of malignancy. The complex anatomy of the oral cavity with differences in histology, keratin content, and diverse lesions makes it distinctive from other organs. De Veld 7, 19 have measured diffuse reflectance spectra from different anatomical sites in healthy volunteers and used the data for distinguishing premalignant from normal/benign mucosa. Even though malignant lesions of oral cavity could be reliably distinguished from healthy mucosa, correct classification of benign from dysplastic and cancerous tissue types was difficult due to low overall specificity of 77% and sensitivity of 69% obtained by principal component analysis (PCA) using the Karhunen–Loeve linear classifier. Recently, a comparative study of PCA with a Monte Carlo inverse model was carried out for diagnosis of oral and breast cancer using DR spectroscopy in the UV-VIS spectrum.22, 23 The diagnosis of breast cancer from normal based on elastic scattering spectroscopy (ESS) by Bigio 24 has yielded sensitivities of 69 and 58% and specificities of 85 and 93% for breast tissues and sentinel nodes, respectively, using artificial neural networks (ANN). When the same dataset was analyzed using hierarchical cluster analysis (HCA), the corresponding sensitivities and specificities were 67, 91, 79, and 77%, respectively. Preliminary ESS studies on gastrointestinal tissue involving colon, rectum and stomach by Mourant 25 have shown the potential of using the area under the absorption dips, spectral slope from 435 to , and signal ratios in the near-UV and red regions of the spectra to discriminate various tissue types. Amelink 26 used differential path-length spectroscopy (DPS) based on diffuse reflectance to determine the local capillary oxygenation, blood volume fraction, blood vessel size, and wavelength dependence of the scattering coefficient in vivo. Since all these parameters may be related to local morphological and physiological changes occurring during malignant transformations, they could establish DPS as a tool to discriminate premalignant lesions from normal mucosa. In this study, we have utilized the R545/R575 ratio of oxygenated hemoglobin absorption bands in the DR spectra for early detection and grading of oral malignancy in a clinical environment. Toward this, we have measured site-specific DR spectra of healthy population and generated scatter plots of the R545/R575 ratio to discriminate malignant lesions from dysplastic, and hyperplastic tissues from dysplastic and normal tissues. The advantage of using site-specific data to discriminate early stages of buccal cancer is brought out in this clinical trial, and the results are presented. 2.Materials and Methods2.1.Study Protocol and Clinical MeasurementsThe study subjects included 36 healthy volunteers with no clinically observable lesions or inflammatory conditions in their oral cavity and 29 patients with clinically suspicious lesions of diverse grades in different anatomical sites of their oral cavity. The patients were within the age group of 32 to 83 years with an average age of 62 years, whereas the volunteers were in the 23 to 28 age group with an average age of 25 years. An experienced clinician specialized in head and neck cancer selected suitable patients for spectral studies and recorded its visual imprint. Patients received no incentives for participating in this clinical study. Most of the patients studied had prolonged smoking or pan chewing habits, whereas healthy volunteers were free from such habits and maintained good oral health or hygiene. Spectral measurements were carried out at the outpatient clinic of the Regional Cancer Centre (RCC), Thiruvananthapuram. The approval of the Ethics Committee of RCC was obtained for the clinical trial and study protocol. After explaining the modalities of the study, written informed consent was obtained from each patient and volunteer before enrolment. Considering the heterogeneous nature of the oral cavity lesions, 15 sets of reflectance measurements were taken from each selected lesion , which consisted of suspicious and margin areas, approximately within the lesion boundary. In some subjects, measurements were not possible from the margin areas as the lesion had spread all over, whereas some patients had multilesions suitable for measurement. Before initiation of measurements, the patients and volunteers were directed to hold 0.9% saline solution for 2 to to reduce the effects of recently consumed food. After in vivo DRS measurements, biopsy specimens were taken from the centre of the selected lesions. Since the laser beam illuminates only a small area ( in diam) of the lesion, multiple biopsies were not possible. The biopsy samples were fixed in 10% normal formalin solution and sent for pathological analysis. Histology slides prepared from biopsies were classified by an experienced pathologist who was blinded to the spectral results. In the case of healthy volunteers, classification was based only on visual inspection. After classification, the spectroscopic data were interrogated with the histopathological findings. Independent Student’s t-tests were performed on the R545/R575 ratio between different tissue categories, and the predictive values determined were used to determine the statistical significance of the method in differentiating mucosal variations. 2.2.InstrumentationSchematic of the compact and portable DR spectroscopy system developed for the study is shown in Fig 1 . The system comprises a tungsten halogen lamp (Model LS1-LL, Ocean Optics, Dundlin, Florida), which acts as the white light source. The bifurcated optical fiber guides the light emission from this lamp to the tissue sample through a 3-m-long fiber optic cable that has a central fiber to deliver the excitation beam and six surrounding fibers ( each) to collect diffuse reflectance from tissue samples. The probe tip is terminated in a stainless steel ferrule, long and that enabled sterilization before and after use. A black PVC sleeve long inserted at the probe tip maintains a fixed separation of approximately between the probe tip and the tissue sample, and maximizes the reflectance signal by providing optimum overlap between the excitation and collection areas. This opaque sleeve was disposable and had the additional advantage of avoiding the ambient light from entering the detection system. The light emanating from the sample was delivered to the miniature fiber optic spectrometer (model USB 2000FL VIS-NIR, Ocean Optics, Dundlin, Florida), connected to the USB port of a laptop computer. 2.3.Data Acquisition, Review, and ProcessingThe measurement probe was kept in a plastic box containing Formalin tablets for sterilization. The output energy from the tungsten halogen lamp was monitored at the fiber tip using a power/energy meter (Ophir Optronics, Israel) and maintained at a constant value during the entire study. Slight pressure was applied on the lesion with the sleeve tip of the probe to avoid room light from entering the detection system. The miniature fiber optic spectrometer has a 600-lines/mm, blazed grating for operation in the 360 to wavelength range. The detector used is a 2048-element linear silicon charge-coupled device (CCD) array, and in conjunction with a monochromatic slit, an optical resolution of ca. was achieved. The spectrum was acquired in the 400 to spectral range with the help of the OOI Base32 software provided by Ocean Optics, USA. The OOI Base32 software was configured to record the spectra, averaged for 40 pulses, with a boxcar width of and an integration time of . The background spectrum was recorded prior to measurements, and the software automatically subtracts the same from DR measurements taken at different points in the selected lesion. Out of the 15 DR measurements taken from each site, those affected, if any, by external room light or other interferences were discarded and 10 DR spectra with similar shape were selected and averaged for analysis by an investigator blinded to the pathological results. The spectra recorded were not corrected for the wavelength response of the detection system. Diffuse reflectance intensity ratio R545/R575 of the oxygenated hemoglobin bands at 545 and was computed from the recorded mean spectra. 3.Results3.1.Diffuse Reflectance Spectroscopy of Healthy PopulationHistopathological analysis of the biopsy samples from adjoining areas of malignant oral mucosa in patients often shows varying degrees of epithelial dysplasia and hyperplasia. Hence, there is every possibility that utilization of the R545/R575 ratios with respect to these adjoining lesions as control could lead to reduced sensitivities and specificities of diagnosis. To overcome this, we have carried out DR spectral measurements from 14 different anatomical sites of the oral cavity of healthy volunteers, namely, the right and left buccal mucosa, the gingiva, the upper and lower alveolus, the floor of mouth, the hard and soft plate, the dorsal tongue, the lateral border tongue, the ventral tongue, the inner lip, the vermillion border of lip, and the transition of tongue, shown in Fig. 2 . The diffuse reflectance spectra of healthy volunteers show dips due to oxygenated hemoglobin absorption at 420, 545, and . Figure 3 shows the variation of the mean diffuse reflectance spectra from different sites. The DRS from gingiva and alveolus mucosa show lower reflectance intensities, whereas spectra from buccal mucosa and dorsal tongue have maximum reflectance. Since the spectral features of right and left buccal mucosa and upper and lower alveolus are similar, these have been grouped and their mean spectra are shown in Fig. 3. The average spectra from the other eight anatomical sites that had similar features were grouped together and shown separately. Fig. 3Mean DR spectra from dorsal side of tongue, buccal mucosa, alveolus, and gingiva, compared with the average spectra from the other eight sites of the oral cavity. All spectra represent the mean of ten measurements each in 36 volunteers. The error bars relate to the standard deviations at 545, 575, and (maximum of the DR spectra) for different sites. 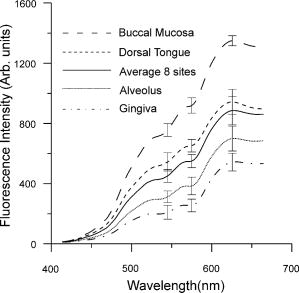 3.2.Diffuse Reflectance Spectroscopy of Patient PopulationWe have observed substantial variation in the in vivo diffuse reflectance spectral intensities between SCC, dysplasia, hyperplasia, and healthy mucosa. Figure 4a shows the mean diffuse reflectance spectra from buccal squamous epithelium of healthy volunteers and from 22 sites in 13 patients with varying grades of malignancy. Figure 4b represents the spectra at ten sites from the dorsal tongue of six patients and the corresponding site-specific healthy tissue spectra. As compared to healthy volunteer spectra, the oxygenated hemoglobin absorption dips at 545 and were less prominent in cancerous lesions. The diffuse reflectance of malignant and premalignant lesions is lower, owing to increased absorption associated with tissue vascularity and other inhomogeneities, and varies according to the grade of malignancy. Fig. 4Average DR spectra of patients grouped according to varying grades from (a) buccal mucosa (SCC 12 sites, dysplasia 3 sites, and hyperplasia 7 sites) of 13 patients, and (b) dorsal tongue (SCC 7 sites and dysplasia 3 sites) of six patients. The healthy spectra represent site-specific means of ten measurements in 36 volunteers. The error bars relate to the standard deviations at 545, 575, and (maximum of the DR spectra) for different tissue types. 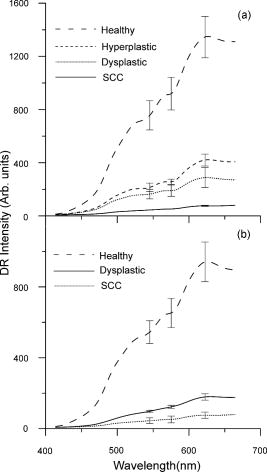 3.3.Oxygenated Hemoglobin Absorption Ratio R545/R575The mean diffuse reflectance spectral intensity ratio (R545/R575) at the oxygenated hemoglobin absorption dip was calculated at different anatomical sites in healthy volunteers. The ratio had a minimum (0.75) at the vermillion border of the lip and a maximum (0.79) at the gingival mucosa, with an all-sites average of 0.782. Table 1 gives the mean R545/R575 ratio in 29 patients having diverse tissue characteristics, compared with the site-specific ratio of healthy volunteers. The results of histopathological examination, visual impression by the clinician, and spectral impression based on scatter plots of R545/R575 ratio are also presented in Table 1. Table 1Diffuse reflectance ratio R545/R575 from 48 sites in 29 patients and their histopathological, visual and spectral impressions.
For ease of comparison, we have grouped the oral mucosa into four categories. The first category consists of healthy volunteer epithelium that is designated as normal; whereas the second, third, and fourth categories comprise hyperplastic, dysplastic (precancer), and SCC (malignant), respectively. Table 2 shows the mean R545/R575 ratio of healthy volunteer tissues and patient mucosa from all sites listed in Table 1 and regrouped into the prior three distinct categories. The R545/R575 ratio is lowest for normal, and its increasing trend with higher grades of cancer points to the distinct possibility of using this ratio for tissue classification. Table 2Mean DR spectral ratio R545/R575 of healthy population and at different sites of patients classified according to different grades.
3.4.Tissue Classification using R545/R575 Scatter PlotsFigure 5a shows the scatter plot of R545/R575 ratio for discriminating hyperplastic, dysplastic, and malignant tissues of the buccal mucosa in 13 patients. Figure 5b shows the dorsal tongue in six patients for discriminating dysplastic and SCC lesions using site-specific healthy volunteer ratios as normal. Owing to the limited number of patients studied having cancers affecting these sites, the sensitivities and specificities shown may not be representative. Therefore, the mean spectral intensity ratio R545/R575 from all 48 sites studied, comprising hyperplasia, dysplasia, and SCC, for the complete set of 29 patients is plotted in Fig. 6 , along with the corresponding mean data from 36 healthy volunteers. Discrimination lines are drawn between the normal (average of all anatomical sites) and hyperplasic, hyperplastic and dysplastic, dysplastic and SCC, at values that correspond to the average ratio value of the respective groups. The classification sensitivity and specificity in discriminating each of these categories were determined based on the discrimination threshold values by validation with the gold standard, namely, histopathological results of biopsy specimens taken from DRS measurement sites. Fig. 5Site-specific DR spectral ratio scatter plots discriminating different grades of cancer (a) from 21 buccal mucosal sites in 12 patients and (b) from ten sites on the dorsal tongue in six patients, compared with site-specific ratio of normal tissues in the healthy population. 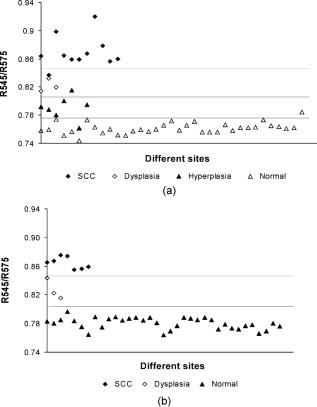 Fig. 6Combined DR spectral ratio scatter plot discriminating different grades of cancer from 48 sites in 29 patients compared with the mean normal values in 36 healthy volunteers. 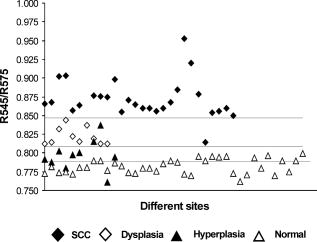 For example, the cut-off line discriminating the normal from hyperplastic was drawn at 0.789 that corresponds to the mean of healthy volunteer R545/R575 ratio (0.782) and that of the hyperplastic mucosa ratio (0.795) of patients. Similarly, the other two cut-off lines discriminating hyperplasia with dysplasia and dysplasia with SCC were drawn at their respective mean values, and each ratio was assigned a spectral impression based on their position in the scatter plot (Table 1). 4.DiscussionThe mean diffuse reflectance spectra from the epithelial tissues of healthy volunteers and hyperplastic, dysplastic, and SCC lesions of patients show distinctive features that relate to their unique oxygenated hemoglobin absorption and scattering properties. The decrease in diffuse reflectance intensity of abnormal mucosa may be explained by increased absorption at the thickened epithelium and local architectural changes at the cellular and subcellular levels, including changes in the nuclear-to-cytoplasmic ratio of the epithelial cells, stromal properties, and neovascularization, which in turn affects the elastic scattering properties of the tissue.27, 28 As observed by Amelink 26 and Lovat 29, we also have noticed that oxygenated hemoglobin absorption dips at 545 and are more prominent in healthy volunteers, and these dips become less pronounced in dysplastic and are minimal in SCC [Figs. 4a and 4b]. The aforesaid decrease could be explained on the basis of the biosynthetic Heme pathway. In the normal biosynthesis of heme, ALA is produced from the condensation of glycine and succinyl-coenzyme A (CoA), catalyzed by 5-aminolevulinic acid-synthase (ALA-S), which is located in the inner mitochondrial membrane, and is considered to have a regulatory function on the biosynthesis of heme. Several biochemical steps involving decarboxylations and oxidations then occur when the molecule reenters the mitochondria, where the protoporphyrinogen is finally oxidized to protoporphyrin IX (PpIX). The last step has a rate-limiting function, which is the incorporation of into PpIX by the enzyme ferrochelatase. Heme is then used for the production of conjugated proteins like hemoglobin, myoglobin, and cytochrome. The limited activity of ferrochelatase in abnormal tissue hinders the conversion of PpIX to heme, which in turn limits the formation of oxygenated hemoglobin and the associated absorption at 545 and . The mean diffuse reflectance ratio (R545/R575) of healthy volunteers was always found to be lower compared to malignant and precancerous sites of patients (Table 2). The increase in the value of this ratio points to the grade of malignancy. As the oral mucosal tissues become transformed from normal to hyperplastic, from hyperplastic to dysplastic, and from dysplastic to SCC, the ratio values increase respectively by 1.63, 4.86, and 10.21%. Sensitivity and specificity30 of diagnosis were determined using the cut-off lines in scatter plots [Figs. 5a, 5b, 6]. Table 3 lists the mean sensitivity and specificity of discriminating normal tissues from hyperplastic, hyperplastic from dysplastic, and dysplastic from SCC lesions for all the sites in 29 patients and at the 21 buccal sites in 13 patients. The improvement in sensitivities and specificities owing to the use of the site-specific R545/R575 ratios in the scatter plots is marked. In the case of buccal tissues, the sensitivity and specificity for discrimination of hyperplastic tissues from normal becomes enhanced from the all-site value of 70 and 63%, respectively, to 97 and 86%, with positive predictive values of 0.86 and negative predictive value of 0.97. However, for discriminating precancerous dysplastic buccal mucosa from hyperplastic tissues, a sensitivity of 100% and specificity of 86% was achieved, with a positive predictive value of 1.0 and a negative predictive value of 0.88. On the other hand, dysplastic buccal lesions were distinguishable from SCC with a sensitivity of 96% and specificity of 100%, with a corresponding positive predictive value of 0.91 and negative predictive value of 1.0. Although the number of patients studied with dorsal tongue cancer was only six, we could differentiate the three dysplastic lesions from normal and seven SCC lesions with 100% sensitivity and specificity. The low independent Student’s t-test values signifies the relevance of using the scatter plots to discriminate different grades of oral mucosa. Table 3Diagnostic accuracies for discriminating different tissue types in a group of 29 patients and results of independent student t-test analysis of DR spectral ratio R545/R575.
PPV
-Positive predictive value
NPV
-Negative predictive value
p
-Level of statistical significance In comparison, using trimodal spectroscopy, which is a combination of fluorescence, reflectance, and light scattering techniques, Muller 31 had achieved a sensitivity of 64% and specificity of 90% for distinguishing precancerous dysplastic tissues from malignant oral mucosa. During bladder cancer diagnosis with diffuse reflectance, Koenig 14 achieved a sensitivity of 91% and specificity of 60% for distinguishing nine malignant and two dysplastic lesions using an algorithm based on the total amount of blood in tissue. Using different pattern recognition tools on diffuse reflectance spectra, a sensitivity 89% and specificity of 75% was achieved by Ge, Schomakar, and Nishioka13 for identifying colonic dysplasia from hyperplasia. Zhu 23 obtained a sensitivity and specificity of 80% for discriminating malignant and nonmalignant breast tissues using both a Monte Carlo inverse model and PCA algorithm. Spectral impression given in Table 1 for each site was assigned based on the spectral ratios in the scatter plot. Most of the lesions from the margin areas that appeared clinically as normal had spectral impressions of dysplasia or hyperplasia. The accuracy of the spectral impressions could be ascertained from the matching histopathological findings in a majority of the cases. Further, using these scatter plots, it was possible to accurately categorize the lesion that appeared as ulcerative proliferate growth for the clinicians as SCC, in the case of patients 4, 17, 20, 28, and 29, and as dysplasia in the case of patients 10 and 26. Clinically, leukoplakias are treated as low-risk white patches, which are generally identified histopathologically as lesions associated with hyperkeratosis and hyperplasias, with or without dysplasia. The hyperkeratotic lesion appears white to the clinicians due to the thickened keratin layer, which hinders the light from entering deeper into the tissue and increases the scattering. Since hyperkeratosis is often associated with dysplastic and malignant lesions, it is very difficult for the clinicians to decide whether the lesions are malignant, premalignant, or benign. In two cases (patients 12 and 15 in Table 1), tissues with visual impression as leukoplakia were found to be SCC on histological analysis and also with the R454/R575 scatter-plot-based spectral impression. Further, in a case where the pathological examination was not able to classify the tissue correctly as SCC (patient 4 in Table 1), it was histologically classified as highly suspicious SCC, but was later confirmed as SCC, considering the opinion of the clinician. Such lesions were also classified correctly by the scatter plot algorithm as SCC. Thus, the spectral methodology developed could act as an adjunct to clinicians in tissue differentiation and facilitate speedy diagnosis in a clinical environment for appropriate follow-up treatment or surgery. The real challenge for a diagnostic system is its ability to track malignancy in the premature stages, i.e., to distinguish hyperplastic (benign) from dysplastic (premalignant) lesions. The majority of studies were undertaken to distinguish normal (a group of healthy and benign) from abnormal (a group of dysplastic and malignant) tissues,23, 25, 31 or dysplastic from malignant lesions,14, 25, 31 or normal from malignant lesions.24, 31, 32 However, only a few studies could discriminate hyperplastic from dysplastic with enough sensitivity and specificity for clinical use. In Table 4 , the diagnostic accuracy of our measurement is compared with some of the existing methodologies for distinguishing hyperplastic from dysplastic tissues in vivo. Table 4Comparison of diagnostic accuracies of the present study with other spectral criteria to distinguish in vivo hyperplasia (benign) from premalignant dysplasia.
LIAFS
–Laser-induced autofluorescence spectroscopy
ESS
–Elastic-scattering spectroscopy
DRS
–Diffuse-reflectance spectroscopy 5.ConclusionsThe results of the study demonstrate that information provided by noninvasive DR spectroscopy has excellent potential to diagnose oral cancer in its early stages. Information regarding tissue transformation can be obtained in vivo with the help of oxygenated hemoglobin spectral ratio R545/R575, which has the ability to discriminate precancerous dysplastic buccal lesions from hyperplastic tissues with a sensitivity of 100 % and specificity of 86% when site-specific values are used. The DR technique can also discriminate hyperplastic buccal sites from normal with a sensitivity of 97% and specificity of 86%. Further, from the available results, it is seen that the DR methodology has the potential to diagnose tongue precancer where techniques based on tissue autofluorescence have low specificity, owing to the presence of porphyrin peaks in healthy tissues.33, 34, 35 Since the DR spectroscopic technique is cost effective and relatively fast, this modality has the potential to be employed in oral cancer screening programs through community centers, and as a tool for biopsy guidance or precise delineation of lesion margins during surgical interventions. AcknowledgmentsThis study was carried out with grants from the Department of Science and Technology (DST), Government of India and the CESS Plan-223 project. The authors are thankful for the Research Council (RC) of CESS and the Institutional Review Board of RCC for their encouragement and support. Mallia acknowledges the DST and CSIR, New Delhi, while Thomas acknowledges RC of CESS, Trivandrum, for their research fellowships. The authors also extended their sincere thanks to all the healthy volunteers and patients who participated in the clinical trials and also to the postgraduate students of Kerala University who assisted us in this study. ReferencesN. Hyde and
C. Hooper,
“Oral cancer: the importance of early referral,”
Practitioner, 243
(1603), 756
–761
(1999). 0032-6518 Google Scholar
C. W. Boone,
J. W. Bacus, and
J. V. Bacus,
“Properties of intraepithelial neoplasia relevant to cancer chemoprevention and to the development of surrogate end points for clinical trials,”
Proc. Soc. Exp. Biol. Med., 216 151
–165
(1997). 0037-9727 Google Scholar
W. G Shafer and
C. A Waldron,
“Erythroplakia of the oral cavity,”
Cancer, 36 1021
–1028
(1975). 0008-543X Google Scholar
P. Suarez,
J. G. Batsakis, and
A. K. el-Naggar,
“Leukoplakia: still a gallimaufry or is progress being made ?—A review,”
Adv. Anat. Pathol., 5 137
–155
(1998). 1072-4109 Google Scholar
M. A. Onofre,
M. R. Sposto, and
C. M. Navarro,
“Reliability of toludine blue application in the detection of oral epithelial dysplasia and in situ and invasive squamous cell carcinoma,”
Oral Surg. Oral Med. Oral Pathol. Oral Radiol. Endod., 91
(5), 535
–40
(2001). 1079-2104 Google Scholar
A. Mahadevan-Jansen and
R. Richards-Kortum,
“Raman spectroscopy for the detection of cancers and pre-cancers,”
J. Biomed. Opt., 1
(1), 31
–70
(1996). https://doi.org/10.1117/1.2169477 1083-3668 Google Scholar
D. C. G. de Veld,
M. Skurichina,
M. J. H. Witjes,
R. P. W. Duin,
H. J. C. M. Sterenborg, and
J. L. N. Roodenburg,
“Clinical study for classification of benign, dysplastic and malignant oral lesions using autofluorescence spectroscopy,”
J. Biomed. Opt., 9
(5), 940
–949
(2004). https://doi.org/10.1117/1.1782611 1083-3668 Google Scholar
D. R. Ingrams,
J. K. Dhingra, and
K. Roy,
“Autofluorescecne charecteristics of oral mucosa,”
Head Neck, 19 27
–32
(1997). 1043-3074 Google Scholar
T. C. Bakker Schut,
M. J. Witjes,
H. J. Sterenborg,
O. C. Speelman,
J. L. Roodenburg,
E. T. Marple,
H. A. Bruining, and
G. J. Puppels,
“In vivo detection of dysplastic tissue by Raman Spectroscopy,”
Anal. Chem., 72 6010
–6018
(2000). https://doi.org/10.1021/ac000780u 0003-2700 Google Scholar
Y. N. Mirabal,
S. K. Chang,
E. N. Atkinson,
A. Malpica,
M. Follen, and
R. Richards-Kortum,
“Reflectance spectroscopy for in vivo detection of cervical pre-cancer,”
J. Biomed. Opt., 7
(4), 587
–594
(2002). https://doi.org/10.1117/1.1502675 1083-3668 Google Scholar
T. J. Farell,
M. S. Patterson, and
B. C. Wilson,
“A diffusion theory model of spatially resolved, steady-state diffuse reflectance for the non-invasive determination of tissue optical properties,”
Med. Phys., 19 879
–888
(1992). https://doi.org/10.1118/1.596777 0094-2405 Google Scholar
R. J. Nordstorm,
L. Burke,
J. M. Niloff, and
J. F. Myrtle,
“Identification of cervical intraepithelial neoplasia (CIN) using UV-excited fluorescence and diffuse-reflectance tissue spectroscopy,”
Lasers Surg. Med., 29
(2), 118
–127
(2001). https://doi.org/10.1002/lsm.1097 0196-8092 Google Scholar
Z. Ge,
K. T. Schomacker, and
N. S. Nishioka,
“Identification of colonic dysplasia and neoplasia by diffuse reflectance and pattern recognition technique,”
Appl. Spectrosc., 52 833
–845
(1998). https://doi.org/10.1366/0003702981944571 0003-7028 Google Scholar
F. Koenig,
R. Larne,
H. Enquist,
F. J. McGovern,
K. T. Schomacker,
N. Kollias, and
T. F. Deutsh,
“Spectroscopic measurement of diffuse reflectance for enhanced detection of bladder carcinoma,”
Urology, 51 342
–345
(1998). https://doi.org/10.1016/S0090-4295(97)00612-2 0090-4295 Google Scholar
M. S. Feld,
“Spectral pathology using reflected light,”
Biomedical Optical Spectroscopy and Diagnostic, Technical Digest, 2 1 Optical Society of America, Washington, DC
(1998). Google Scholar
G. Zonios,
L. T. Perelmann,
V. Bacjmann,
R. Manoharan,
M. Fitzmaurice,
J. V. Dam, and
M. S. Feld,
“Diffuse reflectance spectroscopy of human adenomatous colon polyps in vivo,”
Appl. Opt., 38 6628
–6637
(1999). https://doi.org/10.1364/AO.38.006628 0003-6935 Google Scholar
I. Goergakoudi,
B. C. Jacobson,
J. V. Dam,
V. Backman,
M. B. Wallace,
M. G. Muller,
Q. Zhang,
K. Badizadegan,
D. Sun,
G. A. Thomas,
L. T. Perelmann, and
M. S. Feld,
“Fluorescence, reflectance and light-scattering for evaluating dysplasia in patients with Barrett’s esophagus,”
Gastroenterology, 120
(7), 1620
–1629
(2001). https://doi.org/10.1053/gast.2001.24842 0016-5085 Google Scholar
K. Soklov,
R. Drezek,
K. Gossage, and
R. Richards-Kortum,
“Reflectance spectroscopy with polarized light: is it sensitive to cellular and nuclear morphology,”
Opt. Express, 5 302
–317
(1999). 1094-4087 Google Scholar
D. C. G. de Veld,
M. Skurichina,
M. J. H. Witjes,
R. P. W. Duin,
H. J. C. M. Sterenborg, and
J. L. N. Roodenburg,
“Autofluorescence and diffuse reflectance spectroscopy for oral oncology,”
Lasers Surg. Med., 36
(5), 356
–364
(2005). https://doi.org/10.1002/lsm.20122 0196-8092 Google Scholar
U. Utzinger,
M. Brewer,
E. Silva,
D. Gershenson, R. C. Blast Jr., M. Follen, and
R. Richards-Kortum,
“Reflectance spectroscopy for in vivo characterization of ovarian tissue,”
Lasers Surg. Med., 28 56
–66
(2001). https://doi.org/10.1002/1096-9101(2001)28:1<56::AID-LSM1017>3.0.CO;2-L 0196-8092 Google Scholar
N. Subhash,
J. R. Mallia,
S. S. Thomas,
A. Mathews,
P. Sebastian, and
J. Mahadevan,
“Oral cancer detection using diffuse reflectance spectral ratio R540/R575 of oxygenated hemoglobin bands,”
J. Biomed. Opt., 11
(1), 014018(1-6)
(2006). 1083-3668 Google Scholar
M. C. Skala,
G. M. Palmer,
K. M. Vrotsos,
A. G. Fitzpatrick, and
N. Ramanujam,
“Comparison of a physical model and principal component analysis for the diagnosis of epithelial neoplasia in vivo using diffuse reflectance spectroscopy,”
Opt. Express, 15
(12), 7863
–7875
(2007). https://doi.org/10.1364/OE.15.007863 1094-4087 Google Scholar
C. Zhu,
G. M. Palmer,
T. M. Breslin,
J. Harter, and
N. Ramanujam,
“Diagnosis of breast cancer using diffuse reflectance spectroscopy: comparison of a Monte Carlo versus partial least squares analysis based feature extraction technique,”
Lasers Surg. Med., 38 714
–724
(2006). https://doi.org/10.1002/lsm.20356 0196-8092 Google Scholar
I. Bigio,
S. G. Bown,
G. Briggs,
C. Kelley,
S. Lakshmi,
D. Pickard,
P. M. Ripley,
I. G. Rose, and
C. Saunders,
“Diagnosis of breast cancer using elastic-scattering spectroscopy, Preliminary clinical trials,”
J. Biomed. Opt., 5
(2), 221
–228
(2000). https://doi.org/10.1117/1.429990 1083-3668 Google Scholar
J. R. Mourant,
I. J. Bigio,
J. Boyer,
T. M. Johnson,
J. Lacey,
A. G. Bohorfoush, and
M. Mellow,
“Elastic scattering spectroscopy as a diagnostic tool for differentiating pathologies in the gastrointestinal tract: preliminary testing,”
J. Biomed. Opt., 1
(2), 192
–199
(1996). https://doi.org/10.1117/12.231372 1083-3668 Google Scholar
A. Amelink,
H. J. C. M Sterenborg,
M. P. L. Bard, and
S. A. Burgers,
“In vivo measurement of the local optical properties of tissue by use of differential path-length spectroscopy,”
Opt. Lett., 29
(10), 1087
–1089
(2004). https://doi.org/10.1364/OL.29.001087 0146-9592 Google Scholar
H. J. Van Staveren,
R. L. P. Van Veen,
O. C. Speelman,
M. J. H. Witjes,
W. M. Star, and
J. L. N. Roodenburg,
“Classification of clinical autofluorescence spectra of oral leukoplakia using an artificial neural network: a pilot study,”
Oral Oncol., 36
(3), 286
–293
(2000). https://doi.org/10.1016/S1368-8375(00)00004-X 0964-1955 Google Scholar
V. Backman,
M. Wallace,
L. T. Perelman,
J. T. Arendt,
R. Gurjar,
M. G. Müller,
Q. Zhang,
G. Zonios,
E. Kline,
T. McGillican,
S. Shapshay,
T. Valdez,
K. Badizadegan,
J. M. Crawford,
M. Fitzmaurice,
S. Kabani,
H. S. Levin,
M. Seiler,
R. R. Dasari,
I. Itzkan,
J. Van Dam, and
M. S. Feld,
“Detection of pre-invasive cancer cells,”
Nature, 406 35
–36
(2000). https://doi.org/10.1038/35017638 0028-0836 Google Scholar
L. B Lovat,
K. Johnson,
G. D. Mackenzie,
B. R. Clark,
M. R. Novelli,
S. Davies,
M. O’Donovan,
C. Selvasekar,
S. M. Thorpe,
D. Pickard,
R. Fitzgerald,
T. Fearn,
I. Bigio, and
S. G. Bown,
“Elastic scattering spectroscopy accurately detects high grade dysplasia and cancer in Barrett’s oesophagus,”
Gut, 55 1078
–1083
(2006). 0017-5749 Google Scholar
A. P. Iain and
M. Gearardo,
“A closer look at diagnosis in clinical dental practice: reliability, validity, specificity and sensitivity of diagnostic procedure,”
J. Can. Dent. Assoc., 70
(4), 251
–255
(2004). 0709-8936 Google Scholar
M. G. Muller,
T. A. Valdez,
I. Georgakoudi,
V. Backman,
C. Kabani,
N. Laver,
Z. Wang,
C. W. Boone,
R. R. Dasari,
S. M. Shapshay, and
M. S. Feld,
“Spectroscopic detection and evaluation of morphologic and biochemical changes in early human oral carcinoma,”
Cancer, 97
(7), 1681
–1692
(2003). 0008-543X Google Scholar
D. M. Anjan Dhar,
K. S. Johnson,
M. R. Novelli,
S. G. Bown,
I. J. Bigio,
L. B. Lovat, and
S. L. Bloom,
“Elastic scattering spectroscopy for the diagnosis of colonic lesions:initial results of a novel optical biopsy technique,”
Contact Dermatitis, 63
(2), 257
–261
(2006). 0105-1873 Google Scholar
R. J. Mallia,
N. Subhash,
S. Thomas,
R. Kumar,
A. Mathews,
J. Madhavan, and
P. Sebastian,
“Laser induced autofluorescence spectral ratio standard for early detection of oral cancer,”
Cancer, 112
(7), 1503
–1512
(2008). 0008-543X Google Scholar
D. C. G. De Veld,
S. Marina,
M. J. H. Witijes,
R. P. W. Duin,
D. J. C. M. Sterenborg,
W. M. Star, and
J. L. N. Roodenburg,
“Autofluorescence characteristics of healthy oral mucosa at different anatomical sites,”
Lasers Surg. Med., 23 367
–376
(2003). 0196-8092 Google Scholar
R. Mallia,
N. Subhash,
S. Thomas,
R. Kumar,
A. Mathews,
J. Madhavan, and
P. Sebastian,
“Oral pre-malignancy detection using autofluorescence spectral ratios,”
Oral Oncol., S2 209
–210
(2007). 0964-1955 Google Scholar
|
||||||||||||||||||||||||||||||||||||||||||||||||||||||||||||||||||||||||||||||||||||||||||||||||||||||||||||||||||||||||||||||||||||||||||||||||||||||||||||||||||||||||||||||||||||||||||||||||||||||||||||||||||||||||||||||||||||||||||||||||||||||||||||||||||||||||||||||||||||||||||||||||||||||||||||||||||||||||||||||||||||||||||||||||||||||||||||||||||||||||||||||||||||||||||||||||||||||||||||||||||||||||||||||||||||||||||||