|
|
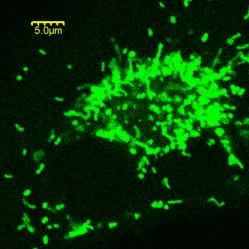
1.IntroductionMolecule-molecule interactions, conformational dynamics, and diffusion underlie the majority of biological processes in living cells such as cell signaling and metabolic pathways. These biomolecular processes span a wide range of spatial and temporal scales (Fig. 1 ) inherent in the crowded,1 complex milieu of living cells. Fluorescence-based techniques have become a powerful and noninvasive tool for cell studies with minimal interference with the cell machinery. Different modalities of fluorescence (e.g., confocal2, 3, 4 and two-photon5, 6) microscopy have been used to visualize and interrogate cellular compartments and the interior of biological tissues with diffraction-limited spatial resolution . Near-field scanning optical microscopy (NSOM),7 total internal reflection (TIR),8 and more recently, stimulated emission depletion (STED),9 have provided a means to image cell organelles with a spatial resolution that extends beyond the diffraction limit. The recent development of single-molecule techniques has reached a new pinnacle, yielding molecular insights into the complexity of enzyme dynamics and chemical kinetics,10, 11 as well as protein folding.12, 13 From the dynamics perspective, translational diffusion has been characterized using fluorescence recovery after photobleaching (FRAP),14 single particle tracking (SPT),15 and fluorescence correlation spectroscopy (FCS).16 On a faster time scale, rotational diffusion and excited-state lifetime have been used for cell17 and protein18 studies due to their sensitivity to both molecular conformation and local environment. Harms have used single-molecule anisotropy imaging for studying lateral and rotational diffusion of fluorescence-labeled lipids on supported lipid bilayers simultaneously.19 In most cases, however, these techniques are being used separately and on an individual basis, which makes a comprehensive look at the same biological system from different perspectives challenging. Fig. 1Schematic illustration of the wide range of time scales associated with the dynamics and chemical kinetics of functional biomolecules. (a) A small fluorophore such as Rh123 is indicated by the small circle. Time-resolved fluorescence polarization anisotropy measurements are sensitive to (b) conformational changes, (c) segmental mobility, and rotational diffusion [(a), (b), and (c), dotted arrows] of labeled proteins, which take place on fast time scales. Translational diffusion [(a), (b), and (c), solid arrows] and (d) reaction (association and dissociation) kinetics of these proteins occur on slower time scales and can be investigated using FCS. These molecular events are sensitive to both the hydrodynamic volume and the surrounding environment throughout a given cell. 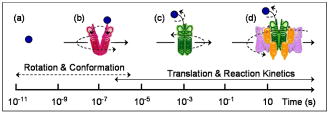 Mitochondria play a key role in cellular processes such as energy metabolism20 and apoptosis.21 In addition, mitochondrial anomalies22 have been reported to correlate with aging and diseases such as cancer, neurodegenerative diseases, and diabetes.23, 24 Rhodamine 123 (Rh123) has been widely used as a mitochondrial label with minimal cell toxicity.20, 25, 26 Rh123 is a lipophilic, photostable fluorophore with a high extinction coefficient and fluorescence ( at emission) quantum yield .20, 27 The high affinity of Rh123 to mitochondria has been attributed to its positive charge and the membrane potential of mitochondria,20 a discovery that has been exploited in membrane potential studies.20, 25, 28 Compared with normal cells, cancer cells generally exhibit a relatively high mitochondrial membrane potential, thus have a high affinity to the charged Rh123 in the mitochondria.20, 29 The nature of Rh123 interaction with mitochondria is not fully understood, even though this fluorescence label has been widely used for tracking and electrophysiological assessment of mitochondria. Here, we describe an integrated, noninvasive, fluorescence-based approach that enables us to perform comprehensive studies on biomolecular and cellular systems over a wide range of spatial (nanometer to millimeter) and temporal (picosecond to second) resolutions (Fig. 1). This experimental approach involves the integration of fluorescence microscopy [confocal and two-photon (2P)], time-resolved fluorescence lifetime imaging (FLIM), fluorescence polarization anisotropy imaging, and different modalities of fluorescence correlation spectroscopy, all built on a single platform. Fluorescence microscopy and differential interference contrast (DIC) imaging would provide the morphological context and cellular framework in which the molecular processes take place. To convert fluorescence intensity to a concentration image, FLIM is used to account for the variation of fluorescence quantum yield (i.e., lifetime) of a given fluorophore throughout cells/tissues. Multiexponential fluorescence decay of a given fluorophore can be assigned to either 1. different excited electronic states (with minor changes in the molecular structure or surrounding), or 2. different conformations (or species) of the same fluorophore. To address this issue, steady-state anisotropy imaging would correlate the heterogeneity in FLIM with the constraints of cellular environment on the fluorophore. In addition, time-resolved anisotropy measurements enable us to relate different fluorescence lifetimes to structures, based on the hydrodynamic volume and surroundings of the fluorophore, since multiexponential anisotropy decays can be interpreted as segmental mobility (conformational changes) or as multiple species with different volumes due to association (transient or long-lived) with other molecules. Further, biomolecules with large volumes would not rotate during the fluorescence lifetime, and therefore, it will be difficult to determine their sizes. As a result, we employed fluorescence correlation spectroscopy (FCS) to distinguish between conformational changes and the coexistence of multiple diffusing species. Table 1 summarizes these techniques, their temporal and spatial resolution, experimental observables, and the projected molecular information. As a proof of principle, we used human breast cancer cells (Hs578T) labeled with Rh123 as a model system to demonstrate the potential of this integrated, multiscale experimental approach. Table 1Integrated fluorescence microspectroscopy provides molecular and cellular information on multiple temporal and spatial scales. Different aspects of each technique are summarized.
2.Materials and Methods2.1.Cell Culture and Mitochondrial LabelingThe human breast cancer cell line Hs578T and its culture media were obtained from American Type Culture Collection (ATCC, Manassas, Virginia). The media is a mixture of Dulbecco’s Modified Eagle Media (DMEM) with 10% fetal bovine serum (FBS) and 1% penicillin-streptomycin. Cells were cultured in T-75 flasks (BD Biosciences, San Jose, California) in a incubator with 5% and allowed to reach 80 to 90% confluence before passing. The cells were then passed to glass-bottomed petri dishes (MatTek, Ashland, Massachusetts) and incubated overnight. After that, the media was removed and replaced with fresh DMEM containing mitochondrial marker Rh123 (Invitrogen, Chicago, Illinois) at a final concentration of . When performing FCS measurements, the incubation concentration was reduced to . The labeled cells were subsequently incubated for before washing three times with phosphate buffered saline (PBS) (Invitrogen, Grand Island, New York) and adding imaging buffer ( NaCl, KCl, , , HEPES, and glucose). Cell morphology was monitored before and after each measurement using DIC to examine possible cell photodamage. For control experiments, free Rh123 was used in PBS at low concentrations . 2.2.Experimental Setup and Data AnalysisA schematic diagram of the multimodal system, housed on a single platform, is described in Fig. 2 . The background and data analysis of each technique are briefly discussed. Fig. 2Schematic diagram of the integrated microspectroscopy setup, on a single platform, for multiscale molecular and cellular biology. A laser-scanning confocal microscopy consists of fiber-coupled laser systems (cw), scanning unit (FV300), and IX80 inverted microscope. The scanning unit and microscope were modified for 2P fluorescence microscopy, lifetime, and polarization imaging. For dynamics studies, a femtosecond laser system (Mira 900), pumped by a solid-state diode cw laser (Verdi V-10), provides pulses at and . When necessary, a pulse picker (Mira 9200) and second harmonic generator (SHG 4500) are used. A fast photodiode (PHD) was also used to generate the SYNC pulse for triggering the SPC-830 module for FLIM measurements. The microscope was also fitted with cross-correlation FCS, which consists of two avalanche photodiodes and a multiple-tau-digital correlator (ALV 6010). Other notations: M is mirror; ND is neutral density filter; BS is beamsplitter; P is polarizer; APD is avalanche photodiode; and ALV 6010 is a multiple-tau-digital correlator.  2.2.1.Confocal microscopyThe confocal microscope consists of an inverted microscope (Olympus, IX81, Melville, New York), 1.2-NA water-immersion objective, a laser scanning unit (FV300, Olympus), and cw lasers [Fig. 2a] with DIC capability. Rh123 was excited using from an argon ion laser (Melles Griot, Carlsbad, California), while the fluorescence was collected using a -BP filter (Chroma, Rockingham, Vermont) and two photomultiplier tubes (PMTs). Data acquisition and analysis were carried out using the Fluoview300 (Olympus) imaging software for 3-D and time-series imaging. The confocal system was modified to allow for fluorescence polarization anisotropy imaging using a newly developed algorithm. 2.2.2.Femtosecond laser systemFor 2P microscopy and dynamics studies, femtosecond laser pulses ( , ) were generated using a titanium-sapphire solid state laser system (Mira 900-F, Coherent, Santa Clara, California) pumped by a diode laser (Verdi-10W, Coherent). The fundamental excitation wavelength range ( : ) was extended to and using a second harmonic generator (SHG 4500, Coherent) and optical parameteric oscillator (Mira OPO, Coherent), respectively [Fig. 2b]. The laser pulses (1P or 2P) were steered toward either the modified FV300 scanner or the back exit port of the microscope for sample excitation using a high NA objective. For single-point measurements, the repetition rate was reduced to using a pulse picker (Mira 9200, Coherent). 2.2.3.Fluorescence lifetime imaging microscopyFollowing pulsed excitation, the epifluorescence (1P or 2P) was isolated using a dichroic mirror and filters before being separated into two channels (using either a or polarizing beamsplitter) for lifetime, anisotropy, or FRET imaging [Fig. 2c]. The epifluorescence polarization was resolved using a Glan-Thompson polarizer per channel prior to being amplified, routed, and then detected using multichannel plate-PMTs (R3809U, Hamamatsu, Hamamatsu City, Japan). The time-correlated single-photon counting histogram was then recorded using the SPC-830 module (Becker and Hickl, Berlin, Germany), which was synchronized with a fast photodiode signal. The measured fluorescence decays at a given pixel can generally be described as a sum of exponentials with time constants and amplitudes :30, 31 The average fluorescence lifetime is calculated as:where the number of exponentials depends on the fluorophore structure and its surroundings. These measurements were carried out using magic-angle polarization to eliminate rotational diffusion effects on the measured lifetime. The excited-state fluorescence decay rate of a given fluorophore is dependent on the radiative and nonradiative rates:30 . A nonlinear least-square fitting routine (SPCM, Becker and Hickl) was used to analyze fluorescence decays with a deconvolution algorithm. The system response function was either generated by the software (based on the decay rise time) or measured experimentally (using the second harmonic signal from monobasic potassium phosphate crystals).In 2P FLIM, were used with 64 time bin per pixel (i.e., ), which naturally leads to a low signal-to-noise ratio and low time resolution per pixel. As a result, FLIM measurements were complemented with comparative studies with a 1P excitation laser that was strategically parked (i.e., single point) on a region of interest (e.g., mitochondrion). Another alternative is to scan the 2P laser pulses over a region of interest (e.g., a single cell), which we refer to as pseudo-single point measurements. In either case, the fluorescence signal was stored in 1024 channels and the fitting quality was evaluated using the residual and . 2.2.4.Converting fluorescence intensities to concentration imagesWe have developed a protocol for converting fluorescence intensity images to quantitative concentration of a fluorophore. In this protocol, the 2P FLIM and intensity images of stained cells were recorded simultaneously.31 Under the same experimental conditions of excitation and detection, the free fluorophore (Rh123 in this case) with known concentration was measured in solution for system calibration. The time-averaged 2P fluorescence from a given pixel , , is defined as32: where and are the fluorescence quantum yield and concentration of a fluorophore at a given pixel. The fluorescence signal also depends on the detection efficiency , the 2P excitation cross section of the fluorophore, and the squared intensity of the excitation laser pulses . The excitation pulse width , repetition rate , and temporal profile can be determined for a mode-locked laser system.33 The fluorescence quantum yield, however, is linearly proportional to the fluorescence lifetime in a given pixel: , assuming a constant radiative rate that can be calculated using steady-state spectroscopy.30 As a result, the dependence of 2P fluorescence signal per pixel on both fluorophore concentration and lifetime should be accounted for such that:The system parameter can be determined experimentally albeit challenging. The system parameter, however, can be cancelled out in relative measurements when the free fluorophore (in solution) of known concentration and labeled cells are measured under the same experimental conditions such that:Accurate calculations of the concentration image in living cells would require careful analaysis of the background signal (± the standard deviation) to ensure a nonzero denominator for any pixel in Eq. 4. In addition, the photoselectivity of polarized excitation must also be accounted for, especially for imaging restricted biomolecules in a highly organized environment such as biomembranes.31 This protocol would also benefit from further modification to account for possible changes of the radiative rate constant (i.e., steady-state spectroscopy) and reduction of fluorescence intensity (or lifetime) due to quenching of aggregated fluorophores in crowded cell compartments.2.2.5.Molecular order and fluorescence polarization anisotropyDuring the excited state lifetime, molecules rotate with characteristic times that depend on their hydrodynamic volumes and immediate surroundings. Both the rotational diffusion and dipole-moment orientation distribution can be measured using fluorescence polarization anisotropy30 imaging. At any given pixel coordinates , the fluorescence polarization anisotropy can be calculated from two simultaneously measured fluorescence intensity images of parallel and perpendicular polarizations, such that31: where the G factor accounts for the bias of the polarization detection. For 1P steady-state anisotropy imaging, the G factor can be estimated by comparing steady-state anisotropy of reference fluorophores in a spectrofluorimeter and in the confocal system.17 For time-resolved anisotropy, the G factor can be estimated using the tail-matching approach30 of a small molecule with a long excited state lifetime (e.g., fluorescein) and a similar emission spectra. The background of parallel and perpendicular images was estimated in an area away from the cell boundaries (or the baseline of corresponding fluorescence decay) and subtracted prior to calculating the corresponding anisotropy decays. Based on the molecular and cellular complexity, time-resolved anisotropy decays can generally be described as31:where the sum of pre-exponential factors equals the initial anisotropy . A fluorophore tethered to a large macromolecule would undergo a segmental motion on a fast time scale, while the overall rotational time would become too slow with respect to the fluorescence lifetime (Fig. 1). In this case, the corresponding pre-exponential factor for the relatively immobile fraction is called a residual anisotropy . Time-resolved fluorescence polarization anisotropy decays were analyzed using OriginPro 7 (Origin Lab®, Northampton, Massachusetts) without deconvolution with the system response function [full-width at half maximum (FWHM) ]. The initial anisotropy depends on the orientation angle between the absorbing and emitting dipoles, such that30:where is the number of excitation photons ( for 1P and for 2P), and the maximum theoretical value of is 0.4 for 1P and 0.57 for 2P.30 High NA objectives can also introduce optical depolarization effects, i.e., smaller steady-state anisotropy.34, 35 The rotational diffusion time of a spherical molecule (which is a valid approximation for Rh123), depends on its hydrodynamic volume and surrounding viscosity 30:where and are temperature (298 K) and the Boltzmann constant, respectively. In some cases, it is difficult to separate the viscosity and size effects on the observed rotational time and, as a result, the apparent hydrodynamic volume may be defined as , normalized by the viscosity of water at room temperature (0.0089 P). Because the excited state lifetime represents the observation window for real-time monitoring of the rotational diffusion of a fluorophore, this technique is limited to molecules with relatively small volumes.2.2.6.Fluorescence correlation spectroscopyFCS is a powerful tool for investigating translational diffusion and chemical kinetics that cause concentration (i.e., fluorescence) fluctuations of single molecules as they diffuse throughout an open observation volume.36 To extend our observation time for monitoring translational diffusion and association kinetics, we have integrated different modalities of FCS into our experimental platform (Fig. 2). The epifluorescence was isolated from the excitation light using a dichroic mirror (690SP) and a filter (525/50BP) prior to being separated into two channels (using either or polarizing beamsplitters). Fluorescence fluctuation signal from an open observation volume was then focused on an optical fiber ( diam), which acted as a confocal pinhole prior to detection by one (autocorrelation) or two (cross-correlation) avalanche photodiodes (APDs, SPCM CD-2969, Perkin-Elmer, Fremont, California). The signals were then correlated using an external multiple-tau-digital correlator (ALV/6010-160, Langen/Hessen, Germany). The system was routinely calibrated using a photostable fluorophore, rhodamine green (Invitrogen), with known diffusion coefficient .37 The autocorrelation function of fluorescence fluctuation is defined as:37, 38, 39 where is the fluorescence intensity at a given time , and is the corresponding fluorescence fluctuation. The autocorrelation for a single diffusing species in a 3-D Gaussian observation volume is given by:37, 38, 39 where is the average number of molecules with a residence diffusion time of and an axial-to-lateral dimension ratio (or structure parameter) of . For spherical fluorophores under 1P excitation, the diffusion coefficient , where and are Boltzmann constant and the radius of the diffusing fluorophore, respectively. In contrast to rotational diffusion , the translational diffusion time using FCS depends on , and therefore, is less sensitive to the molecular hydrodynamic volume.3.Results and Discussion3.1.Mitochondrial Distribution and Movement in the Context of Cell MorphologyDIC and confocal fluorescence images of the Rh123-stained human breast cancer cell line Hs578T reveal a relatively large nucleus-to-cell-size ratio [Figs. 3a, 3b, 3c ], which agrees with previous reports on other cancer cell lines, such as human gastric carcinoma cells.40 This increase of nucleus-to-cytoplasm ratio in cancer cells has already been used by pathologists as a qualitative indicator for malignancy.41 The representative DIC [Fig. 3a] and confocal [Fig. 3b] images show the cell morphology (while undergoing mitosis) and mitochondrial distribution where Rh123 is localized. The observed perinuclear mitochondrial distribution in cancer cells has been observed previously in other cancer cell lines such as breast cancer cells (MCF-7) and human lung carcinoma cells (A549),42 which is attributed to ATP supply for detoxification and high motility in these carcinoma cells.42 Fig. 3High resolution DIC and confocal fluorescence images of Rh123-stained single breast cancer cells reveal distinct cell morphological features. (a) The DIC image of a cell undergoing mitosis within the nucleus. (b) The mitochondria appear clustered in the vicinity to the nucleus with a range of mitochondrial shapes. (c) An overlay of DIC and confocal images. Scale .  For time-dependent measurements on a single mitochondrion, it is essential to assess the mobility of mitochondria such that we can optimize our data acquisition time, which can be as long as several minutes. A time sequence (up to ) of mitochondrial imaging is also shown in Figs. 4a, 4b, 4c, 4d, 4e, 4f, 4g, 4h, 4i, 4j ], away from the nucleus , for tracking the movements of single mitochondrion. A video of the mitochondrial movement (Video 1 ) is provided as supplementary material (37 frames, ). A rough estimate of the lateral diffusion coefficient of a single mitochondrion can be calculated using a basic single particle tracking algorithm, especially for a small and round mitochondrion (e.g., and an average velocity of ). For visualization purposes, the trajectory of a single mitochondrion is also shown [Fig. 4k]. In these rough calculations, we assumed a Brownian motion , which may not be a valid approximation.43 Fig. 4Rough assessment of mitochondrial mobility using time series confocal imaging. (a) through (j) Time series of confocal images were recorded, at high zoom, over periods to monitor isolated mitochondria away from the nucleus. The frame rate of these images is and only ten frames are shown here. (k) The coordinates of a single mitochondrion were tracked as a function of time (i.e., trajectory) to calculate an approximate diffusion coefficient , which is dependent on the size and shape. Scale , the dimension of a single pixel is . 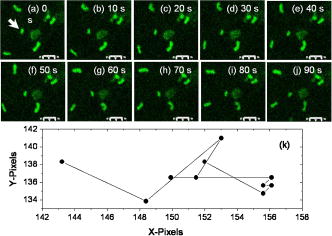 3.2.Excited State Dynamics of Rh123 are Sensitive to Mitochondrial Environment3.2.1.Two-photon fluorescence lifetime imaging spectroscopyTypical 2P fluorescence intensity and lifetime images of Rh123-labeled mitochondria in a single cancer cell are shown in Figs. 5a and 5b , respectively. These images are recorded using excitation ( , at the sample) and a collection time of up to . The pseudocolor of FLIM images ( , 64 time channels/pixel, /channel) represents the average lifetime per pixel of Rh123 throughout the cell. The fluorescence of mitochondrial Rh123 decays as a single exponential with an average lifetime of , which is shorter than free Rh123 in solution ( , ), measured under the same conditions. The corresponding pixel-lifetime histogram [Fig. 5c] shows a broad lifetime distribution due to the heterogeneity of the mitochondrial environment. The observed single-exponential fluorescence decay of Rh123 is in agreement with Schneckenburger, 44 who studied Rh123-stained BKEz-7 endothelial cells using a combination of one-photon FLIM and total-internal reflection techniques. However, the reported fluorescence lifetime of Rh123 is slightly shorter in BKEz-7 endothelial cells (using 5 and for incubation).44 As the dye concentration was increased to 50 and , the authors reported biexponential decays with a fast decay component of (amplitude ). Further reduction of Rh123 fluorescence lifetime was reported in the BKEz-7 mitochondria.44 These differences with our Rh123 fluorescence lifetime in cancer cells can be attributed to the low concentration used in our studies, which would minimize possible homo fluorescene energy transfer (FRET). In addition, the sensitivity of this lipophilic fluorophore to the mitochondrial membrane potential,45 which would depend on the cell line, should not be ruled out. Finally, the use of magic-angle polarization in our studies would eliminate rotational effects on the measured excited state dynamics of Rh123. These FLIM results demonstrate the sensitivity of Rh123 fluorescence lifetime (i.e., quantum yield) to the cellular environment, and therefore, must be accounted for before converting 2P intensities to accurate concentration images of the dye (see next). Fig. 52P intensity, FLIM, and lifetime distribution histogram of Rh123-labeled mitochondrial reflect a heterogeneous environment in a single cancer cell. The 2P fluorescence images were recorded simultaneously using excitation, acquisition time, with /channel. (a) A combination of these 2P fluorescence intensity and (b) FLIM images are used to calculate the concentration distribution of Rh123 throughout the intact, living cell without the need for cell lysates. In addition, the 2P FLIM image provides molecular information concerning how the cell environment may influence the fluorescence properties of the fluorophore. (c) The lifetime-pixel histogram reflects the heterogeneity of the mitochondria distribution with an estimated average lifetime of . Under the same experimental conditions, the fluorescence lifetime of free Rh123 in PBS (pH 7.4) was measured (arrow) at a known concentration. (d) Comparative time-resolved fluorescence of free and mitochondria-bound Rh123 was also measured using the single-point approach for better signal-to-noise ratio. The fluorescence of mitochondrial Rh123 decays as a biexponential with , , , and . In contrast, free Rh123 in solution decays as a single exponential with an estimated lifetime of .  3.2.2.Single-point, time-resolved fluorescenceTo overcome the low signal-to-noise ratio and temporal resolution in FLIM, single-point fluorescence decays were also measured on both free Rh123 in solution (pH 7.4) and mitochondrial Rh123 in living cells [Fig. 5d, Table 2 ]. When one-photon laser pulses ( , , a few ) were strategically focused on an apparent Rh123-stained mitochondrion in live cells, the 1P fluorescence decayed as a biexponential with , , , [Fig. 5d]. The estimated average lifetime of of these decays are consistent with the previously mentioned 2P FLIM studies ( ; ). These decay parameters are significantly different from free Rh123 in solution, where a single exponential was observed with a fluorescence lifetime of . The measured fluorescence lifetime of Rh123 in solution (PBS, pH 7.4) is in agreement with the literature value.44 Further, Ferguson reported a high fluorescence quantum yield for free Rh123, with a negligible yield (0.02) for the triplet intersystem crossing in aqueous solution.45 Table 2A summary of the fitting parameters of time-resolved fluorescence (magic angle detection) of Rh123 in mitochondria of cancer cells. These single-point, one-photon measurements were carried out using 480-nm laser pulses (4.22MHz) , which were strategically focused on regions of interest (i.e., mitochondria), and the fluorescence emission was detected using 525/50BP filter (n=8) . The corresponding fluorescence decay of free Rh123 in solution is also shown for comparison.
The presence of two decay components of mitochondrial Rh123 suggests the existence of either two different emitting species (e.g., two conformations of the fluorophore or different local environments) or excited electronic states. There is some evidence suggesting that the cell uptake of Rh123 is sensitive to the membrane potential,45 while its toxicity correlates with the inhibition of both -ATPase and the respiratory function.23, 24 As a result, it was hypothesized that a fraction of the Rh123 uptake was likely to exist in the mitochondrial matrix for -ATPase inhibition.23, 24 Due to the dynamic nature of mitochondria46 and their relative sizes, it is possible that our observation volume may also sample a fraction of fluorophores in the cytosol or on the glass surface. However, these fractions are likely to be negligible under our experimental conditions. The heterogeneity of fluorescence lifetime (i.e., quantum yield) throughout the cell is used to convert fluorescence intensity images to accurate concentration distributions (Sec. 3.3). Further, we conducted both steady-state and time-resolved fluorescence polarization imaging to elucidate the structural basis that underlies the biexponential decay of mitochondrial Rh123 (Sec. 3.4). 3.3.Concentration Imaging Reveals High Affinity of Rh123 to MitochondriaTo achieve accurate concentrations of biomolecules in living cells, it is essential to quantify fluorescence signal dependence on the fluorophore concentration, fluorescence quantum yield (i.e., lifetime), and the detection efficiency of the imaging system. 2P FLIM measurements of free and mitochondrial Rh123 will enable us to quantify the fluorescence intensity and lifetime distribution throughout a living cell. The relative detection efficiency (or system parameter) can be determined absolutely or cancelled out in relative measurements using free Rh123 in solution with known concentrations. As shown in Fig. 6 , the estimated maximal concentration of Rh123 is up to 30 times higher than the stock solution , which indicates a high affinity of this lipophilic marker to the mitochondrial membrane.20, 46 Previous studies have shown that the Rh123 specificity and strong affinity to mitochondria are due to the ionic interaction between this lipophilic marker and the mitochondrial inner membrane in live cells.20, 44 Unlike most of the rhodamine derivatives, Rh123 is positively charged, which results in its strong attraction to the negatively charged mitochondrial matrix and the high potential gradient across the inner membrane.45 Above the background signal, the average accumulation of Rh123 per pixel is , which is about five-fold larger than the initial Rh123 incubation concentration . One must emphasize that the previously estimated mitochondrial Rh123 concentration should be considered a lower limit due the optical selectivity of polarized excitation of large, randomly distributed molecules. Fig. 6Converting fluorescence intensities to concentration images requires accounting for changes in the fluorescence quantum yield of the fluorophore in the cell environment as well as detection efficiency. 2P fluorescence intensity and FLIM are recorded simultaneously of Rh123-labeled cells. Under the same experimental conditions (i.e., excitation and detection), free Rh123 in solution is measured at a known concentration, which serves as a reference for relative estimates of the detection efficiency (see text). The maximum concentration of Rh123 in this cell (after being incubated with of Rh123 for ) is with an estimated average concentration of .  3.4.Mitochondrial Environment is Restrictive to Rh123 Rotational DiffusionFluorescence anisotropy (both steady state and time resolved) has been widely used in biochemical and biophysical studies of conformational changes associated with intermolecular interactions such as protein-protein, DNA-protein, and cell signaling.47 Anisotropy imaging also enables us to discuss fluorescence lifetime heterogeneity in FLIM measurements in terms of both structural conformations and restriction of the cell environment. 3.4.1.Steady-state fluorescence polarization anisotropy imagingSteady-state fluorescence anisotropy imaging provides a spatial visualization of the dipole-moment distribution of fluorophores and their orientation order with respect to laser polarization. The steady-state fluorescence polarization anisotropy images of Rh123-stained cancer cells were constructed using parallel- and perpendicular-polarization images (either confocal or 2P) that were recorded simultaneously. The anisotropy image of each pixel was calculated using Eq. 5 with background subtractions. Typical confocal 1P fluorescence images with parallel and perpendicular polarizations (using , cw) are shown in Fig. 7a and 7b . The calculated anisotropy image is shown in Fig. 7c with a color code bar for the initial anisotropy per pixel. Since the polarization-analyzed images were recorded with a high NA objective (1.2 NA, , water immersion), the apparent steady-state anisotropy per pixel is convoluted with a possible objective-induced depolarization effect.48 The wide range of average anisotropy per pixel reveals a heterogeneous molecular environment with different degrees of restriction on the fluorophore rotational mobility (or tumbling). The average steady-state anisotropy per single cancer cell is , which is significantly smaller than the theoretical maximum ( for 1P). The observed anisotropy images with low average anisotropy indicate competing depolarization effects that may include 1. high NA objective, 2. fluorescence resonance energy transfer (e.g., homo-FRET), and 3. a percentage of free Rh123 in a nonrestrictive mitochondrial environment. However, the average value is misleading due to the heterogeneous cell environment, as revealed by the 2-D anisotropy image [Fig. 7c]. Using Eq. 7, the anisotropy per pixel can be converted to the angle between absorbing and emitting dipoles31, 49 of Rh123 molecules. The corresponding average angle for the 1P average anisotropy per single cell is . Fig. 7A typical 1P polarization anisotropy image of Rh123-stained mitochondria in a live, intact cell reveals heterogeneous restriction of the fluorescent marker. (a) Parallel and (b) perpendicular 1P fluorescence polarization images were recorded simultaneously using excitation. These images are used in calculating (c) the anisotropy image where each pixel represents the initial anisotropy of the fluorophore Rh123. The different background of parallel and perpendicular images were calculated and subtracted prior to anisotropy image calculations. (d) Complementary time-resolved fluorescence anisotropy decays of free and mitochondria-bound Rh123 are shown. Rh123 in mitochondria exhibit biexponential anisotropy decays (for example, , , and ). The fitting quality can be further improved by adding a minor fast component . The observed complex rotational diffusion reveals a heterogeneous environment that exerts variable constraints on the fluorophore mobility. In contrast, the anisotropy of free Rh123 (PBS, pH 7.4) decays as a single exponential with a rotational time of , which is consistent with its molecular weight. The fitting parameters of time-resolved anisotropy are summarized in Table 3.  Table 3Fitting parameters of time-resolved fluorescence polarization anisotropy of Rh123 in the mitochondria of cancer cells. In these one-photon measurements ( 480-nm pulses at 4.22MHz ), the laser was strategically focused on selected mitochondria, and parallel and perpendicular polarizations of the fluorescence (525/50BP filter) were detected simultaneously (n=6) . The corresponding anisotropy decay of free Rh123 (PBS, pH 7.4, at room temperature) is also shown for comparison.
To the best of our knowledge, these steady-state anisotropy results of Rh123-stained mitochondria in live cells are the first to be reported. Previously, Gidwani, Holowka, and Baird.50 have studied the steady-state fluorescence anisotropies (an average of ) of NBD-PE-labeled lipid bilayers in a cuvette. More recently, changes in the anisotropy of -labeled plasma membrane under different conditions of extensive cross-linking of IgE-receptor in RBL-2H3 mast cells17 have been reported, compared with for -labeled fluid giant unilamellar vesicles (GUVs).31 However, the lipid markers used in those studies have different chemical structures, and therefore, intercalation mechanisms with the lipid bilayer.17, 31 In addition, the inner membrane of mitochondria is known to have higher membrane potential than the plasma membrane in living cells or synthetic lipid bilayers such as GUVs, which explains the labeling specificity of Rh123 to mitochondria.45 As a result, we conclude that Rh123 experiences a more restrictive environment in mitochondria, which we further examine using time-resolved fluorescence polarization anisotropy. 3.4.2.Time-resolved, one-photon-fluorescence polarization anisotropyTo elucidate the structural conformation that underlies Rh123 interactions with mitochondria, we have conducted time-resolved anisotropy measurements in living cells where the laser pulses ( , ) were strategically focused on a single mitochondrion. Time-resolved anisotropy of mitochondrial Rh123 decays as a multiexponential [Fig. 7d, Table 3 ], which represents a complex pattern of rotational motion (tumbling). On average , Rh123 in the mitochondrial compartment exhibits a biexponential decay with and , in addition to a minor fast component ( and an amplitude of ). The overall initial anisotropy and fitting parameters as summarized in Table 3. Since the rotational diffusion time is limited by the fluorescence lifetime of the fluorophore, the slower component will be less accurate for large (or more restricted) molecules. Using Eq. 8 and the average rotational diffusion time of 36.2 ns, the apparent hydrodynamic volume of mitochondrial Rh123 is (i.e., ~3.4 nm radius). In contrast, the fluorescence polarization anisotropy of free Rh123 exhibits a single exponential decay with a fast rotational time in PBS (pH 7.4) at room temperature, which yield a hydrodynamic volume of (i.e., ~0.51 nm radius). Such comparison suggests that the apparent hydrodynamic radius of mitochondrial Rh123 is roughly seven times larger than the free label. Partikian investigated the rotational diffusion of green fluorescent protein (GFP) in the mitochondrial matrix using time-resolved anisotropy.51 The authors reported that the rotational times of GFP in both the mitochondrial matrix and buffer solution are basically the same.51 However, Rh123 is a much smaller fluorophore, and yet exhibits a much slower rotational diffusion component inside cells than in solution . Moreover, the large population fraction of the slow Rh123 suggests that Rh123 is predominately restricted to the mitochondrial inner membrane. The minor fast rotational component is likely due to free Rh123 in the mitochondrial matrix (since free Rh123 in the cytosol is negligible) or segmental mobility within a small wobbling angle. Assigning the intermediate rotational time , however, to a well-defined conformation is not straightforward using only these results. One possibility is that Rh123 intercalates to the mitochondria via two different mechanisms. First, the majority of Rh123 is attached to the inner membrane of mitochondria in the presence of high membrane potential. To be more specific, Rh123 may be attached to -ATPases, causing inhibition to its activities, as proposed by Modica-Napolitano and Singh.23 Second, a small fraction of the fluorescent label, which is positively charged, may exist in a relatively restricted environment either on the inner membrane or in the space between the inner and outer membranes of the mitochondria. These multiple conformations may explain the observed multiexponential fluorescence decays using high temporal resolution (i.e., single-point measurements). The root-square of residual-to-initial anisotropy ratio (i.e., order parameter) is for Rh123 in mitochondria, which indicates a significant degree of orientation constraint on the fluorophore dipole moment.52 This argument is consistent with the previous studies on Rh123 inhibition of oxidative phosphorylation via the disruption of electron transport chain in the inner membrane of mitochondria.22 3.5.Translational Diffusion of Mitochondrial Rh123 as Probed Using FCSTo further explore translational diffusion of Rh123 in mitochondria, we performed fluorescence autocorrelation analysis using FCS with an extended observation time scale up to seconds (with resolution). The fluorescence fluctuation autocorrelation of rhodamine green (RhG), which has a lateral diffusion coefficient ,37 was measured to calibrate our FCS setup with an underfilled objective (1.2 NA, , water immersion) and a fiber as the confocal pinhole. The excited-state lifetime of Rh123 ( in solution, in cells from the FLIM measurement before) and the absorption cross section at excitation suggest a saturation intensity of for cellular studies and in solution.53 As a result, all FCS measurements reported here were carried out in the linear-excitation intensity regime (typically, ) to avoid cellular photodamage or other photophysical processes (e.g., photobleaching, intersystem crossing, and saturation) that would complicate data interpretation. Under such a low excitation intensity, the fluorescence fluctuation autocorrelation function of free rhodamine green ( molecules) in solution is best described by diffusion alone [i.e., Eq. 9] with an estimated diffusion time of at room temperature. Based on the measured diffusion time of RhG and the axial-to-lateral dimension (or structural parameter, ), an observation volume of (for 3-D Guassian) was calculated. Under the same experimental conditions, the stained cells were first imaged (or visualized using the microscope eye piece) to select a region of interest (e.g., a mitochondrion) for FCS measurements where the laser was strategically focused. Since FCS is a single-molecule technique that requires only a few molecules in the observation volume at any given time, the incubation concentration of the stock Rh123 was reduced ( , ) for FCS compared with other fluorescence measurements. Further photobleaching was usually necessary before an autocorrelation function could be observed. As a result, it is not clear if the estimated observation volumes in solution and in restrictive environments that require photobleaching (e.g., mitochondria) would be exactly the same. Having an average dimension of in diameter, a single mitochondrion is unlikely to move considerably during the acquisition time of FCS measurements due to its projected small diffusion coefficient according to our own estimate and other literature values .54 However, our assumption of a Brownian diffusion may not be accurate considering the crowded and complex cellular environment. Moreover, mitochondria in cells keep undergoing fusion and fission46 and therefore changing their shapes and sizes. Typical autocorrelation curves of Rh123 in solution and mitochondria are shown in Fig. 8 . Free Rh123 exhibits a single diffusion coefficient of in solution (at room temperature) with an estimated brightness of . The autocorrelation of cytosolic Rh123 fluorescence (i.e., away from mitochondria) can also generally be described as a single diffusing species with a comparable diffusion coefficient as that of free Rh123 in solution ( molecules, ). In contrast, the autocorrelation function of mitochondrial Rh123 is best described as two diffusing species (or the same species in two different microenvironments), such that:55 where is the fraction of the second diffusing species and is the corresponding autocorrelation function of the ’th species at pixel coordinates inside a cell image. The estimated diffusion coefficients of these species are and , where the amplitude fraction of the slower component is . The diffusion coefficients of both diffusing species in mitochondria (Table 4 ) have large standard deviations, which indicate the complex sampling environment inside the observation volume. Further, these diffusion coefficients yield an apparent hydrodynamic radius of ~1.1 and ~22.3 nm for the fast and slow components, respectively. Importantly, the slow laterally diffusing mitochondrial Rh123 is ~6 times larger than the rotating equivalent, which perhaps suggests a cluster formation on the FCS time scale. Previous studies have suggested that Rh123 is likely to partition into the mitochondrial inner membrane,56 where the intermembrane region (i.e., the space between the inner and outer membranes) of mitochondria is roughly in thickness.57 This provides a number of possible scenarios for the interpretation of our FCS results. Furthermore, any measurement on the inner membrane of mitochondria has the propensity to sample fluorophores from the cytosol and/or the mitochondrial matrix.57 Pastikian reported translational diffusion of GFP in mitochondrial matrix compartments using FRAP51 with a reported diffusion coefficient of . These results were attributed to a relatively uncrowded mitochondrial matrix.51 In this case, we assign the fast component to free Rh123 diffusing in the mitochondrial matrix. However, sampling fluorophores from the cytosol or imaging buffer should not be ruled out, considering the observation volume and the single-molecule sensitivity of FCS. The slow component can be assigned to the translational diffusion of Rh123 in the inner membrane of mitochondria, which is expected to be a more restrictive region than the mitochondrial matrix. Previous research has assigned Rh123 interactions with the mitochondrial inner membrane.20, 25 Apart from the apparent differences in translational diffusion coefficients, there is also a notable decrease in molecular brightness from free solution to Rh123 in mitochondria (Table 4), which is due to the observed reduction of Rh123 fluorescence lifetime in mitochondria (see before).Fig. 8FCS measurements reveal distinct and heterogeneous autocorrelation functions of Rh123-labeled cancer cells. Mitochondrial Rh123 (●) diffuses much slower, and the autocorrelation functions are best described as two diffusing species (or the same species in different microenvironments): (18%) and (82%). The fluorescence fluctuation autocorrelation of free Rh123 (PBS, pH 7.4; ○) can be described as a single diffusing species with a diffusion time of .  Table 4A summary of fluorescence correlation spectroscopy results of rhodamine-123 in solution and living cancer cells. The fluorescence fluctuation autocorrelation of mitochondrial Rh123 is described using two diffusion species with fast and slow diffusion rates. The apparent diffusion coefficients in cellular Rh123 were calculated relative to that of RhG in solution at room temperature (∼2.8×10⁻⁶cm2∕s) . The molecular brightness (number of fluorescence photons per molecule per second) of Rh123 is also shown as a function of the surrounding environment.
4.ConclusionsIn this report, we describe an integrated biophotonics approach, built on a single platform, which we use for multiscale biophysical studies of Rh123 to probe the heterogeneity of the mitochondrial environment in living cells. This experimental approach allows for imaging the cell morphology and mitochondrial distribution using DIC and fluorescence (confocal and two-photon) microscopy at a diffraction-limited spatial resolution . The sensitivity of the excited-state fluorescence lifetime imaging microscopy of Rh123 enables us to quantify the mitochondrial environment effects on the fluorescence quantum yield. The same FLIM approach can also be used to investigate molecule-molecule interactions (e.g., time-resolved FRET), as well as for converting fluorescence intensity to concentration image of living cells without the need to destroy them as in conventional biochemical techniques. Fluorescence polarization anisotropy imaging and rotational diffusion provide molecular insights into the structural conformation, volume, and surroundings of a given fluorophore in living cells. The integrated FCS capability extends our observation time to investigate translational diffusion and chemical kinetics of equilibrated reactions with single-molecule sensitivity. As a result, FCS would enable us to distinguish between conformational changes (that may be transient) and the existence of multiple species with varying volumes. While each method may be quite complex and would require a specialized user (protocol), the interdisciplinary trend in graduate student education would likely help in implementing the proposed approach for multiscale studies. We also acknowledge that some of these measurements will be difficult to carry out simultaneously due to the time consumed in switching between different exit ports. Yet we believe that it will be possible to quantify functionally driven changes in the structural conformation and surroundings using our integrated approach in inherently complex systems. These modalities will provide researchers with a unique opportunity to assess functionally driven, multiscale changes in molecular and cellular biology under controlled stimulation and toward model building. In addition, this integrated approach can be applied to a wide range of molecular and cellular processes such as receptor-mediated signaling. Ultimately, the capability of characterizing the state of molecular assemblies and dynamics within the context of cell morphology may lead to biomedical cell diagnosis and to the high-throughput screening of therapeutic drugs, with single-molecule sensitivity. Currently, we are using the same experimental approach for biomembranes studies (both in an engineered model system and in vivo), energy metabolism, and protein-protein interactions. AcknowledgmentsWe are grateful to Michael Edidin (The Johns Hopkins University) for intriguing and helpful discussions. We thank Andrew Lutes, Florly Ariola, Angel Davey, and Minjoung Kyoung for their help with the manuscript preparation and useful discussion. We are also thankful to Jhanvi H. Dangaria (Dr. Peter Butler Laboratory, Bioengineering) for her help in the optical tracking calculation. This work was supported by the Penn State Materials Research Institute, the Penn State MRSEC (under NSF grant DMR 0213623), the Lehigh-Penn State Center for Optical Technologies, and the Huck Institutes of the Life Science (Penn State University). Additional support was also provided by the National Science Foundation (Grant AG030949), and a Johnson and Johnson/Penn State Innovative Technology Research Seed Grant. We are thankful to Coherent Lasers, Incorporated for their loan of a pulse picker (MIRA9200). ReferencesR. J. Ellis,
“Macromolecular crowding: an important but neglected aspect of the intracellular environment,”
Curr. Opin. Struct. Biol., 11
(1), 114
–119
(2001). https://doi.org/10.1016/S0959-440X(00)00172-X 0959-440X Google Scholar
D. M. Shotton,
“Confocal scanning optical microscopy and its applications for biological specimens,”
J. Cell. Sci., 94
(2), 175
–206
(1989). 0021-9533 Google Scholar
D. Shotton and
N. White,
“Confocal scanning microscopy: three-dimensional biological imaging,”
Trends Biochem. Sci., 14
(11), 435
–439
(1989). 0167-7640 Google Scholar
A. M. Villa and
S. M. Doglia,
“Mitochondria in tumor cells studied by laser scanning confocal microscopy,”
J. Biomed. Opt., 9
(2), 385
–394
(2004). https://doi.org/10.1117/1.1646414 1083-3668 Google Scholar
W. Denk,
J. H. Strickler, and
W. W. Webb,
“Two-photon laser scanning fluorescence microscopy,”
Science, 248
(4951), 73
–76
(1990). https://doi.org/10.1126/science.2321027 0036-8075 Google Scholar
J. Rocheleau,
W. S. Head, and
D. Piston,
“Two-photon NAD(P)H and one-photon flavoprotein autofluorescence imaging to examine the metabolic mechanisms of pancreatic islet beta-cell function,”
Microsc. Microanal., 9 218
–219
(2003). 1431-9276 Google Scholar
M. Hausmann,
B. Perner,
A. Rapp,
L. Wollweber,
H. Scherthan, and
K. O. Greulich,
“Near-field scanning optical microscopy in cell biology and cytogenetics,”
Methods Mol. Biol., 319 275
–294
(2006). 1064-3745 Google Scholar
U. Joos,
T. Biskup,
O. Ernst,
I. Westphal,
C. Gherasim,
R. Schmidt,
K. Edinger,
G. Pilarczyk, and
C. Duschl,
“Investigation of cell adhesion to structured surfaces using total internal reflection fluorescence and confocal laser scanning microscopy,”
Eur. J. Cell Biol., 85
(3–4), 225
–228
(2006). 0171-9335 Google Scholar
K. I. Willig,
R. R. Kellner,
R. Medda,
B. Hein,
S. Jakobs, and
S. W. Hell,
“Nanoscale resolution in GFP-based microscopy,”
Nat. Methods, 3
(9), 721
–723
(2006). 1548-7091 Google Scholar
A. Yildiz,
J. N. Forkey,
S. A. McKinney,
T. Ha,
Y. E. Goldman, and
P. R. Selvin,
“Myosin V walks hand-over-hand: single fluorophore imaging with localization,”
Science, 27 2061
–2065
(2003). 0036-8075 Google Scholar
M. K. Nahas,
T. J. Wilson,
S. Hohng,
K. Jarvie,
D. M. J. Lilley, and
T. Ha,
“Observation of internal cleavage and ligation reactions of a ribozyme,”
Nat. Struct. Mol. Biol., 11 1107
–1113
(2004). https://doi.org/10.1038/nsmb842 1545-9993 Google Scholar
B. Schuler,
E. A. Lipman, and
W. A. Eaton,
“Probing the free-energy surface for protein folding with single-molecule fluorescence spectroscopy,”
Nature (London), 419 743
–747
(2002). https://doi.org/10.1038/nature01060 0028-0836 Google Scholar
A. A. Deniz,
T. A. Laurence,
G. S. Beligere,
M. Dahan,
A. B. Martin,
D. S. Chemla,
P. E. Dawson,
P. G. Schultz, and
W. S,
“Single-molecule protein folding: diffusion fluorescence resonance energy transfer studies of the denaturation of chymotrypsin inhibitor 2,”
Proc. Natl. Acad. Sci. U.S.A., 97 5179
–5184
(2000). https://doi.org/10.1073/pnas.090104997 0027-8424 Google Scholar
G. Sowa,
J. Liu,
A. Papapetropoulos,
M. Rex-Haffner,
T. E. Hughes, and
W. C. Sessa,
“Trafficking of endothelial nitric-oxide synthase in living cells. Quantitative evidence supporting the role of palmitoylation as a kinetic trapping mechanism limiting membrane diffusion,”
J. Biol. Chem., 274
(32), 22524
–22531
(1999). 0021-9258 Google Scholar
Y. Sako,
A. Nagafuchi,
S. Tsukita,
M. Takeichi, and
A. Kusumi,
“Cytoplasmic regulation of the movement of E-cadherin on the free cell surface as studied by optical tweezers and single particle tracking: corralling and tethering by the membrane skeleton,”
J. Cell Biol., 140
(5), 1227
–1240
(1998). https://doi.org/10.1083/jcb.140.5.1227 0021-9525 Google Scholar
S. Zorrilla,
M. A. Hink,
A. J. Visser, and
M. P. Lillo,
“Translational and rotational motions of proteins in a protein crowded environment,”
Biophys. J., 91
(3), 968
–980
(2006). 0006-3495 Google Scholar
A. M. Davey,
R. P. Walvick,
Y. Liu,
A. A. Heikal, and
E. D. Sheets,
“Membrane order and molecular dynamics associated with IgE receptor cross-linking in mast cells,”
Biophys. J., 92
(1), 343
–355
(2007). 0006-3495 Google Scholar
S. Zorrilla,
G. Rivas,
A. U. Acuna, and
M. P. Lillo,
“Protein self-association in crowded protein solutions: a time-resolved fluorescence polarization study,”
Protein Sci., 13
(11), 2960
–2969
(2004). 0961-8368 Google Scholar
G. S. Harms,
M. Sonnleitner,
G. J. Schutz,
H. J. Gruber, and
T. Schmidt,
“Single-molecule anisotropy imaging,”
Biophys. J., 77
(5), 2864
–2870
(1999). 0006-3495 Google Scholar
L. B. Chen,
“Mitochondrial membrane potential in living cells,”
Annu. Rev. Cell Biol., 4 155
–181
(1988). https://doi.org/10.1146/annurev.cb.04.110188.001103 0743-4634 Google Scholar
G. Hajnoczky,
G. Csordas,
S. Das,
C. Garcia-Perez,
M. Saotome,
S. Sinha Roy, and
M. Yi,
“Mitochondrial calcium signaling and cell death: approaches for assessing the role of mitochondrial uptake in apoptosis,”
Cell Calcium, 40
(5–6), 553
–560
(2006). 0143-4160 Google Scholar
A. S. Verkman,
“Solute and macromolecule diffusion in cellular aqueous compartments,”
Trends Biochem. Sci., 27
(1), 27
–33
(2002). https://doi.org/10.1016/S0968-0004(01)02003-5 0167-7640 Google Scholar
J. S. Modica-Napolitano and
K. K. Singh,
“Mitochondrial dysfunction in cancer,”
Mitochondrion, 4 755
–762
(2004). Google Scholar
P. L. Pederson,
“Tumor mitochondria and the bioenergetics of cancer cells,”
Prog. Exp. Tumor Res., 22 190
–274
(1978). 0079-6263 Google Scholar
R. C. Scaduto Jr., L. W. Grotyohann,
“Measurement of mitochondrial membrane potential using fluorescent rhodamine derivatives,”
Biophys. J., 76
(1), 469
–477
(1999). 0006-3495 Google Scholar
L. V. Johnson,
M. L. Walsh, and
L. B. Chen,
“Localization of mitochondria in living cells with rhodamine 123,”
Proc. Natl. Acad. Sci. U.S.A., 77
(2), 990
–994
(1980). https://doi.org/10.1073/pnas.77.2.990 0027-8424 Google Scholar
R. F. Kubin and
A. N. Fletcher,
“Fluorescence quantum yields of some rhodamine dyes,”
J. Lumin., 27 455
–462
(1982). https://doi.org/10.1016/0022-2313(82)90045-X 0022-2313 Google Scholar
M. Huang,
A. K. Camara,
D. F. Stowe,
F. Qi, and
D. A. Beard,
“Mitochondrial inner membrane electrophysiology assessed by rhodamine-123 transport and fluorescence,”
Ann. Biomed. Eng., 35
(7), 1276
–1285
(2007). 0090-6964 Google Scholar
I. C. Summerhayes,
T. J. Lampidis,
S. D. Bernal,
J. J. Nadakavukaren,
K. K. Nadakavukaren,
E. L. Shepherd, and
L. B. Chen,
“Unusual retention of rhodamine 123 by mitochondria in muscle and carcinoma cells,”
Proc. Natl. Acad. Sci. U.S.A., 79
(17), 5292
–5296
(1982). 0027-8424 Google Scholar
J. R. Lakowicz, Principles of Fluorescence Spectroscopy, 2nd ed.Kluwer Academic, New York
(1999). Google Scholar
F. S. Ariola,
D. J. Mudaliar,
R. P. Walvick, and
A. A. Heikal,
“Dynamics imaging of lipid phases and lipid-marker interactions in model biomembranes,”
Phys. Chem. Chem. Phys., 8 4517
–4529
(2006). 1463-9076 Google Scholar
C. Xu and
W. W. Webb,
“Measurement of two-photon excitation cross sections of molecular fluorophores with data from ,”
J. Opt. Soc. Am. B, 13
(3), 481
–491
(1996). https://doi.org/10.1364/JOSAB.13.000481 0740-3224 Google Scholar
M. A. Albota,
C. Xu, and
W. W. Webb,
“Two-photon fluorescence excitation cross sections of biomolecular probes from ,”
Appl. Opt., 37
(31), 7352
–7356
(1998). 0003-6935 Google Scholar
D. Axelrod,
“Carbocyanine dye orientation in red-cell membrane studied by microscopic fluorescence polarization,”
Biophys. J., 26
(3), 557
–573
(1979). 0006-3495 Google Scholar
D. Axelrod,
“Fluorescence polarization microscopy,”
Methods Cell Biol., 30 333
–352
(1989). 0091-679X Google Scholar
S. T. Hess,
S. Huang,
A. A. Heikal, and
W. W. Webb,
“Biological and chemical applications of fluorescence correlation spectroscopy: a review,”
Biochemistry, 41
(3), 697
–705
(2002). https://doi.org/10.1021/bi0118512 0006-2960 Google Scholar
A. A. Heikal,
S. T. Hess,
G. S. Baird,
R. Y. Tsien, and
W. W. Webb,
“Molecular spectroscopy and dynamics of intrinsically fluorescent proteins: coral red (dsRed) and yellow (citrine),”
Proc. Natl. Acad. Sci. U.S.A., 97
(22), 11996
–12001
(2000). https://doi.org/10.1073/pnas.97.22.11996 0027-8424 Google Scholar
U. Haupts,
S. Maiti,
P. Schwille, and
W. W. Webb,
“Dynamics of fluorescence fluctuations in green fluorescent protein observed by fluorescence correlation spectroscopy,”
Proc. Natl. Acad. Sci. U.S.A., 95 13573
–13578
(1998). https://doi.org/10.1073/pnas.95.23.13573 0027-8424 Google Scholar
S. T. Hess,
S. Huang,
A. A. Heikal, and
W. W. Webb,
“Biological and chemical applications of fluorescence correlation spectroscopy: a review,”
Biochemistry, 41
(3), 697
–705
(2002). https://doi.org/10.1021/bi0118512 0006-2960 Google Scholar
Q. F. Li,
G. L. Ou Yang,
C. Y. Li, and
S. G. Hong,
“Effects of tachyplesin on the morphology and ultrastructure of human gastric carcinoma cell line BGC-823,”
World J. Gastroenterol., 6
(5), 676
–680
(2000). 1007-9327 Google Scholar
K. E. Shafer-Peltier,
A. S. Haka,
M. Fitzmaurice,
J. Crowe,
J. Myles,
R. R. Dasari, and
M. S. Feld,
“Raman microspectroscopic model of human breast tissue: implications for breast cancer diagnosis in vivo,”
J. Raman Spectrosc., 33 552
–563
(2002). https://doi.org/10.1002/jrs.877 0377-0486 Google Scholar
A. M. Villa and
S. M. Doglia,
“Mitochondria in tumor cells studied by laser scanning confocal microscopy,”
J. Biomed. Opt., 9 385
–394
(2004). https://doi.org/10.1117/1.1646414 1083-3668 Google Scholar
W. Eimer and
R. Pecora,
“Rotational and translational diffusion of short rodlike molecules in solution: oligonucleotides,”
J. Chem. Phys., 94
(3), 2324
–2329
(1991). https://doi.org/10.1063/1.459904 0021-9606 Google Scholar
H. Schneckenburger,
K. Stock,
M. Lyttek,
W. S. Strauss, and
R. Sailer,
“Fluorescence lifetime imaging (FLIM) of rhodamine 123 in living cells,”
Photochem. Photobiol. Sci., 3
(1), 127
–131
(2004). https://doi.org/10.1039/b306129a 1474-905X Google Scholar
M. W. Ferguson,
P. C. Beaumont,
S. E. Jones,
S. Navaratnam, and
B. J. Parsons,
“Excited state and free radical properties of rhodamine 123: a laser flash photolysis and radiolysis study,”
Phys. Chem. Chem. Phys., 1 261
–268
(1999). 1463-9076 Google Scholar
J. Bereiter-Hahn and
M. Voth,
“Dynamics of mitochondria in living cells: shape changes, dislocations, fusion, and fission of mitochondria,”
Microsc. Res. Tech., 27
(3), 198
–219
(1994). 1059-910X Google Scholar
D. L. Farkas,
G. Baxter,
R. L. DeBiasio,
A. Gough,
M. A. Nederlof,
D. Pane,
J. Pane,
D. R. Patek,
K. W. Ryan, and
D. L. Taylor,
“Multimode light microscopy and the dynamics of molecules, cells, and tissues,”
Annu. Rev. Physiol., 55 785
–817
(1993). 0066-4278 Google Scholar
D. Axelrod,
“Fluorescence polarization microscopy,”
Methods Cell Biol., 30 333
–352
(1989). 0091-679X Google Scholar
G. S. Harms,
L. Cognet,
P. H. Lommerse,
G. A. Blab,
H. Kahr,
R. Gamsjager,
H. P. Spaink,
N. M. Soldatov,
C. Romanin, and
T. Schmidt,
“Single-molecule imaging of l-type channels in live cells,”
Biophys. J., 81
(5), 2639
–2646
(2001). 0006-3495 Google Scholar
A. Gidwani,
D. Holowka, and
B. Baird,
“Fluorescence anisotropy measurements of lipid order in plasma membranes and lipid rafts from RBL-2H3 mast cells,”
Biochemistry, 40
(41), 12422
–12429
(2001). 0006-2960 Google Scholar
A. Partikian,
B. Olveczky,
R. Swaminathan,
Y. Li, and
A. S. Verkman,
“Rapid diffusion of green fluorescent protein in the mitochondrial matrix,”
J. Cell Biol., 140
(4), 821
–829
(1998). 0021-9525 Google Scholar
K. Kinosita Jr., A. Ikegami, and
S. Kawato,
“On the wobbling-in-cone analysis of fluorescence anisotropy decay,”
Biophys. J., 37
(2), 461
–464
(1982). 0006-3495 Google Scholar
J. Schaffer,
A. Volkmer,
C. Eggeling,
V. Subramaniam,
G. Striker, and
C. A. M. Seidel,
“Identification of single molecules in aqueous solution by time-resolved fluorescence anisotropy,”
J. Phys. Chem. A, 103
(3), 331
–336
(1999). https://doi.org/10.1021/jp9833597 1089-5639 Google Scholar
I. Salmeen,
P. Zacmanidis,
G. Jesion, and
L. A. Feldkamp,
“Motion of mitochondria in cultured-cells quantified by analysis of digitized images,”
Biophys. J., 48
(5), 681
–686
(1985). 0006-3495 Google Scholar
R. Oyama,
H. Takashima,
M. Yonezawa,
N. Doi,
E. Miyamoto-Sato,
M. Kinjo, and
H. Yanagawa,
“Protein-protein interaction analysis by C-terminally specific fluorescence labeling and fluorescence cross-correlation spectroscopy,”
Nucleic Acids Res., 34
(14), e102
(2006). 0305-1048 Google Scholar
R. C. Scaduto Jr., L. W. Grotyohann,
“Measurement of mitochondrial membrane potential using fluorescent rhodamine derivatives,”
Biophys. J., 76
(1), 469
–477
(1999). 0006-3495 Google Scholar
J. Rassow,
B. Guiard,
U. Wienhues,
V. Herzog,
F. U. Hartl, and
W. Neupert,
“Translocation arrest by reversible folding of a precursor protein imported into mitochondria. A means to quantitate translocation contact sites,”
J. Cell Biol., 109
(4), 1421
–1428
(1989). 0021-9525 Google Scholar
|