
|
|
1.IntroductionSecond harmonic generation (SHG) microscopy is a noninvasive imaging technique that is gaining popularity for in vitro and in vivo investigation of structural properties and dynamic processes inside the cell. Second harmonic generation has proved to be an extremely beneficial contrast mechanism for studying the structure of cardiac and skeletal muscles,1, 2, 3 as well as larva and adult Drosophila melanogaster muscles.4 SHG highlights the anisotropic (A-) bands of myocytes, which contain myosin filaments, whereas the isotropic (I-) bands generate no second harmonic.2, 5, 6 Unlike multiphoton excitation fluorescence, harmonic generation is a parametric process that does not involve photon absorption. Signal bleaching can be avoided due to the possibility of generating harmonics with an excitation wavelength outside of the linear and nonlinear absorption regions.7, 8 In addition, harmonics can be generated intrinsically within the sample, consequently achieving label-free imaging. These unique properties of harmonic generation microscopy allow imaging of biological samples for prolonged periods of time with negligible tissue damage and without side effects from the addition of fluorescent dyes. If a nonabsorbing wavelength region is chosen, high excitation intensities can be used for imaging, leading to the generation of strong harmonic signals. Strong SHG signals enable the study of semicrystalline order in myocytes4, 5, 9 and help to determine sarcomere lengths with accuracy.2 Notably, the strong SHG signals provide the possibility of studying structural dynamics of sarcomeres during myocyte contraction.4, 9 The nature of the second harmonic generation requires the sample to possess a noncentrosymmetric arrangement. Microcrystalline structures without inversion symmetry can efficiently generate the second harmonic.10 In myocytes, second harmonic is efficiently generated from anisotropic bands, schematically shown in Fig. 1a . The fundamental unit of a muscle cell is the sarcomere, which is primarily composed of actin and myosin filaments in an arrangement that allows the actin to slide along the myosin filaments to contract the sarcomere. The region containing only actin is known as the isotropic band, while the region containing myosin is called the anisotropic band. In the transverse direction, electron microscopy has shown that the formation of sarcomeres exhibits a hexagonal symmetry.11, 12 As shown in Fig. 1b, the myosin filaments are made up of staggered myosin molecules, which have two distinctive parts; rods and heads. In addition, an elastic web, known as the M-band, cross-linking the myosin filaments is located at the center of the A-band. Sarcomeres can vary in size for different organisms, for example, for skeletal myocytes and for Drosophila melanogaster larval muscle.13 Electron microscopy of third instar larva myocytes found the sarcomere length at maximum stretch to be .14 The large sarcomere size of Drosophila larval myocytes makes them ideally suited for investigating the origin of SHG. In addition, the large penetration depth that can be achieved with nonlinear microscopy allows imaging over the entire thickness of a Drosophila larva that has been split open and laid flat. Therefore, SHG microscopy of Drosophila larva myocytes do not require special preparation of a thin sample by cell culturing or tissue sectioning. Structurally, myosin filaments of different organisms can vary considerably in length and width, but the basic organization of the myosin molecules remains similar to the schematic shown in Fig. 1b.15 In particular, the region of antiparallel myosin molecules in the center of the A-band is a common feature in myosin filaments. In skeletal myocytes, the antiparallel region is about 80% of the size of the bare region, which is on the order of in length.16 Fig. 1Schematic diagrams of (a) the sarcomere and (b) the myosin filament structure. The constituting parts of a sarcomere are labeled in (a). The antiparallel arrangement at the center of the myosin filament is shown in (b).  Several studies have been dedicated to elucidate the origin of SHG signal from the striated muscles. It has been shown that SHG originates from the A-band region, and the arrangement of myosin rods in a semicrystalline order is responsible for the generation of strong SHG.4, 17, 18 On the other hand, the diminished SHG signal at the M-band region, which produces the characteristic double peak, has not been characterized, although it has been observed in numerous studies.2, 4, 6, 18 The reduced SHG intensity at the center could result from the absence of myosin heads in that region or because myosin molecules do not generate the second harmonic at their rod ends. However, in this work we provide evidence that destructive interference from the presence of oppositely orientated myosin molecules diminishes SHG intensity at the center of the A-band. During stretching, a separation of the antiparallel myosin molecules leads to a change in phase matching conditions, giving rise to constructive interference of the radiated SHG photons. Constructive interference increases the intensity of SHG in the middle of the A-band and changes the band from a double peak to a single peak profile. This phenomenon is the muscle analog to the conclusions made by Moreaux when observing an intensity reduction from membranes, imbedded with a SHG emitter, undergoing fusion.8 The presented results are in accordance with previous observations of increasing SHG intensity with increasing sarcomere length.4, 6 The present study shows that SHG can be used for dynamic investigations of structural changes during muscle contraction and may potentially be applied for diagnostic purposes of muscular disorders where determination of muscle contraction dynamics is required. 2.Materials and Methods2.1.Excitation SourcesTwo femtosecond lasers were used as excitation sources for microscopic imaging. For rhythmic contraction imaging, a home-built extended cavity Ti:sapphire oscillator emitting pulses at a repetition rate was employed. The emission wavelength of this laser was tuned to , and no more than of incident energy per pulse was used for imaging. Stretched muscle imaging was accomplished with excitation from a diode-pumped Yb-ion-doped potassium gadolinium tungstate (Yb:KGW) laser. The home-built oscillator delivered pulses at a repetition rate of , and no more than of incident energy per pulse was used for nonlinear microscopic imaging. The full description of the laser is presented elsewhere.19 In contrast to cardiomyocytes, where the Ti:sapphire laser compromised viability,3 Drosophila myocytes could be imaged with both lasers for long periods of time with no observable damage. Multiphoton excitation autofluorescence was not observed for Drosophila myocytes, indicating the absence of nonlinear absorption at the excitation wavelengths of both lasers. 2.2.Microscope SetupThe Ti:sapphire or Yb:KGW femtosecond oscillator was coupled to a home-built, nonlinear excitation laser scanning microscope previously described elsewhere.3, 4 Briefly, 2-D images were obtained by rastering the laser beam by two closed-loop galvanometric mirrors (GSI Lumonics, Bedford, MA, USA, VM500 series). A -NA microscope objective (Carl Zeiss, Germany) was used for focusing the fundamental light into the sample. In the forward direction, the second harmonic was collected with a home-built UV transmitting objective. To obtain 3-D sectioning, the sample was translated axially via a piezoelectric translation stage (Dynamic Structures and Materials, Franklin, TN, USA, FPA-500) with an optical encoder (MicroE Systems, Natick, MA, USA) for position feedback. The emitted photons were detected with a photomultiplier tube (Hamamatsu, Shizuoka, Japan, H5783P-03). The data acquisition electronics feature photon-counting detection with simultaneous three-channel recording (NI-6602, National Instruments, Austin, TX, USA). Both scanning and detection was controlled with a LabVIEW interface (National Instruments, Austin, TX, USA) created specifically for this imaging system. Acquisition rates were around eight frames per second. Typical acquisition times for the whole 3-D stack were on the order of several minutes, dependening on the desired resolution and signal-to-noise ratio. The SHG signal strength was sufficient for analysis of individual frames, i.e., for dynamics of contractions, but in general, several frames were averaged to improve the signal-to-noise ratio. 3-D stacks of images collected with the nonlinear microscope were analyzed with ImageJ software. 2.3.Sample PreparationDrosophila melanogaster stocks were raised on Bloomington medium at and the yw strain was used throughout these experiments. Third instar larvae were selected and dissected by cutting the larva lengthwise, removing the internal organs, and unfolding the tissue to lay flat. Sample immobilization was ensured by gluing, with Nexaband (WPI, Incorporated, Sarasota, FL, USA), the corners and ends of the larva to a microscopic coverslide coated with a layer of Sylgard (WPI, Incorporated, Sarasota, FL, USA) for better glue adhesion. The prepared larva was immersed in Drosophila saline, HL3, to prolong viability.20 For stretching experiments, only one end of the larva was fixed to the coverslide, and a lightweight string was glued to the free end so that weights could be incrementally added to increase the tension on the muscles. 3.ResultsSarcomeres of myocytes imaged with SHG microscopy have been shown to exhibit a characteristic double peak intensity profile originating from anisotropic bands.2, 4, 6, 18 Similarly, the double peak structure can be observed in the myocytes of dissected larva of Drosophila melanogaster [see Figs. 2a and 2b ]. The myofibrils were oriented with respect to the incident polarization by rotating the microscope stage for maximum SHG intensity. However, when muscles are stretched, the dim center becomes less distinguishable, and for some sarcomeres a single peak emerges, as can be seen in Figs. 2c and 2d. During the stretch of larvae, the average sarcomere length along the indicated myofibril increased from (Fig. 2). The average sarcomere length along a myofibril was found by measuring the M-line—to—M-line distance of several (5 to 8) sarcomeres. The position of M-line was assumed to be the center of the maximum in the single peaked, or the center of the dip in double peaked sarcomeres. Distortions in the stretched myocyte are due to existing bridges between neighboring myofibrils and differences in the rigidity of connective tissue attached to the muscle of dissected larva. The stretching force was applied to one end of the whole larva, therefore changes in the height of the myocyte and twisting of the muscle was observed during stretching. To compensate for the variation in height, 3-D images of the myocyte were taken at each stretch. Nonetheless, the change from double peak to single peak anisotropic band structure is clearly visible. Single peaks of stretched sarcomeres can also be identified in the work by Both, but the phenomenon was not explained or discussed.6 Fig. 2SHG images of (a) relaxed and (c) stretched larvae myocyte from Drosophila melanogaster. The intensity profiles from unstreched (average length of sarcomere is ) and stretched (average length ) row of sarcomeres is presented in (b), and (d), respectively. The intensity profiles exhibit double peaks for unstretched and single peaks for stretched sarcomeres. The circled sarcomere is analyzed in further detail in Fig. 3.  Fig. 3Transition of the SHG intensity profile from a double peak to a single peak during sarcomere stretching. The solid line represents unstretched sarcomere, while dashed and dotted lines represent the sarcomere under gradually increasing tension, respectively. The numbers in the figure legend represent a total length of the sarcomere measured between Z-lines. The position of Z-lines was determined as the midpoint between two M-lines. The full width at half maximum (FWHM) of SHG profiles is also indicated near each line. 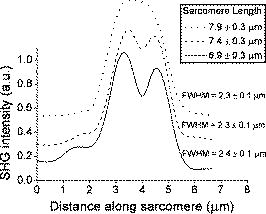 As the sarcomere circled in Fig. 2 is stretched from , the successive change of the SHG profile is demonstrated in Fig. 3 . The minimum between the two peaks clearly vanishes, resulting in the transformation of a double peak to a single peak. After the removal of tension force, the sarcomeres return to their resting length, but some double peaks did not recover immediately, suggesting that some irreversible or slowly recovering changes were imparted on the sample. The reversibility after stretching had large variation and depended on the strength and duration of the applied force. Since the full width at half maximum (FWHM) of the SHG profile does not change significantly, the A-band must elongate less than our error tolerance of , which agrees with previous observations that under nonexcessive stretching the A-band experiences a minimal increase in length.21 The appearance of slightly larger FWHM of the SHG profile for the nonstretched sarcomere could be an artifact due to a small contribution to SHG intensity from a neighboring sarcomere or a bridge between sarcomeres (see the shoulder on the left side of the solid line profile in Fig. 3). By surveying the number of double peaks and single peaks in an SHG image of myocytes, a clear transition from a majority of double peaks to a majority of single peaks is observed with increasing sarcomere length. Figure 4 shows the percent distribution of double, medial, and single peak sarcomeres during gradual stretching of the myocyte. Since the profile change is gradual, a medial peak category is introduced. An anisotropic band is assigned to the medial peak category when the observed dip is less than 10% of the peak intensity, or if a sarcomere has both double and single peak characteristics. By stretching sarcomeres from , the percentage distribution of double peaks decreases from 58 to 0%, whereas the percentage of single peak sarcomeres increases from 15 to 80% (see Fig. 4). The percentage of medial sarcomeres did not vary significantly, reflecting a constant transition from double to single peak characteristic of SHG bands in the applied stretching regime. Fig. 4Percentage distribution of double, medial, and single SHG peak profiles of sarcomeres at different stretching conditions. The sarcomeres are sorted according to their length in six groups, as indicated on the horizontal axis. Shorter sarcomeres had more double (white column) than single (dark gray column) peak profiles, whereas longer sarcomeres had more single than double peak profiles. The medial (light gray) peak profiles represent sarcomeres that are in transition from double to single peak profiles, (see definition of the medial peak profile in text). The numbers at the bottom of each column indicate the occurrences of a particular profile at a corresponding sarcomere length. The average sarcomere length was determined similarly as in Fig. 2.  Furthermore, the transition from a double peak to a single peak profile was accompanied with an increase in SHG intensity. However, due to distortions during stretching, it was difficult to quantify the SHG intensity increase. The observation of varying SHG intensity during stretching provided a lead to investigate the SHG intensity changes during periodic contractions of myocytes. Figure 5a shows the SHG profile along a myofibril that changes in time during rhythmic contractions of a Drosophila melanogaster larva muscle. Video 1 captures the imaged rhythmic contractions, with a period of approximately , and demonstrates the viability of the myocyte despite being imaged continuously for longer than two minutes. Since single SHG frames were used to image contraction dynamics, the dip at the center of the A-band was not resolvable; however, the SHG intensity was more than sufficient to image the A-bands. The corresponding change in average SHG intensity of a periodically contracting sarcomere is shown in Fig. 5b. At labels and in Fig. 5b, the corresponding average sarcomere length is and , respectively, which shows that SHG intensity increases with lengthening of sarcomeres. A clear increasing dependence of SHG intensity with increasing sarcomere length is observed in Fig. 5c. In both cases, forced stretching of sarcomeres and elongation in periodic movements, the SHG intensity increases with the lengthening of sarcomeres. Fig. 5Structural dynamics of a row of sarcomeres during periodic contraction of the myocyte. (a) The SHG intensity profile along the row of sarcomeres is displayed over time. The total SHG intensity, from the same sarcomeres presented in (a), of a row of six sarcomeres over time is presented in (b). The single arrow points to a myofibril profile that has a minimum intensity, whereas the double arrow indicates a maximum intensity location. The average sarcomere lengths at and are indicated in the legend. The average sarcomere length was determined similarly as in Fig. 2. SHG intensity dependence on the sarcomere length obtained for the contracting myocyte is shown in (c). The data were extracted from Video 1.  Video 1A rhythmically contracting myocyte visualized with SHG microscopy. The real-time lapse is indicated in the upper right corner. To achieve the fastest scanning rate, single frames were used for the movie (MPEG, 2.3 MB). Video 1.  4.DiscussionIn this work, we presented the rather surprising result of increasing SHG intensity in the bare zone of the A-band during myocyte stretching. The observation is consistent with previous results of SHG signal intensity increase with lengthening of the sarcomeres in striated myocytes.4, 6 The transition from the double to the single peak of SHG intensity profile of the A-band evolved with the elongation of the sarcomere. The observed phenomena contradicts the intuitive assumption that with stretching, the separation between the two SHG peaks of the A-band would increase, leading to a larger dip in between the two. On inspection of the myosin filament structure, this apparent contradictory observation can be immediately explained by the presence of an antiparallel arrangement of myosin molecules in the central region of the A-band. When two molecules at the same position radiate the second harmonic out of phase, as in the case of molecules in an antiparallel arrangement, then the net radiated power is uniquely zero.8, 22 Since the myosin molecules are staggered and can have complex end-to-end and/or side-by-side antiparallel arrangements [Fig. 1b], complete cancellation of the SHG signal may not occur; consequently, the dip between two peaks of the intensity profile do not reach zero at the minimum separation distance (see schematic representation in Fig. 6 , case 1). However, if these molecules are spatially separated during stretching, favorable phase matching conditions can appear,22 resulting in constructive interference of second harmonic radiated from different myosin molecules. SHG intensity would be maximized when the molecule separation is on the order of the focal beam size (Fig. 6, case 2), and would continue to decrease, due to the exponential decrease in excitation beam intensity away from the center of the focal spot and the removal of molecules from the focal volume of the microscope objective22 (Fig. 6, case 3). When a strong stretching force is applied to the myocyte, the myosin molecules could be separated by a large enough distance so that a double peak in the SHG profile resurfaces. Figure 6 summarizes the SHG intensity profile dependence on the separation distance between myosin molecules. In reality, case 3 is not easily observable, because at higher tensions, rupturing of the muscle was often observed. Myosin filaments showed high rigidity, since the width of the SHG band length varied less than . Consequently, the sensitivity of SHG intensity on the separation between antiparallel arrangements of the myosin molecules is high. The phenomenon could potentially be used as a distance measuring tool with higher accuracy than the diffraction-limited resolution of the microscope.22 Fig. 6Schematic presentation of the correspondence between the SHG profile (lower panel) and the configuration of the myosin molecules at the center of the myosin filaments (upper panel). A low SHG intensity originates from antiparallel myosin molecules in close proximity, consequently, resulting in a noticeable dip in the center of the SHG profile (case 1). As the ends of the myosin rods are separated, on the order of focal spot diameter, the resulting intensity increases to maximum (case 2), which produces a single SHG peak and the highest average intensity. Further separation of myosin molecules causes a reduction in SHG intensity and the return of a double peak (case 3). See text for details on large displacements from the center of the focal spot.  SHG intensity variation with sarcomere length was used for the dynamic investigations of myocytes during contraction. Previously, the intensity decrease during contraction and increase during stretching was observed in the periodically contracting myocytes. The initial interpretation was suggested to be from the change in the amount of semicrystalline order of A-bands during contraction.4 While this interpretation holds, an additional effect influencing the SHG intensity due to separation of the oppositely aligned myosin molecules during stretching has been described in this work. However, it is difficult to distinguish which effect plays the major role in the SHG intensity variation during contraction. A faster scanning microscope and higher signal-to-noise ratio is required to resolve the dynamics of double to single peak transition. This would provide evidence to determine which of the two mechanisms has a larger effect on the SHG intensity from the anisotropic bands of myocytes. The SHG intensity variation during periodic contractions can be applied to the development of diagnostic tools. In dynamic images, where the double peaks are not resolvable due to low photon counts in a single frame and contraction speeds that are faster than microscope scanning, the intensity can be used to determine the contraction state of the myocyte, as shown in Fig. 5b. The intensity relationship of SHG on sarcomere length may have significant implications on monitoring the dynamics of muscle contractions without high resolution imaging for clinical diagnostic purposes. AcknowledgmentsThe research was supported by Natural Science and Engineering Research Council of Canada (NSERC), Canadian Foundation for Innovation (CFI), and Ontario Innovation Trust (OIT). ReferencesP. J. Campagnola,
A. C. Millard,
M. Terasaki,
P. E. Hoppe,
C. J. Malone, and
W. A. Mohler,
“Three-dimensional high-resolution second-harmonic generation imaging of endogenous structural proteins in biological tissues,”
Biophys. J., 82
(1), 493
–508
(2002). 0006-3495 Google Scholar
T. Boulesteix,
E. Beaurepaire,
M. P. Sauviat, and
M. C. Schanne-Klein,
“Second-harmonic microscopy of unstained living cardiac myocytes: measurements of sarcomere length with accuracy,”
Opt. Lett., 29
(17), 2031
–2033
(2004). https://doi.org/10.1364/OL.29.002031 0146-9592 Google Scholar
V. Barzda,
C. Greenhalgh,
J. Aus der Au,
S. Elmore,
J. H. G. M. Van Beek, and
J. Squier,
“Visualization of mitochondria in cardiomyocytes by simultaneous harmonic generation and fluorescence microscopy,”
Opt. Express, 13
(20), 8263
–8276
(2005). https://doi.org/10.1364/OPEX.13.008263 1094-4087 Google Scholar
C. Greenhalgh,
N. Prent,
C. Green,
R. Cisek,
A. Major,
B. Stewart, and
V. Barzda,
“Influence of semicrystalline order on the second-harmonic generation efficiency in the anisotropic bands of myocytes,”
Appl. Opt., 46
(10), 1852
–1859
(2007). https://doi.org/10.1364/AO.46.001852 0003-6935 Google Scholar
S. W. Chu,
S. Y. Chen,
G. W. Chern,
T. H. Tsai,
Y. C. Chen,
B. L. Lin, and
C. K. Sun,
“Studies of x((2))/x((3)) tensors in submicron-scaled bio-tissues by polarization harmonics optical microscopy,”
Biophys. J., 86
(6), 3914
–3922
(2004). https://doi.org/10.1529/biophysj.103.034595 0006-3495 Google Scholar
M. Both,
M. Vogel,
O. Friedrich,
F. von Wegner,
T. Kunsting,
R. H. A. Fink, and
D. Uttenweiler,
“Second harmonic imaging of intrinsic signals in muscle fibers in situ,”
J. Biomed. Opt., 9
(5), 882
–892
(2004). https://doi.org/10.1117/1.1783354 1083-3668 Google Scholar
M. Muller,
J. Squier,
K. R. Wilson, and
G. J. Brakenhoff,
“3D microscopy of transparent objects using third-harmonic generation,”
J. Microsc., 191 266
–274
(1998). https://doi.org/10.1046/j.1365-2818.1998.00399.x 0022-2720 Google Scholar
L. Moreaux,
O. Sandre,
M. Blanchard-Desce, and
J. Mertz,
“Membrane imaging by simultaneous second-harmonic generation and two-photon microscopy,”
Opt. Lett., 25
(5), 320
–322
(2000). https://doi.org/10.1364/OL.25.000320 0146-9592 Google Scholar
C. Greenhalgh,
B. Stewart,
R. Cisek,
N. Prent,
A. Major, and
V. Barzda,
“Dynamic investigation of Drosophila myocytes with second harmonic generations microscopy,”
Proc. SPIE, 6343 634308
(2006). 0277-786X Google Scholar
R. W. Boyd, Nonlinear Optics, Academic Press, San Diego, CA
(2003). Google Scholar
H. E. Huxley,
“Electron microscope studies of the organisation of the filaments in striated muscle,”
Biochim. Biophys. Acta, 12
(3), 387
–400
(1953). 0006-3002 Google Scholar
J. Hanson and
H. E. Huxley,
“Structural basis of the cross-striations in muscle,”
Nature (London), 172
(4377), 530
–532
(1953). 0028-0836 Google Scholar
C. Greenhalgh,
R. Cisek,
B. Stewart, and
V. Barzda,
“Dynamic and structural visualization of muscle structure in Drosophila with multimodal harmonic generation microscopy,”
Biomed. Opt. Top. Mta. OSA Proc.,
(2006) Google Scholar
P. T. Odonnell and
S. I. Bernstein,
“Molecular and ultrastructural defects in a drosophila myosin heavy-chain mutant—differential-effects on muscle function produced by similar thick filament abnormalities,”
J. Cell Biol., 107
(6), 2601
–2612
(1988). 0021-9525 Google Scholar
J. M. Squire,
“Muscle filament structure and muscle-contraction,”
Annu. Rev. Biophys. Bioeng., 4 137
–163
(1975). 0084-6589 Google Scholar
T. Shimizu,
J. E. Dennis,
T. Masaki, and
D. A. Fischman,
“Axial arrangement of the myosin rod in vertebrate thick filaments—immunoelectron microscopy with a monoclonal-antibody to light-meromyosin,”
J. Cell Biol., 101
(3), 1115
–1123
(1985). 0021-9525 Google Scholar
S. W. Chu,
I. H. Chen,
T. M. Liu,
C. K. Sun,
S. P. Lee,
B. L. Lin,
P. C. Cheng,
M. X. Kuo,
D. J. Lin, and
H. L. Liu,
“Nonlinear bio-photonic crystal effects revealed with multimodal nonlinear microscopy,”
J. Microsc., 208
(Pt 3), 190
–200
(2002). https://doi.org/10.1046/j.1365-2818.2002.01081.x 0022-2720 Google Scholar
S. V. Plotnikov,
A. C. Millard,
P. J. Campagnola, and
W. A. Mohler,
“Characterization of the myosin-based source for second-harmonic generation from muscle sarcomeres,”
Biophys. J., 90
(2), 693
–703
(2006). https://doi.org/10.1529/biophysj.105.071555 0006-3495 Google Scholar
A. Major,
R. Cisek, and
V. Barzda,
“Femtosecond Yb: KGd(WO4)(2) laser oscillator pumped by a high power fiber-coupled diode laser module,”
Opt. Express, 14
(25), 12163
–12168
(2006). https://doi.org/10.1364/OE.14.012163 1094-4087 Google Scholar
B. A. Stewart,
H. L. Atwood,
J. J. Renger,
J. Wang, and
C. F. Wu,
“Improved stability of drosophila larval neuromuscular preparations in hemolymph-like physiological solutions,”
J. Comp. Physiol., A, 175
(2), 179
–191
(1994). 0340-7594 Google Scholar
F. Carlsen,
G. G. Knappeis, and
F. Buchthal,
“Ultrastructure of resting and contracted striated muscle fiber at different degrees of stretch,”
J. Biophys. Biochem. Cytol., 11
(1), 95
–117
(1961). Google Scholar
J. Mertz,
“Nonlinear microscopy,”
C. R. Acad. Sci., Ser IV: Phys., Astrophys., 2
(8), 1153
–1160
(2001). 1631-0705 Google Scholar
|


