
|
|
1.IntroductionRecent studies in cancer biology emphasize the importance of detecting and quantifying various types of cells, including rare populations of tumor and endothelial cells, in determining prognosis and response to therapy.1 Great technological progress has been made in isolating circulating tumor cells, as reviewed by Smerage and Hayes.2 Modern available assays include combinations of conventional flow cytometry, immunohistochemistry, immunofluorescent microscopy, immunomagnetic separation,3 PCR, RT-PCR,4 high-throughput optical-imaging systems5 including fiber optic scanning,6 and most recently, microchip technology.7 The last is the only technology capable of isolating viable cells from whole blood without any additional processing or preparation. As a whole, there remain notable deficiencies with the existing assays that enumerate total malignant cells in a single blood sample.8, 9 The first limitation is specificity. While elevated numbers of circulating tumor cells (CTCs) generally are associated with worse prognosis, not all patients with detectable breast cancer cells in blood progress rapidly.10 This result suggests that there are subsets of circulating tumor cells that are more biologically relevant for prognosis and response to therapy. The second limitation is sensitivity. Only approximately 50% of patients with metastatic breast cancer have detectable circulating tumor cells at any given time, even though all eventually have progressive disease. These observations suggest that entry of breast cancer cells into the circulation may be intermittent, so analyses based on a single blood sample may give incorrect information. Deficiencies in existing assays for circulating tumor cells potentially have an even greater impact for patients with early stage primary tumors or after adjuvant therapy due to decreased tumor burden. Collectively, limitations of existing assays emphasize the need to develop new tests with the sensitivity and specificity to detect subsets of circulating tumor cells that are linked more directly to prognosis or response to therapy. To enable in vivo investigations of biologically relevant populations of circulating cells in cancer and other disease processes, we previously developed a novel two-color, two-photon flow cytometer.11 The use of two-photon excitation for in vivo flow cytometry permitted us to simultaneously monitor the circulation dynamics of two distinct populations of breast cancer cells in the same animal in real time.12, 13 Although we were able to enumerate cells labeled with a near-infrared (NIR) fluorescent dye or quantum dots, the system could not as reliably detect dyes with shorter wavelengths, or genetically encoded fluorescent proteins. While in vivo detection of green fluorescent protein (GFP)-labeled cells has been achieved with a confocal geometry,14 the ability to detect such dyes and proteins concurrently with longer wavelengths using a single NIR excitation source greatly expands the capabilities of in vivo flow cytometry. He recently showed the feasibility of labeling CTCs in vivo using fluorescein isothiocyanate (FITC) conjugated to folate and monitoring fluorescent cells with two-photon in vivo flow cytometry.15 They also were able to use a folate-AlexaFluor 488 conjuage to detect CTCs in whole blood from ovarian cancer patients, but not in healthy controls. Collectively, these studies emphasize the potential for in vivo flow cytometry to overcome limitations of current assays for CTCs and advance the use of CTCs as a biomarker in clinical oncology. One very promising approach to successful in vivo measurements is the development of fluorescent probes with a redder emission wavelength closer to the so-called NIR window, where autofluorescence, blood and tissue absorption peaks, and Rayleigh scattering are all significantly reduced. Recently, great strides have been made in this area.16, 17, 18, 19, 20 However, two-color measurements have been demonstrated in flow systems as providing superior quantitative ability over one-color measurements.21 Thus, increased ability to detect short-wavelength fluorescent probes concurrently with long-wavelength ones would further advance molecular imaging. Thermal damage places a strict upper limit on the average power that can be delivered to any biological specimen. Thus, increasing average laser power is not a feasible method for boosting fluorescent signal. At a fixed average laser power, the integrated two-photon fluorescence signal is directly proportional to the repetition period of the laser.22 Thus, a convenient way of increasing two-photon processes is application of an extended cavity laser, which should increase two-photon signal in proportion with cavity length. In the current study, we first demonstrate enhanced two-photon fluorescent signal in flowing dye as well as fluorescent polystyrene microspheres with a home-built extended cavity Ti:Sapphire oscillator relative to a commercial system. While an approximately fourfold increase in fluorescent signal of both flowing dye and polystyrene microspheres is observed, it is noteworthy that square-law scaling is preserved only in the case of the dye solution. Calculated detection of ideal spheres demonstrates that the power variation in the detection region is the cause of sub-square law scaling in the case of beads. Further, we show enhanced sensitivity with the extended cavity laser for detection of MCA-207 mouse sarcoma cells via endogenous expression of GFP (emission maximum ) in both normal saline and whole blood. The commercially available NIR membrane dye DiD ( -dioctadecyl- -tetramethylindodicarbocyanine, 4-chlorobenzenesulfonate, emission maximum 665) is used concurrently to monitor the number of cells interrogated. We also present detailed calculations enabling us to interpret the detection distributions, two-channel signal correlations, and power-sensitivity curves, even under idealized distributions of GFP and DiD. 2.Materials and Methods2.1.Laser SystemA home-built extended cavity laser was constructed, following the design of Cho, 23 incorporating a Ti:Sapphire crystal optically pumped with from a solid-state diode laser (Coherent, Verdi). The cavity utilizes concave mirrors (CM1 and CM2) with a radius of curvature and 99.9% reflectivity for . A fold mirror routes the beam for three round-trip passes between two multipass mirrors, which are concave with radius of curvature and separation. The output coupler is 10% transmissive at . The total path length is . Mode-locking is achieved by selecting for Kerr lensing with an adjustable intracavity slit, and the dispersion is controlled by two fused silica prisms with apex degrees, separated by . The pulse train period is , corresponding to a pulse repetition rate with a center wavelength. The oscillator is first set up for optimum continuous wave (cw) and mode-locked performance without the multipass mirrors [prism separation , length of output coupler arm (from CM1) ]. The multipass mirrors are inserted, and the now-extended cavity is optimized and the prisms are separated slightly more to compensate for the dispersion by air from the additional cavity length. A commercial Ti:Sapphire laser (Coherent Mira), which generates nominally pulses at with a repetition rate of was tuned to for use as the standard for comparison. A flip mirror is used to switch between laser sources. Immediately after the flip mirror, before the cytometry system, 3% of the incident laser light is sent via a beamsplitter to a digital power meter for a reference power reading. The laser sources are characterized both with a spectrometer as well as a commercial SHG-FROG device (Grenouille, SwampOptics) and software (VideoFROG, Mesaphotonics). The extended cavity reliably produces pulses with bandwidth and a 0.48 time-bandwidth product. Typical Mira pulse widths are with bandwidths for a 1.0 time-bandwidth product and show significantly greater time-frequency structure than the extended cavity pulses. 2.2.Two-Photon Flow CytometerThe two-photon flow cytometry apparatus is illustrated in Fig. 1 . A capillary flow system was employed to emulate flow similar to what is encountered in in vivo measurements. Either the home-built extended cavity or the Mira laser beam is focused with a long-working distance objective (Olympus , 30% power transmission at ) into a square capillary with a fused silica wall (WWP100375, Polymicro Technologies) through which the sample flows at a constant rate (usually 0.3 or ) under the force of a syringe pump (KD Scientific). A dichroic mirror ( cutoff, Melles Griot) directs the laser into the microscope objective while transmitting the fluorescence collected through the same objective. A secondary dichroic mirror ( cutoff) and sharp cutoff interference bandpass filters ( for GFP, for DiD, for single-channel FITC or beads experiments) are used to separate the fluorescence from different fluorophores into two channels, which are detected with two distinct photomultiplier tubes (PMT, Hamamatsu HC7421-40) and recorded with two multichannel photon counting scalers (MCS, Stanford Research SR430), which are capable of time resolution as low as and have a sharp cutoff in detection at . The signals (number of photons counted per each bin of sampling interval) are sent to a computer for data analysis. Fig. 1(a) Two-photon flow cytometry setup. LP: cutoff long-pass filter. SP: cutoff short-pass filter. Dichroic mirror cutoffs are and , top to bottom. BP: bandpass filters selected appropriately for the fluorophore of interest (BP1: for FITC or beads, for GFP; BP2: for DiD). (b) Typical CCD images of beads. (c) Blood flowing through the glass capillary. (d) Newton’s rings when the short-pass emission filter is removed. Capillary inner diameter is .  Long-pass filtering of the excitation source ( cutoff) and short-pass filtering of the emission ( cutoff) are employed to minimize noise on the PMT detectors. When the short-pass filter is removed, backscattered laser light enables careful positioning of the objective for an optimal laser focal spot at the center of the capillary. Before each data acquisition, the diffraction pattern scattered off the capillary bottom inner surface is examined out-of-focal plane [Fig. 1d]. This ensures proper alignment of the switch mirror between laser sources to minimize aberrations. The spot size radius at the focus of the two-photon cytometer is determined for each laser by matching a Gaussian to the CCD intensity image of backscattered laser radiation as well as the image of two-photon volume signal from a drop of concentrated Rhodamine dye. 2.3.Peak Analysis AlgorithmA MATLAB program is used to extract fluorescent peaks above the background noise level from the multichannel photon counting scaler trace signals. The particle detection threshold in a channel is set as the maximum photon count per bin from control traces at the same power, plus one photon. This threshold is typically a few photons per bin for unlabeled cells flowing in PBS with laser power (at the objective focus). For a control run equal in length to the data run, this is generally a stricter requirement than just a mean and five or six standard deviations of the control set photon counts. The program scans the trace signals for fluorescent peaks above the detection threshold. Once a peak is located, the peak characteristics, including height (maximum fluorescent signal within the peak), width (FWHM or number of consecutive bins above the background threshold), and location (the index of the maximum bin) are stored. The beginning and end of a peak are determined by crossings of the background threshold value, set as the mean plus a standard deviation of photon counts from the control run at the corresponding power. A double-peak event is treated as a single event if the fluorescent signal between the two peaks does not fall below the background threshold value. Although resolution of up to is achievable on the multichannel scalers, bins are chosen so that all photons from a single cell fall within the duration of a single bin, for maximal signal to noise. For two-channel measurements, the data from each channel are analyzed independently and combined by arrival time. The flow rate of whole blood in the glass capillary is highly variable, which produces a more variable background than the corresponding experiment with cells flowing in PBS. Thus, analysis of whole blood data is performed adaptively in intervals ( of flow for bins). Initially, background mean and standard deviation estimates are calculated from bins with less than half the maximum photon count. Estimated events are then extracted employing background threshold and peak detection threshold value an additional 3 higher. All bins of data outside estimated events are used to calculate the true background mean and true standard deviation . A background threshold value and peak detection threshold of are then used to find the actual events. 2.4.Cell PreparationUntransfected MCA-207 cells and MCA-207 cells stably transfected with GFP were kindly provided by Dr. Kevin McDonough at the University of Michigan. They were labeled with DiD (Invitrogen) according to the manufacturer’s protocol. After labeling, cells were resuspended in PBS or bovine whole blood with heparin (Pel-Freeze Biologicals) for two-photon flow cytometry. Cells resuspended in PBS were used for conventional flow cytometry. 2.5.Conventional Flow CytometryPrior to flow cytometry analysis, stained cells were washed three times in phosphate buffered saline (PBS) containing 0.1% bovine serum albumin (BSA) and resuspended in of washing buffer. The acquisition was performed on a Beckman-Coulter EPICS-XL MCL flow cytometer. Collected data were analyzed using Expo32 software (Beckman-Coulter, Miami, Florida). 2.6.CalculationsSimple geometrical models are used to interpret the signals from the two different laser sources. We calculate the expected fluorescence emission for a cell flowing through the beam focus with different spatial distributions of fluorophore and varying incident laser powers as follows. Let us define a right-handed Cartesian coordinate system with the axial direction of the propagating laser beam and the direction of laminar fluid flow in the capillary. Let be the square intensity of the laser beam at each point in space. We assume that this beam is Gaussian. Figure 2a shows an example of as a function of and at the plane (center of the capillary) for a beam waist radius of ( point). Figure 2b shows surfaces of constant intensity in all three spatial dimensions for the same Gaussian beam. Fig. 2Calculation of expected signals. Here we have defined the right-handed coordinate system with the axial direction of the propagating laser beam and the direction of fluid flow in the capillary. is a variable for the location of the center of the fluorophore-containing object. (a) Magnitude of the beam squared-intensity function in the plane for a beam waist radius of ( point). (b) Various level sets of in three spatial dimensions. (c) Instantaneous signal (arbitrary units) for a infinitesimally thick spherical shell centered at in a Gaussian beam (waist ). (d) Signal (arbitrary units) for a shell centered at as a function of origin, which increases as the object flows in the direction. The net signal is the integral of the curve.  Let be the distribution function of fluorophores in an object centered at the origin. For GFP expressed uniformly throughout a cell centered on the origin, we can approximate as unity within a radius of the origin, zero elsewhere. For DiD, bound to the membrane, is modeled as a thin shell of thickness with outer radius . The object will not, in general, be centered at the origin. Let be a variable for the location of the center of the fluorophore-containing object. Thus, the distribution function of the fluorophore for the object situated in the defined coordinate system is . It follows that the instantaneous net two-photon fluorescent signal from the object centered at is proportional to: Figure 2c shows an example of the spatial distribution of signal from an infinitesimally thin shell situated at in the Gaussian beam (waist ).As an object in the capillary undergoes laminar flow within the coordinate system, its center position will be displaced in the direction, and thus the value increases directly with time. During this period, the signal will change. Figure 2d shows the anticipated instantaneous signal for a shell centered at , as a function of different points of origin, representing flow through the capillary. The double-peak event with broad base emphasizes the reason for choosing an experimental data collection bin width that will include all photons from the passing object. Note that the separation between the peaks will depend on the position of the shell, which defines the position of the object relative to the propagation axis of the laser beam. The total signal obtained from an object flowing through the laser focus is the integral of the instantaneous signal at each traversed position during the period of observation. Thus, we calculate the net observed signal from the object by summing over all the positions that the object traverses as its center translates in the direction during flow: Here, is a constant less than 1, taking into account quantum efficiency, collection efficiency, and any other scaling factors. If the integral is extended over all space (rather than just the capillary volume), then the order of integration can be interchanged, and the integral of over will be independent of . This is a valid assumption since points outside of the capillary do not contribute fluorescent signal. Thus, the integration over and can be separated for and , and this motivates the definition of new functions freed of these variables through integration, and , defined as follows:where the superscript denotes inversion about the origin of spatial argument coordinates to . Note that the prefix refers to an integrated function, not to intensity. For a Gaussian, could be written explicitly in terms of the error function. Thus, the flowed object’s total signal is merely the two-dimensional (2-D) convolution of the -integrated functions and :In practice, extremely thin shells require prohibitively large matrices to calculate to sufficient resolution to avoid numerical digital artifacts. In this event, the calculation can be done by either oversampling the periphery of (near ) or merely recalculating the matrix at a uniform sampling of points from the shell centered about and using the original Eq. 1. The latter calculation is accelerated by assuming a uniform distribution of fluorophore over the thin shell, which removes the product operation in Eq. 1.For each possible origin in the capillary cross section, we calculate the anticipated net signal from the flowing object (Fig. 3 ). Henceforth, “short channel” will refer to the simulated GFP signal from a uniform distribution of fluorophore over a radius sphere, and “long channel” will refer to simulated DiD signal from a uniform distribution of fluorophore over a radius, -thick shell. These assumptions of distributions are made from the known expression of GFP throughout the cytoplasm of the cell and the binding of DiD only to the membrane at the irregular surface of the cell. The beam waist, from the spot-size measurement, is assumed to have a radius of . The signal level is scaled into a photon count by normalization to the brightest single event in the corresponding channel of the two-photon flow cytometry data. The simulated detection threshold can also be taken from the compared two-photon flow data. 3.Results3.1.Dye Solution Signal Enhancement with Extended CavityWe begin by checking the enhancement of the fluorescence signal in a dye solution, and indeed we find the expected approximately fourfold improvement for the extended cavity laser relative to the laser. This enhancement is modestly exceeded in the solution of the biological dye fluorescein isothiocyanate (FITC), flowed through the capillary at [Fig. 4a ]. The fluorescence signal is proportional to the square of the exciting power as expected. Fig. 4(a) Fluorescence emission under extended cavity or Mira laser pulses for a fluorescein-filled capillary, with power-law fits intersecting the axis at 7.6 (extended) or 1.4 (Mira) for a 5.7-fold enhancement. (b) Mean fluorescence of detected yellow-green microspheres with or oscillators, with power-law fits intersecting the axis at 32.7 (extended) or 12.4 (Mira) for a 2.6-fold enhancement. Best-fit power laws are 1.4 and 1.7 when only the brightest 100 events at each power (of ) are selected.  3.2.Fluorescent Bead Signal EnhancementWe next investigate the enhancement of fluorescence in polystyrene beads. We flow a uniform suspension of yellow-green fluorescent spheres (Ex505/Em515) (Molecular Probes). The mean fluorescence of detected events shows significant sub-square law power scaling with both the and the lasers [Fig. 4b]. The difference in best-fit power laws further manifests itself as a less than fourfold fluorescence signal enhancement at low incident laser power. We also confirm that the interaction length is consistent with single bead detection. The mean event duration is five bins (FWHM). At the flow rate in the square capillary, this corresponds to a mean interaction length per bead. Thus, single fluorescent microspheres are resolved by a two-photon detection region with lateral dimensions on the order of a micron. 3.3.Dual-Labeled Fluorescent CellsTo investigate the enhanced ability of the extended cavity laser to detect cells via expressed fluorescent protein, we flow dual-labeled (GFP-expressing and DiD-labeled) MCA-207 cells in PBS and count the number of detected events and mean brightness thereof. The DiD staining serves as a control for the number of cells flowing through the two-photon excitation region. We repeat the experiment in whole bovine blood to mimic the autofluorescent background of a noninvasive in vivo experiment. The number of detected events in PBS and blood are plotted versus average incident laser powers for both sources ( or ) in Fig. 5 . The sensitivity of detection via GFP is determined as the fraction of total events in either channel that are also detected in the short wavelength channel (into which GFP fluoresces). We observe a sigmoidal (s-shaped) curve of detection sensitivity via GFP versus average power in both PBS and blood [Fig. 5c and 5d]. At high power, most cells are detected using either laser source. For maximal detection sensitivity near the detection threshold, this highly nonlinear nature implies a dramatic advantage for modest increases in fluorescent signal at low excitation power. We take as the detection threshold the minimum power where over 50% of the maximum fraction of GFP cells detectable is identified. In PBS, this is for the extended cavity oscillator and for the Mira oscillator. In blood, this value increases to for the extended cavity but remains at for the Mira, and these values are statistically significant (more than a standard deviation separation). Fig. 5The total number of events detected in two channels over six repetitions of a two-photon flow cytometry measurement of dual-labeled MCA-207 cells in (a) PBS or (b) blood at varying powers. Error bars are the standard deviation of these measurements (because summed data over six repetitions is shown). The ratio of total counted events (in either or both channels) giving a detectable GFP signal are shown in (c) PBS and (d) blood.  In all of our two-photon measurements of cells ex vivo in PBS, cell settling remains a complicating factor, limiting each sample to a few minutes at most of run time before recycling or replenishing the syringe pump with cells. The abnormally large count in the DiD channel at the Mira excitation point of Fig. 5a reflects this difficulty in controlling the flow of cells. Settling effects are abated significantly for cells suspended in the viscous whole blood solution. However, in exchange, even under constant force of the syringe pump, the flow rate of blood through the long thin capillary is highly variable, often appearing to stop altogether for brief periods of time. Fortunately, we are able to normalize for this with two detection channels, as has also been the case for in vivo applications.24, 25 That almost all cells passing through the two-photon excitation volume do appear in the DiD channel under all but the smallest excitation powers is corroborated by the data. First, conventional flow cytometry (Fig. 6 ) confirms in excess of 90% labeling efficiency of cells with DiD. Second, in rough calculation, the observed numbers are consistent with very high detection efficiency. The flowed concentration of cells is known to be near 1000 cells per . Assuming a cell diameter of and a two-photon excitation region with axis and axis [e.g., the 0.3 level curve, Fig. 2b], we find that on the order of , or 7% of the total capillary cross-sectional area is interrogated. Therefore, expecting 70 interrogated cells per flowed of fluid and calculating flow volumes on the order of during the sampling period, we can confirm an expectation of about 1400 total events for each data point in Fig. 5. Thus, we assume that the DiD channel accurately represents the number of cells interrogated for almost all data points. Fig. 6Conventional flow cytometry, with the signal in the GFP channel on the ordinate and the DiD channel on the abscissa. (a) MCA-207 cells; (b) GFP-expressing MCA-207 cells; (c) MCA-207 cells labeled with DiD; and (d) dual-labeled MCA-207 cells.  In both blood and PBS, mean brightness of detected events (Fig. 7 ) shows a sub-square law scaling, with lower power-law fit in PBS (1.4) than in blood (1.9). The average brightness of detected GFP events is significantly greater in blood than in PBS, and this difference is statistically significant. In part, this is due to periods of congested flow during which particles dwell in the laser focus for longer periods of time. This congestion also causes a variable background and prevents the use of one standard background measurement to determine thresholds in blood, in contradistinction to PBS. Fig. 7Mean photons per event detected in the GFP and DiD channels for dual-labeled MCA-207 cells in (a) PBS or (b) blood with varying power. Error bars are a single standard deviation of these measurements. Power-law fits are near 1.4 for PBS, 1.9 for blood. The distribution of detected event brightness for the Mira point is shown in (c) for PBS and (d) for blood (combined data of several experiment repetitions). Note the detection thresholds of 5 photons (DiD) and 3 photons (GFP) in PBS, from a background measurement. Detection thresholds of 9 photons (GFP) and 147 photons (DiD) in blood were automatically determined by the processing algorithm, although the control file at the same power never exceeded 15 and 6 photons, respectively.  Representative individual channel histograms of detected event brightness are shown for incident power in Figs. 7c and 7d. In PBS, both individual channel histograms peak at the detection threshold, and the DiD channel has an additional peak (near three hundred photons for average exciting power). In contrast to those in PBS, dual-labeled cells detected in blood exhibit a single broad peak far above the detection threshold. The much higher adaptively determined detection threshold for DiD (147 photons for incident power from the Mira) than GFP (9 photons) occurs despite the significantly lower background in the long channel than the short channel on control blood measurements at the same power. This effect is due to biasing by many extremely bright events of DiD. Simply cutting the PBS histogram at these thresholds and spreading somewhat (due to piecewise data analysis) neatly accounts for the blood histograms; these histograms are asymmetric in the GFP channel to a much greater extent than the DiD channel, which continues to enjoy its peak far above threshold. Conventional flow cytometry confirms approximately two orders of magnitude variation in cell fluorescent brightness (Fig. 6). 3.4.Model CalculationsModeled calculations help interpret unique features in the dual-labeled cell experimental results. In particular, we find that the different geometry of fluorophore distribution can account for the histogram of detected event brightness and explain the sigmoidal shape of number of detected events versus average incident power, as well as the sub-square law scaling of mean brightness. Calculations on a sphere and shell predict, for each possible origin in the capillary cross section, the signal level in the GFP channel [Fig. 3a, sphere] or DiD channel [Fig. 3b, shell]. The calculated distribution of signal in these two channels (Fig. 8 ) essentially maps the area between various level sets of the curves in Fig. 3. For a sphere, there is a large peak in events near the minimum signal level, and a second minor peak at moderately low signals, whereas for a shell, the primary peak is at slightly higher signals than the minimum, and there is a pronounced second peak at higher signals, in reasonable agreement with the experimental results for dual-labeled cells in PBS [Fig. 7c]. This heterogeneity of distributions manifests itself as a lack of correlation between the intensities of both channels on a scatter plot [Fig. 3c], which is confirmed experimentally [Fig. 3d]. Fig. 8Signal intensity distributions extracted for (a) sphere (GFP channel); (b) shell (DiD channel); and (c) scatter plot between the two channels. (d) The scatter plot of GFP versus DiD detected the events in Fig. 7d, under average excitation power from the Mira.  The sigmoidal curve for the fraction of cells detectable via the weak fluorescent protein signal is realized theoretically by assuming a signal that varies with squared laser power from zero to a set maximum and a fixed minimum threshold for detection. For example, by assuming heuristically from experimental results that the Mira can generate up to 1000 photons from a DiD shell but only 100 from a GFP sphere, and also assuming background-determined detection thresholds of 10 and 4 photons, respectively, the curve of circles in Fig. 9a is derived. Assuming fivefold higher signals for extended cavity excitation [from Fig. 4a], but the same detection thresholds, yields the left-shifted curve of crosses in Fig. 9a. In Fig. 9b, an analogous calculation demonstrates that even with a GFP signal precisely as strong as the DiD signal and a single-photon detection threshold, the sigmoidal curve shape of detectability will be preserved for the same geometrical reasons. For no detection thresholds, including one single photon, will 100% of detected events be found in the sphere channel. Effectively, the detectable fraction is the area of the plane in Fig. 3 above a certain finite signal level , which with increasing incident power falls at a lower level relative to the maximum . Nonlinearities are inherited from this signal landscape, leading to the observed subquadratic scaling of the two-photon signal. Fig. 9(a) Simulated fraction of total detectable events identified in the GFP channel for a fixed detection threshold of 4 photons for GFP and 10 photons for DiD, at varying laser powers (signal levels). The maximum signal produced at the highest incident laser power from the Mira is 100 photons for GFP and 1000 photons for DiD (circles), or higher maximum signal strength for the same incident laser power from the extended cavity (crosses). (b) Simulated fraction of total detected events appearing above the threshold in the DiD (circles) or GFP (lines) channel for a 3000-photon maximum achievable signal at highest incident laser power and a fixed detection threshold of 1, 5, 20, or 50 photons.  Figure 10 shows the anticipated GFP sphere (solid line) and DiD shell (open circles) fluorescent signal power-dependence based on the same heuristically determined maximum signals, in excellent qualitative agreement with the observed curves in Figs. 7a and 7b. Detected solid sphere median brightness also shows a strong sub-square law fit as observed in the original fluorescent microsphere experiments [Fig. 4b]. Fig. 10(a) Simulated median brightness of detected GFP spheres (lines) or DiD shells (circles) for Mira or an extended cavity laser source. Calculation parameters are as in Fig. 8. (b) Notice that the best-fit power curve on a log-log scale exhibits a slope of 1.25 (1.29) for spheres with the extended cavity (Mira). 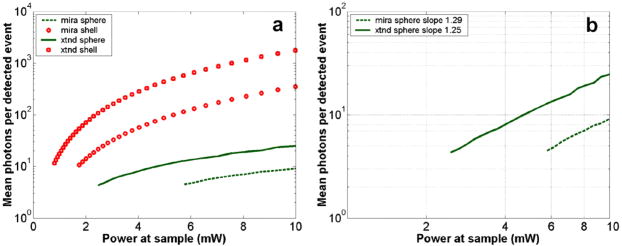 4.DiscussionTraditionally, the major limitation on optical detection methods has been the average power that can be delivered to the sample at focus without damage. The present investigation demonstrates an extended cavity oscillator as a useful modification to enhance fluorescent signal from live biological samples in a two-photon flow cytometer at fixed power. In a simple flowing fluorescent dye solution, the anticipated fourfold signal enhancement by the oscillator relative to a system is met, and anticipated square-law power scaling is followed. However, the signal for flowing fluorescent microspheres obeys a sub-square power law, which can be understood as a geometrical effect (Fig. 9). For increasing excitation intensity, the detectable two-photon excitation region becomes larger, subsuming more dim events [in the cooler-colored regions of Fig. 2b]. It is noteworthy that this effect will be present even without any noise or background, due to the requirement of at least an entire fluorescent photon emission for object detection. Similar geometrical effects, although less pronounced, would similarly affect the power-scaling of the detection signal for any multiphoton or even single-photon fluorescence detection scheme whereby the entire capillary cross-sectional area is not uniformly excited above threshold. For GFP-expressing cell detection, the fraction of all flowed cells (determined with the aid of DiD in the long channel) that can be detected in the short (GFP) channel displays a sigmoidal shape. This curve can be derived heuristically from simple geometrical models (Fig. 9), which also help account for the lack of correlation in signal strength between the two detection channels [Fig. 8c]. The highly nonlinear detection curve results in a critical detection threshold, where even a modest improvement in signal via innovations such as an extended cavity laser can dramatically enhance the sensitivity of the system. GFP-expressing cells were chosen for detection explicitly for this reason: due to their emission in the highly absorbing region of blood, overlapped as well with blood’s autofluorescence, they lie at the threshold of detection for single-cell in vivo measurements. Multiphoton approaches have proven to be very useful for noninvasive microscopy applications.26, 27 Recent work by He 15 also underscores the utility of the multiphoton methodology as well for monitoring CTCs arising spontaneously from a tumor xenograft and labeled in vivo with folate-FITC. Whereas in their study, pulses with average power enabled detection of Rhodamine (DiI) tags in vivo,15 shorter pulses can successfully detect circulating cells in vivo at average powers below .12 It should also be noted that NIR ultrashort laser pulse damage behavior to cells has empirically been observed to obey a dependence, where is average power, and is pulse duration, pointing to a two-photon damage process.28 Damage induced by the defocused beam outside of the interrogation region remains a matter of speculation. However, studies of the viability of embryos through two-photon microscopy, but not confocal, have indicated likely confinement of damage to the interrogated region in any nonlinear microscopy system.29 The significantly improved sensitivity of the two-photon flow cytometer with the extended cavity oscillator laser excitation source could open new avenues of biomedical investigation. Enhanced ability to detect GFP in whole blood will further empower cancer metastasis investigations in mouse tumor models. Enhanced sensitivity to shorter wavelength dyes will also assist the ultimate goal of noninvasive in vivo human monitoring. AcknowledgmentsThis project has been funded in whole or in part with federal funds from the NASA Ames Research Center, National Aeronautics and Space Administration, under Contract No. NAS2-02069. Funding also is provided by the Susan Komen Foundation, Sidney Kimmel Foundation, JTM Research, and NIH P50 CA93990. E.T. was supported by an NSF Graduate Research Fellowship. ReferencesS. Meng,
D. Tripathy,
E. P. Frenkel,
S. Shete,
E. Z. Naftalis,
J. F. Huth,
P. D. Beitsch,
M. Leitch,
S. Hoover,
D. Euhus,
B. Haley,
L. Morrison,
T. P. Fleming,
D. Herlyn,
L. W. Terstappen,
T. Fehm,
T. F. Tucker,
N. Lane,
J. Wang, and
J. W. Uhr,
“Circulating tumor cells in patients with breast cancer dormancy,”
Clin. Cancer Res., 10 8152
–8162
(2004). 1078-0432 Google Scholar
J. B. Smerage and
D. F. Hayes,
“The measurement and therapeutic implications of circulating tumour cells in breast cancer,”
Br. J. Cancer, 94 8
–12
(2006). 0007-0920 Google Scholar
L. W. Terstappen,
“Flow cytometry—principles and feasibility in transfusion medicine. Enumeration of epithelial derived tumor cells in peripheral blood,”
Vox Sang., 74 269
–274
(1998). 0042-9007 Google Scholar
V. Ziegelschmid,
C. Hollman, and
O. Bocher,
“Detection of disseminated tumor cells in peripheral blood,”
Crit. Rev. Clin. Lab Sci., 42 155
–196
(2005). 1040-8363 Google Scholar
S. Kraeft,
“Reliable and sensitive identification of occult tumor cells using the improved rare event imaging system,”
Clin. Cancer Res., 10 3020
–3028
(2004). 1078-0432 Google Scholar
R. T. Krivacic,
“A rare-cell detector for cancer,”
Proc. Natl. Acad. Sci. U.S.A., 101 10501
–10504
(2004). https://doi.org/10.1073/pnas.0404036101 0027-8424 Google Scholar
S. Nagrath,
“Isolation of rare circulating tumour cells in cancer patients by microchip technology,”
Nature (London), 450 1235
–1239
(2007). 0028-0836 Google Scholar
A. G. J. Tibbe,
M. C. Miller, and
L. W. M. M. Terstappen,
“Statistical considerations for enumeration of circulating tumor cells,”
Cytometry A, 71 154
–162
(2007). Google Scholar
G. Vona,
A. Sabile,
M. Louha,
V. Sitruk,
S. Romana,
K. Schütze,
F. Capron,
D. Franco,
M. Pazzagli,
M. Vekemans,
B. Lacour,
C. Brechot, and
P. Paterlini-Brechot,
“Isolation by size of epithelial tumor cells: a new method for the immunomorphological and molecular characterization of circulating tumor cells,”
Am. J. Pathol., 156 57
–63
(2000). 0002-9440 Google Scholar
M. Cristofanilli,
G. T. Budd,
M. J. Ellis,
A. Stopeck,
J. Matera,
M. C. Miller,
J. M. Reuben,
G. V. Doyle,
W. J. Allard,
L. W. Terstappen, and
D. F. Hayes,
“Circulating tumor cells, disease progression, and survival in metastatic breast cancer,”
N. Engl. J. Med., 351 781
–791
(2004). 0028-4793 Google Scholar
C. F. Zhong,
J. Y. Ye,
A. Myc,
T. P. Thomas,
A. U. Bielinska, J. R. Baker Jr., T. B. Norris,
“Two-photon flow cytometry,”
Proc. SPIE, 5700 78
–89
(2005). https://doi.org/10.1117/12.589620 0277-786X Google Scholar
E. R. Tkaczyk,
C. F. Zhong,
J. Y. Ye,
S. Katnik,
A. Myc,
K. E. Luker,
G. D. Luker, J. R. Baker Jr., T. B. Norris,
“Two-photon, two-color in vivo flow cytometry to noninvasively monitor multiple circulating cell lines,”
Proc. SPIE, 6631 66310T
(2007). https://doi.org/10.1117/12.729490 0277-786X Google Scholar
E. R. Tkaczyk,
C. F. Zhong,
J. Y. Ye,
A. Myc,
T. Thomas,
Z. Cao,
R. Duran-Struuck,
K. E. Luker,
G. D. Luker,
T. B. Norris, J. R. Baker Jr.,
“In vivo monitoring of multiple circulating cell populations using two-photon flow cytometry,”
Opt. Commun., 281 888
–894
(2008). https://doi.org/10.1016/j.optcom.2007.10.106 0030-4018 Google Scholar
S. Boutrus,
C. Greiner,
D. Hwu,
M. Chan,
C. Kuperwasser,
C. Lin, and
I. Georgakoudi,
“Portable two-color in vivo flow cytometer for real-time detection of fluorescently labeled circulating cells,”
J. Biomed. Opt., 12 020507
(2007). https://doi.org/10.1117/1.2722733 1083-3668 Google Scholar
W. He,
H. Wang,
L. Hartmann,
J. Cheng, and
P. Low,
“In vivo quantitation of rare circulating tumor cells by multiphoton intravital flow cytometry,”
Proc. Natl. Acad. Sci. U.S.A., 104 11760
–11765
(2007). https://doi.org/10.1073/pnas.0703875104 0027-8424 Google Scholar
L. Wang,
W. C. Jackson,
P. A. Steinbach, and
R. Y. Tsien,
“Evolution of new nonantibody proteins via iterative somatic hypermutation,”
Proc. Natl. Acad. Sci. U.S.A., 101 16745
–16749
(2004). https://doi.org/10.1073/pnas.0407752101 0027-8424 Google Scholar
N. Shaner,
R. E. Campbell,
P. A. Steinbach,
B. N. G. Giepmans,
A. E. Palmer, and
R. Y. Tsien,
“Improved monomeric red, orange and yellow fluorescent proteins derived from Discosoma sp. red fluorescent protein,”
Nat. Biotechnol., 22 1567
–1572
(2004). https://doi.org/10.1038/nbt1037 1087-0156 Google Scholar
N. Shaner,
P. A. Steinbach, and
R. Y. Tsien,
“A guide to choosing fluorescent proteins,”
Nat. Methods, 2 904
–909
(2005). 1548-7091 Google Scholar
T. Kogure,
S. Karasawa,
T. Araki,
K. Saito,
M. Kinjo, and
A. Miyawaki,
“A fluorescent variant of a protein from the stony coral Montipora facilitates dual-color single-laser fluorescence cross-correlation spectroscopy,”
Nat. Biotechnol., 24 577
–581
(2006). https://doi.org/10.1038/nbt1207 1087-0156 Google Scholar
D. Shcherbo,
E. M. M. Merzlyak,
T. V. V. Chepurnykh,
A. F. F. Fradkov,
G. V. V. Ermakova,
E. A. A. Solovieva,
K. A. A. Lukyanov,
E. A. A. Bogdanova,
A. G. G. Zaraisky,
S. Lukyanov, and
D. M. M. Chudakov,
“Bright far-red fluorescent protein for whole-body imaging,”
Nat. Methods, 4 741
–746
(2007). 1548-7091 Google Scholar
C. F. Zhong,
E. R. Tkaczyk,
T. Thomas,
J. Y. Ye,
A. Myc,
A. U. Bielinska,
Z. Cao,
I. Majoros,
B. Keszler, J. R. Baker Jr., T. B. Norris,
“Quantitative two-photon flow cytometry—in vitro and in vivo,”
J. Biomed. Opt., 13 034008
(2008). https://doi.org/10.1117/1.2931077 1083-3668 Google Scholar
M. T. Myaing,
J. Urayama,
A. Braun, and
T. B. Norris,
“Nonlinear propagation of negatively chirped pulses: maximizing the peak intensity at the output of a fiber probe,”
Opt. Express, 7 210
(2000). 1094-4087 Google Scholar
S. H. Cho,
B. E. Bouma,
E. P. Ippen, and
J. G. Fujimoto,
“Low-repetition-rate high-peak-power Kerr-lens mode-locked laser with a multiple-pass cavity,”
Opt. Lett., 24 417
–419
(1999). 0146-9592 Google Scholar
C. F. Zhong,
E. R. Tkaczyk,
J. Y. Ye,
A. Myc,
T. Thomas,
Z. Cao,
R. Duran-Struuck,
K. E. Luker,
G. D. Luker,
T. B. Norris, J. R. Baker Jr.,
“In vivo Monitoring of two circulating cell lines using two-color two-photon cytometry,”
(2006) Google Scholar
E. R. Tkaczyk,
J. Y. Ye,
S. Katnik,
A. Myc,
K. E. Luker,
G. D. Luker, J. R. Baker Jr., T. B. Norris,
“Enhanced two-photon in vivo flow cytometry with an extendeed cavity laser,”
(2007) Google Scholar
W. R. Zipfel,
R. M. Williams, and
W. W. Webb,
“Nonlinear magic: multiphoton microscopy in the biosciences,”
Nat. Biotechnol., 21 1369
–1377
(2003). https://doi.org/10.1038/nbt899 1087-0156 Google Scholar
K. König,
“Multiphoton microscopy in life sciences,”
J. Microsc., 200 83
–104
(2000). https://doi.org/10.1046/j.1365-2818.2000.00738.x 0022-2720 Google Scholar
K. König,
T. W. Becker,
P. Fischer,
I. Riemann, and
K. J. Halbhuber,
“Pulse-length dependence of cellular response to intense near-infrared laser pulses in multiphoton microscopes,”
Opt. Lett., 24 113
–115
(1999). 0146-9592 Google Scholar
J. M. Squirrell,
D. L. Wokosin,
J. G. White, and
B. D. Bavister,
“Long-term two-photon fluorescence imaging of mammalian embryos without compromising viability,”
Nat. Biotechnol., 17 763
–767
(1999). https://doi.org/10.1038/11698 1087-0156 Google Scholar
|


