|
|
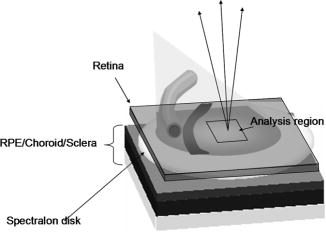
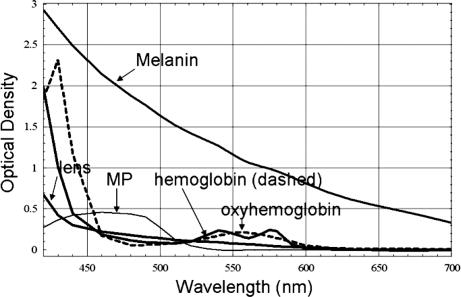
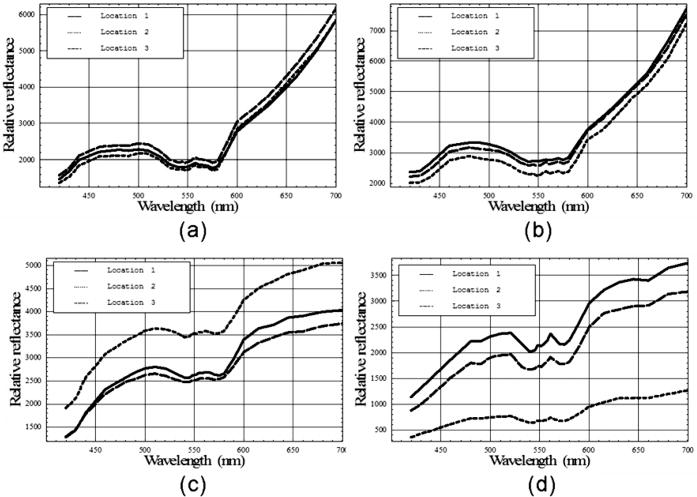
1.IntroductionClinical diagnosis of ocular disease by observation of the ocular fundus began with the invention of the ophthalmoscope in 1851.1 Introduction of spectrometric analysis of the ocular fundus provided a means of quantitatively recording the appearance of the fundus, leading to in vivo reflectometry being used to describe the physiological state of the fundus and to observe pathologic processes.2, 3, 4 Different investigators have used fundus reflectometry to measure the concentrations of ocular pigments such as melanin, xanthophylls, and hemoglobin in the retinal pigment epithelium, choroid, and retina.5, 6, 7, 8, 9 Detailed characterization of fundus reflectance is important for techniques such as fundus photography, photocoagulation, fluorescein angiography and retinal oximetry. Several techniques have been developed to measure the reflectance of the fundus. 5, 6, 7, 9, 10, 11, 12, 13, 14, 15, 16, 17, 18 Van Norren and Vos9 and Van Norren and Tiemeijer11 measured the reflectance from the foveal and peripheral fundus and mathematically modeled the fundus. Their reflectance model was based on the Lambert-Beer law and used two reflective and four absorbing layers to describe the fundus. Their model provided stable results, but did not include a model for scattering effects. Delori and Pflibsen5 performed in vivo spectral reflectance measurements on human subjects with a wide range of fundus pigmentation and applied the model of van Norren and Tiemeijer.11 Delori and Pflibsen5 also developed an alternate, more complex model that consisted of a scleral reflector, an absorbing-scattering layer meant to simulate the choroid, a blood layer, a melanin layer for the retinal pigment epithelium, and a spectrally flat reflector. They applied the equations of Kubelka and Munk to their data and achieved a better fit to measured spectra.5 Kubelka and Munk introduced a two-constant theory for the description of the reflectance properties of a material: the absorption coefficient and the scattering coefficient.19 Delori’s adaptation of the model of Kubelka and Munk treats the choroid as a diffuse absorbing scatterer backed by a reflecting sclera.5 Knighton and coworkers20 measured the specular reflections from the inner limiting membrane of the retina of monkeys. Hammer 6, 12 performed high spectral resolution studies with an imaging spectroscopy at high spatial resolution along a bar-shaped field on the retina. Hammer and Schweitzer6 developed a four-layer model to describe the reflectance of the ocular fundus: (1) the retina containing macular pigment in the foveal region, (2) the retinal pigment epithelium (RPE) pigmented with melanin, (3) the choroid containing blood and melanin, and (4) the sclera. The approach used for this model was the adding-doubling method as an approximate solution of the radiation transport equation for the reflectance. These previous methods to measure the fundus reflectance used extraocular illumination: the illumination came from outside of the eye. In most cases, the resulting fundus reflectance measurements included contributions of varying degrees from extraneous reflections from the anterior portion of the eye. Though the various layers of the retina were separated in the models used in these earlier works, no attempt was made to separate the reflectance of the layers of the retina empirically. In this study, intravitreal illumination was used on a live swine eye with a super retinal or subretinal Spectralon (Labsphere, North Sutten, New Hampshire) disk to obtain in vivo fundus spectral reflectance measurements and sensory retina transmittance measurements. Intravitreal illumination is commonly used during retinal surgeries. Intravitreal illumination eliminated the influence of extraneous reflections from the cornea, lens, and vitreous to the reflectance measurements. To the authors’ knowledge, this is the first known in vivo measurement of the isolated retinal reflectance. 2.Experimental MethodsIntravitreal surgery was performed on a -old female American Yorkshire domestic swine. The experimental protocol was approved by the University of Arizona Institutional Animal Care and Use Committee. 2.1.Surgical Procedure/Animal PreparationThe swine was administered a general anesthesia mixture consisting of air, nitrogen, oxygen, and isofluorane. A Swan-Ganz catheter was placed in the aorta just distal to the heart, and the second catheter was placed in the inferior vena cava just proximal to the heart. Blood samples collected from the two Swan-Ganz catheters were analyzed with an ISTAT Personal Clinical Analyzer (Heska Corporation, Fribourg, Switzerland) to monitor systemic arterial oxygen saturation and mixed venous oxygen saturation . The , , , pH, and hematocrit were measured from the small blood samples. A peripheral oxygen saturation monitor was also placed in the rectum of the swine. A lid speculum was placed in the operative eye. The swine was inspired with 100% oxygen throughout the data collection. A infusion cannulum was placed through the pars plana and sutured in place. The infusion cannulum was attached to a balanced salt solution gravity feed system to maintain intraocular pressure. A contact vitrectomy lens (F36202.08, Bausch & Lomb, Rochester, New York) was placed onto the cornea using an index matching (refractive index: ) viscoelastic coupling agent. 2.2.Fundus Imaging Apparatus and Data CollectionFollowing the surgical preparation of the animal, light from a scanning monochromator (Oriel Spectral Luminator, Irvine, California) was coupled into a fiber optic intravitreal illuminator (Alcon Laboratories, Fort Worth, Texas) that was inserted through the pars plana into the vitreous to illuminate the retina. The spectral resolution of the monochromator was approximately . A scientific grade charge-coupled device (CCD) camera (Hamamatsu Orca-AG, Hamamatsu, Japan) with a macro zoom lens was used to image the fundus. The peak wavelength of the wavelength band was stepped from , and an image of the target area was acquired at illumination center wavelengths of 420, 430, 440, 460, 480, 490, 500, 510, 521, 532, 540, 545, 548, 552, 555, 558, 561, 565, 570, 575, 580, 590, 600, 615, 630, 645, 660, 680, and . Each camera exposure was triggered using a cardiac monitor (Digicare Life Windows, Boynton Beach, Florida) to minimize fundus thickness variations by acquiring all images at the same point during the cardiac cycle; retinal vessel diameter variations can range from 2% to 17% due to the cardiac cycle.21, 22, 23 Additionally, the exposure time was adjusted to less than (approximately of the cardiac cycle) so the retinal blood vessel size should not vary appreciably during the exposure. The optical system is illustrated in Fig. 1 . Multispectral image sets were obtained over a region of the illuminated fundus of the intact eye. A dark image (obtained with the illuminator shutter closed) was subtracted from each image upon acquisition to correct for dark current and external light sources. The reflected light was collected over a solid angle of 0.028 sr, the solid angle subtended by the eye’s pupil, which is the aperture stop of this system. After obtaining the spectral image set for the intact eye, the vitreous cutter was placed in the eye and a complete pars plana vitrectomy was performed. After the postvitrectomy data was collected, a scleratomy was created to allow the insertion of a small disk of Spectralon. The Spectralon was placed on top of the fundus area previously imaged and spectral images were obtained. A retinal detachment was induced near the site of the postvitrectomy measurements and the Spectralon disk was inserted underneath the retina and the transmittance of the isolated retina was measured for the same field of view. Figure 2 shows a drawing of the placement of the subretinal Spectralon chip. 2.3.Data Calibration and Image AlignmentA calibration data set was collected by measuring the output port of an integrating sphere illuminated with the fiber optic illuminator. The multispectral images were corrected for spectral variation in the light source and the spectral response of the CCD by dividing by the calibration spectrum. The inner wall of the integrating sphere is coated with Spectralon, which has a very uniform spectral reflectivity and is commonly used as a calibration standard.24 The fundus multispectral image sets were registered to correct for any relative motion between the swine fundus and the imaging camera that occurred during data collection. Images were aligned to within a fraction of a pixel using a bicubic spline interpolation in conjunction with a maximum mutual information merit function algorithm.25 2.4.Image Processing and Data Analysis TechniquesThree sites relatively free of large vessels were chosen for analysis of fundus reflectance as indicated by the squares in Fig. 3 . Multispectral image sets were acquired for the following four experimental conditions: (1) from the intact eye, (2) from the eye postvitrectomy, (3) after insertion of subretinal Spectralon, and (4) for super-retinal Spectralon. The spectrum was calculated for each condition by averaging the flux over a small region of the fundus shown in Fig. 3 for each of the 29 monochromatic images. Fig. 3The image for each of the 4 experimental conditions is shown. Reflectance spectra were averaged over each of the squares. 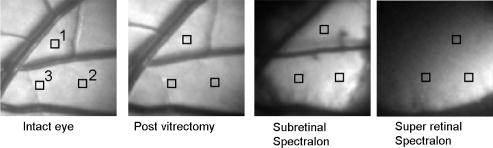 The signal recorded by the CCD camera is a product of the spectral irradiance of the light source, the spectral response of the imaging system, and the spectral transmittance or reflectance of any structures that may interact with the light captured by the imaging system. This relationship is expressed in equation form for each of the four experimental conditions described in the previous paragraph (denoted , , , and , the signal recorded for experimental conditions 1 through 4, respectively) as follows: is a multiplicative term describing the spectral irradiance distribution of the illumination and the spectral response of the imaging system. refers to the four absolute irradiance constants , , , and . is measured during calibration and provides the relative spectral irradiance of the light illuminating a particular region of the fundus for each experimental condition. Light exits the fiber optic illuminator with a numerical aperture of 0.655 in the vitreous; thus this parameter is different for each spatial position in a spectral image set. was not directly measured; the calibration process only measures , the relative spectral power distribution. was calculated for each of the experimental conditions, and the results are included in the paper. The remaining terms are defined as follows: is the fundus reflectance, is the fundus reflectance after vitrectomy, is the transmittance of the sensory retina in double pass, is the reflectance of the Spectralon disk, and is the reflectance of the fundus not shadowed by the Spectralon chip. Values for were obtained from van de Kraats 26 The Lambertian reflectance of the Spectralon chip is constant with wavelength: is equal to 0.91 for a thick piece of Spectralon.272.4.1.Low pass filtering and light/fundus relative motion correctionDespite attempts to immobilize the swine’s head during data collection, small relative motion between the illumination beam and the fundus occurred as a result of the swine’s breathing. This motion is in addition to the relative motion between the fundus and the camera, which was corrected for using the maximization of the mutual information as described in Sec. 2.3. Low pass filtered images (Fig. 4 ) reveal the relative motion between the illumination and the swine fundus; although the physical structures of the fundus were aligned for all the spectral images, the location of the peak illumination region varied among the spectral images. Figure 4 shows four low pass filtered images (420, 523, 560, and ) obtained for the intact eye. Fig. 4Four low pass filtered images of the intact eye. The small cross on each image marks the location of the maximum intensity, corresponding to the axis of the fiber optic illuminator, or the peak intensity of the incident cone of light. The location of the maximum intensity moves as the swine breathes.  To analyze the motion of the illuminating beam, frequency domain filtering with a Gaussian low pass filter was performed on each of the monochromatic images. The filter, , is a Gaussian low pass filter with a spatial domain kernel size of for a image (full width at half ), Given the Fourier transform of the image the low pass filtered image, ),provides the centroid of the illumination as shown in Fig. 4. Figure 5 shows the frequency [Fig. 5a] and spatial domain [Fig. 5b] representation of the filter .The beam centroid motion as a function of illumination wavelength is determined from the filtered images. This small relative motion causes irradiance fluctuations leading to errors in the measured spectrum. An algorithm was developed to correct for the motion of the illuminating irradiance: (1) for the filtered reference image (the image), the ratio between the maximum of the image and the value at the analysis site is calculated; (2) the corresponding ratios are determined for all the filtered images in the spectral image set; and (3) a correction factor, , is applied to the reflectance measured at the illumination site for each spectral image. The assumption is that the illumination profile does not change appreciably over the visible spectrum. Figure 6 illustrates the motion correction for one of the reflectance curves. 2.4.2.Relative spectral fundus reflectanceUsing Eqs. 1, 2, 3, 4, the relative fundus reflectance can be estimated to within the multiplicative constant for the four experimental conditions (relative spectral values denoted by script symbols): 2.4.3.Power compensation: estimation of absolute reflectanceThe constant term in Eqs. 1, 2, 3, 4 was calculated to provide the absolute fundus reflectance and sensory retina transmittance. A calculation of is described for the intact eye; the other three conditions were similarly analyzed. By taking the logarithm of Eq. 1, a set of linear equations for all is formed where all known terms are grouped on the left-hand side and is the transmittance of the ocular media. An appropriate model of provides an overdetermined set of linear equations used to solve for . , , and are similarly modeled and the resulting linear equations solved for . A fundus reflectance model, Eq. 13, is used to model the measured quantity for all four experimental conditions based on the assumption that a finite number of reflecting, transmitting, and absorbing layers with known spectral extinction coefficients shape the spectral profile of light reflecting from the fundus. The primary ocular constituents that contribute to the spectrum are the ocular media (lens, cornea), hemoglobin, and melanin, although several other absorbers in smaller concentrations are likely to be present.5, 26 The reflectance model iswhere is the transmittance of the ocular media, is absorption due to blood (and is dependent on the oxygen saturation), is absorption due to melanin, and is the absorption due to macular pigments. Figure 7 illustrates the absorption curves.Examination of Fig. 7 shows that for the wavelength range of , the only components with substantial absorption are melanin and blood. Using the fundus reflectance model in the aforementioned wavelength range, Eq. 12 can then be rewritten to include the fundus reflectance model as where represents the left-hand side of Eq. 12. The optical density due to blood is (the “̂” symbol denotes base 10 logarithm) and is described by the product of the millimolar extinction coefficient , the concentration of hemoglobin , and the effective interaction path length . The oxygen saturation of the blood in each of the four cases was calculated using the method described by Denninghoff 28 to be 85%, 52%, 92%, and 92% for the four cases and the corresponding millimolar extinction coefficients were used in Eq. 14. is the optical density due to melanin (found mainly in the RPE), which is a product of , the millimolar extinction coefficient and the relative concentration of melanin . Writing Eq. 14 for the illumination wavelengths from provides a set of overdetermined linear equations that was solved using the pseudo-inverse technique to provide the least-squares solution for .3.Experimental ResultsRelative and absolute fundus reflectance spectra are presented in this section for the three analysis sites indicated in Fig. 3. 3.1.Diffuse Relative Reflectance MeasurementsFigure 8 shows the measured relative fundus reflectance for the four experimental conditions. Figures 8a and 8b show similar behavior for the intact eye and the postvitrectomy data: reflectance is lowest in the blue light and increases until for the intact eye and for postvitrectomy. Oxyhemoglobin is evident by the appearance of bimodal local minima at 542 and ; these minima correspond to the absorption maxima of oxyhemoglobin. The reflectance increases by a factor of approximately 6 for all three curves in each plot in the range, and by a factor of approximately 2 for the range. Figures 8c and 8d show markedly different behavior, although some similarities exist. For both the sub- and super-retinal Spectralon, a local maximum exists at , and again, the oxyhemoglobin absorption spectrum is evident. The reflectance in this case, however, increases by a factor of approximately 4 in the range, and a factor of approximately 1.75 in the range. 3.2.Absolute Diffuse Relative Reflectance MeasurementsUsing the technique described in Sec. 2, the relative reflectance data was converted to absolute reflectance by solving for the coefficients from Eqs. 8 to 11. The results for the reflectance curves measured at the three analysis sites are included in Table 1 , and the power corrected curves are shown in Fig. 9 . Fig. 9Absolute reflectance measurements at the three analysis locations [(a) to (c)] after correction for motion and power of the illuminating beam. In each plot, the separate curves correspond to the four experimental conditions. The super-retinal spectrum contains two components: (1) light that reflects from the Spectralon and (2) light that has also scattered from the globe and into the imaging system. The latter contribution contains a strong hemoglobin signature.  Table 1Amounts of hemoglobin and melanin absorption and the Pi parameter for the four conditions and three locations. The c*d product gives a measure of the amount of blood at a test site, the Y term indicates the amount of melanin, and the Pi parameter is proportional to the incident flux at each analysis site.
The relative melanin values calculated for the intact eye and the postvitrectomy eye are much larger than the corresponding Spectralon values for all three locations in the data. This behavior is to be expected: The light striking both the subretinal and super-retinal Spectralon should see only a small fraction of the melanin encountered for the first two conditions. In fact, the only optical path for melanin absorption in the super-retinal Spectralon data is scattered light from the globe. The values obtained for the oxyhemoglobin products correspond to a blood thickness interaction of . The absolute reflectance data shown in Fig. 9 is arranged such that the stacked plots in the left-hand column display the data from the three analysis sites. For all three locations, the reflectance for the first two cases is similar (intact eye and postvitrectomy), with the primary difference between the two curves being a difference in oxygen saturation (measured at 85% and 52%, respectively). The reflectance is approximately 17% at , rises to local maxima of approximately 25% at 497 and for the intact eye and postvitrectomy eye, respectively. From there, both curves decrease to bimodal local minima at 542 and , and then increase monotonically from a value of at to at . The Fig. 9 plots for subretinal Spectralon show more variation, ranging from a reflectance of to 25% at . Above this wavelength, the reflectance increases to a local maximum of to 62% at . The characteristic bimodal maxima are located at 542 and . The reflectance again increases from the range by 55% to 62% for to 75% to 80% for . The super-retinal Spectralon spectrum contains considerably more noise than the other spectra, possibly due to less exposure time in response to high reflectivity. The super-retinal Spectralon should be the highest recorded reflectance spectra in all three cases of Fig. 9, but in Fig. 9b was corrected to a value lower than that of the subretinal Spectralon data. This is likely due to the failure of our power fluctuation compensation method to completely match the power in the region and noise combined with the very high transmission of the sensory retina. In most cases [Figs. 9a, 9b, 9c], however, the super-retinal Spectralon had a higher reflectance than the subretinal Spectralon. The transmittance of the sensory retina in a single pass can be obtained by taking the square root of the subretinal Spectralon data in Fig. 9, which were acquired in double passes. Figure 10 represents the transmittance of the sensory retina averaged over all three locations based on the power-corrected Eq. 10. The spectrum overestimates the influence of both melanin and hemoglobin due to scattered light from the globe. Equation 11 was used to calibrate for this scattered light term. The super-retinal spectrum calibrates the transmission through the anterior chamber and the scattered light from the globe itself. The latter component contains a significant hemoglobin signature. By dividing Eq. 10 by Eq. 11, the scatter corrected in vivo transmittance of the sensory retina is obtained (Fig. 11 ), Fig. 10Single pass transmittance of the sensory retina, averaged over the three locations measured from the subretinal Spectralon. The illumination component from light scattered from the globe acquired a strong hemoglobin signature, which overestimated the amount of blood contained in the sensory transmittance. 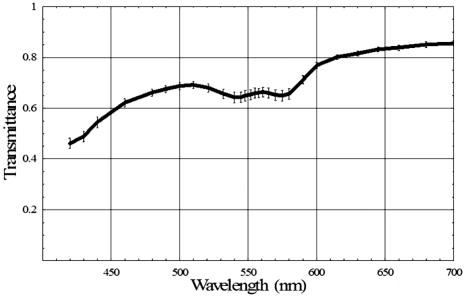 Fig. 11Single pass transmittance of the sensory retina, averaged over the three locations measured from the subretinal Spectralon data and corrected for the influence of scattered light using the super-retinal data.  Figure 12 displays the expected transmittance of the sensory retina, which is nearly flat across the visible spectrum with an absolute transmittance for all wavelengths. 4.DiscussionIn our experimental design, we carefully matched the power delivery and detection systems so that the power delivered and detected at any given wavelength was normalized to all the others. This allowed us to use a simplified model equation that did not directly account for wavelength-dependent scattering as long as the power determinations were accurate for a reasonable region of the spectra. Because the model we used allowed us to fit the same area of the visible spectrum (the red region) in all of our experimental conditions, we were satisfied that we could use the results to normalize power as described. The absorption of the components of the retina and the scattering of the structures of the retina are nearly constant in the red wavelengths, making our assumptions required for the model fit valid in this region. The behavior of light in the blue-green wavelength range was unexpected. The reflectance is much larger in the blue-green spectrum than can be explained based on the ocular absorbers modeled here, as was indicated in Fig. 13 where the logarithm of the reflectance is shown superposed with the calculated reflectance determined using the relative contributions of melanin and hemoglobin. The fit is very good for wavelengths longer than , but the reflectance is much larger than predicted in the blue-green region. One way to explain this discrepancy is to hypothesize a component of the retina anterior to the RPE that reflects more light as the wavelength decreases below . Changes in scattering with wavelength and the resulting change in relative pathlength are also possible explanations for the mismatch between our model and the observed spectrum in the blue-green region. Because the discrepancy is much larger in the intact and postvitrectomy eye, these reflections must be occurring posterior to the sensory retina. We can only support this interesting finding with data from one animal eye; further research is required prior to any significant conclusions about the swine fundus reflectance in the blue-green region. Fig. 13Measured reflectance versus the predicted reflectance based on Eq. 12 for (a) the intact eye, (b) the postvitrectomy eye, (c) the subretinal Spectralon, (d) and the super-retinal Spectralon. These spectra suggest the presence of a blue-green reflector in the retina above the RPE. 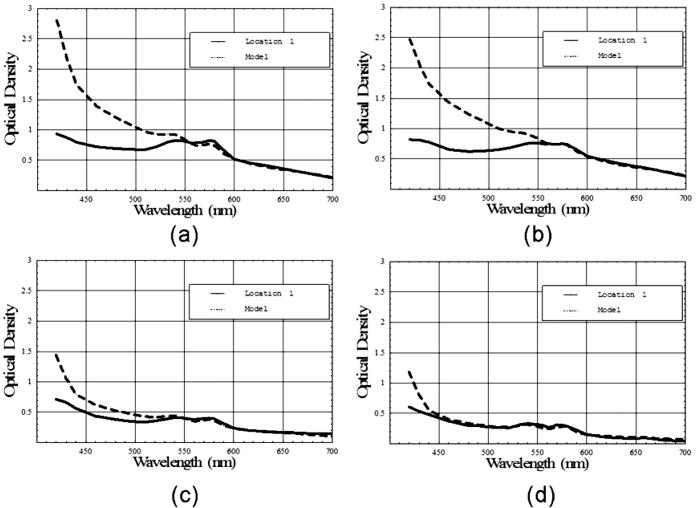 Our goal was to measure the reflectance of the sensory retina isolated from the underlying components to inform systems that use the reflected light to analyze in vivo signals that traverse the sensory retina prior to reaching or returning from underlying structures. An example of such a system is optical coherence tomography (OCT), which isolates the light that is backscattered prior to reaching the pigment epithelium. Our result seems to indicate that OCT using light that is highly absorbed by the RPE such as blue or green wavelengths would remain feasible for interrogating the sensory retina because the reflectance/transmittance of this structure is nearly spectrally neutral. The absolute swine fundus reflectance in this paper is significantly higher than the human fundus reflectance found by other authors, although the spectral shape is similar.9, 29, 30 The explanation for this difference may lie in the illumination and imaging method used in our study. The flux from a point on the fundus is integrated over a solid angle determined by the dilated pupil of the swine; if this solid angle is larger than the solid angle in other measurements, the measured reflectivity will be correspondingly larger. Also, diffuse illumination is used adding a large amount of scattered light to the measured signal, resulting in two primary light sources: The direct light from the fiber optic illuminator, and a glowing “integrating sphere” of illumination arising from scattered light from the entire globe. The relative intensity of this second “source” is highly dependent on the illumination technique and a stray light model of the eye might provide an estimate of the magnitude of the contribution for a given illumination method. Obtaining reflectance data from the eye using diffusely illuminating light sources as is done with fundus cameras creates scattered light signals from within the globe that are similar in magnitude to the integrating sphere effect we observed. Further, systems that use small illuminating spots such as the strictly localized orbital will still have a scatter signal from within the globe but the signal will be relatively attenuated. This provides an advantage to laser scanning systems when performing tests that attempt to quantify the amount of individual chromophores in a given area of the retina. The commonly used oximetry technique where the reflected light from the perivascular region is divided into the reflected light from the vessel should account for the integrating sphere effect by dividing out the signal. The requirement to use the perivascular fundus signal in this manner has lead to the dependence of calibrated oximetry on the absolute fundus reflectance in the perivascular region.31, 32, 33 5.Summary and ConclusionsWe have demonstrated the first in vivo sensory retina transmittance and fundus reflectance measurements that were acquired using subretinal Spectralon as a calibration target. The scattered light throughout the globe behaves like an integrating sphere, and this physical phenomenon should be included in retinal spectroscopy model equations. Intravitreal illumination effectively removed the reflections arising from the anterior interfaces of the swine eye. Evidence for a blue-green reflector above the RPE is presented. Any conclusions regarding retinal behavior from this study are limited because we only studied one eye in vivo. However, the techniques used to carry out the experiment are novel. These results warrant further study, including quantifying pigmentation contributions, reflectance changes, and retinal thickness when different eyes and different locations are studied. The effects of age, disease states, and therapies might also be studied using this technique. ReferencesH. Helmholtz,
“Beschreibung eines Augenspiegels zur Untersuchung der Netz haut im lebenden Auge,”
Arch. Physiol. Heilk., 11 827
–830
(1851). Google Scholar
D. Schweitzer,
S. Guenther,
M. Scibor, and
M. Hammer,
“Spectrometric investigation in ocular hypertension and early stages of primary open angle glaucoma and of low tension glaucoma—multisubstance analysis,”
Int. Ophthalmol., 16 251
–257
(1992). 0165-5701 Google Scholar
D. Schweitzer,
S. Klein,
S. Guenther, and
M. Hammer,
“Early diagnosis of glaucoma by means of fundus reflectometry,”
New Trends Ophthalmol, 7 241
–247
(1992). Google Scholar
R. W. Knighton,
S. G. Jacobson, and
C. M. Kemp,
“The spectral reflectance of the nerve fiber layer of the macaque retina,”
Invest. Ophthalmol. Visual Sci., 30 2393
–2402
(1989). 0146-0404 Google Scholar
F. C. Delori and
K. P. Pflibsen,
“Spectral reflectance of the human ocular fundus,”
Appl. Opt., 28 1061
–1077
(1989). 0003-6935 Google Scholar
M. Hammer and
D. Schweitzer,
“Quantitative reflection spectroscopy at the human ocular fundus,”
Phys. Med. Biol., 47 179
–191
(2002). https://doi.org/10.1088/0031-9155/47/2/301 0031-9155 Google Scholar
W. Hunold and
P. Malessa,
“Spectrophotometric determination of melanin pigmentation of the human ocular fundus in vivo,”
Ophthalmic Res., 6 355
–362
(1974). 0030-3747 Google Scholar
G. S. Brindley and
E. N. Willmer,
“The reflection of light from the macular and peripheral fundus oculi in man,”
J. Physiol. (London), 116 350
–356
(1952). 0022-3751 Google Scholar
D. van Norren and
J. J. Vos,
“Spectral reflectance of the human eye,”
Vision Res., 26 313
–320
(1986). https://doi.org/10.1016/0042-6989(86)90028-3 0042-6989 Google Scholar
J. J. Vos,
A. A. Munnik, and
J. Boogaard,
“Absolute spectral reflectance of the fundus oculi,”
J. Opt. Soc. Am., 55 573
–574
(1965). 0030-3941 Google Scholar
D. van Norren and
T. Tiemeijer,
“Spectral reflectance of the human eye,”
Vision Res., 26 313
–320
(1978). https://doi.org/10.1016/0042-6989(86)90028-3 0042-6989 Google Scholar
M. Hammer,
D. Schweitzer,
L. Leistritz,
M. Scibor,
K-H Donnerhacke, and
J. Strobel,
“Imaging spectroscopy of the human ocular fundus in vivo,”
J. Biomed. Opt., 2
(4), 418
–425
(1997). https://doi.org/10.1117/1.429842 1083-3668 Google Scholar
F. C. Delori,
“Spectrophotometer for noninvasive measurement of intrinsic fluorescence and reflectance of the ocular fundus,”
Appl. Opt., 33 7439
–7452
(1994). 0003-6935 Google Scholar
F. C. Delori and
S. A. Burns,
“Fundus reflectance and the measurement of crystalline lens density,”
J. Opt. Soc. Am. A, 13
(2), 215
–226
(1996). 0740-3232 Google Scholar
N. P. A. Zagers,
J. van de Kraats,
T. T. J. M. Berendschot, and
D. van Norren,
“Simultaneous measurement of foveal spectral reflectance and cone-photoreceptor directionality,”
Appl. Opt., 41
(22), 4686
–4696
(2002). https://doi.org/10.1364/AO.41.004686 0003-6935 Google Scholar
G. J. van Blockland,
“Directionality and alignment of the foveal receptors, assessed with light scattered from the human fundus in vivo,”
Vision Res., 26
(3), 495
–500
(1986). https://doi.org/10.1016/0042-6989(86)90192-6 0042-6989 Google Scholar
A E. Eisner,
S. A. Burns,
G. W. Hughes, and
R. H. Webb,
“Reflectometry with the scanning laser ophthalmoscope,”
Appl. Opt., 31 3697
–3710
(1992). 0003-6935 Google Scholar
R. W. Knighton,
“Quantitative reflectometry of the ocular fundus,”
IEEE Eng. Med. Biol. Mag., 14 43
–51
(1995). 0739-5175 Google Scholar
G. Kortum, Reflectance Spectroscopy, Principles, Methods, Applications, 116
–120 Springer-Verlag, New York
(1969). Google Scholar
R. W. Knighton,
S. G. Jacobson, and
M. I. Roman,
“Specular reflection from the surface of the retina,”
Proc. SPIE, 1066 10
–17
(1989). 0277-786X Google Scholar
M. D. Knudtson,
B. E. K. Klein,
R. Klein,
T. Y. Wong,
L. D. Hubbard,
K. E. Lee,
S. M. Meuer, and
C. P. Bulla,
“Variation associated with measurement of retinal vessel diameters at different points in the pulse cycle,”
Br. J. Ophthamol., 88
(1), 57
–61
(2004). 0007-1161 Google Scholar
H. C. Chen,
V. Patel,
J. Wiek,
S. M. Rassam, and
E. M. Kohner,
“Vessel diameter changes during the cardiac cycle,”
Eye, 8 97
–103
(1994). 0950-222X Google Scholar
M. J. Dumskyj,
S. J. Aldington,
C. J. Doré, and
E. M. Kohner,
“The accurate assessment of changes in retinal vessel diameter using multiple frame electrocardiograph synchronised fundus photography,”
Curr. Eye Res., 15
(6), 625
–632
(1996). 0271-3683 Google Scholar
A Guide to Reflectance Coatings and Materials, Labsphere, North Sutten, N.H.
(2002). Google Scholar
P. Viola, W. M. Wells III,
“Alignment by maximization of mutual information,”
Int. J. Comput. Vis., 24
(2), 137
–154
(1997). https://doi.org/10.1023/A:1007958904918 0920-5691 Google Scholar
J. van de Kraats,
T. T. J. M. Berendschott, and
D. van Norren,
“The pathways of light measured in fundus reflectometry,”
Vision Res., 36
(15), 2229
–2247
(1996). https://doi.org/10.1016/0042-6989(96)00001-6 0042-6989 Google Scholar
A Guide to Reflectance Coatings and Materials, 2006). http://www.labsphere.com/data/userFiles/A%20Guide%20to%20Reflectance%20Coatings%20and%20Materials.pdf Google Scholar
K. R. Denninghoff,
R. A. Chipman, and
L. W. Hillman,
“Oxyhemoglobin saturation measurements by green spectral shift,”
Opt. Lett., 31
(7), 1
–3
(2006). 0146-9592 Google Scholar
F. C. Delori and
K. P. Pflibsen,
“Spectral reflectance of the human ocular fundus,”
Appl. Opt., 28
(6), 1061
–1077
(1989). 0003-6935 Google Scholar
M. Hammer and
D. Schweitzer,
“Quantitative reflection spectroscopy at the human ocular fundus,”
Phys. Med. Biol., 47 179
–191
(2002). https://doi.org/10.1088/0031-9155/47/2/301 0031-9155 Google Scholar
J. M. Beach,
K. J. Schwenzer,
S. Srinivas,
D. Kim, and
J. S. Tiedeman,
“Oximetry of retinal vessels by dual-wavelength imaging: calibration and influence of pigmentation,”
J. Appl. Physiol., 86
(2), 748
–758
(1999). 8750-7587 Google Scholar
K. R. Denninghoff,
M. H. Smith,
R. A. Chipman,
L. W. Hillman,
P. M. Jester,
C. E. Hughes,
F. Kuhn, and
L. W. Rue,
“Retinal large vessel oxygen saturations correlate with early blood loss and hypoxia in anesthetized swine,”
J. Trauma: Inj., Infect., Crit. Care, 43
(1), 29
–34
(1997). https://doi.org/10.1097/00005373-199707000-00009 1079-6061 Google Scholar
F. C. Delori,
“Noninvasive technique for oximetry of blood in retinal-vessels,”
Appl. Opt., 27
(6), 1113
–1125
(1988). 0003-6935 Google Scholar
|
||||||||||||||||||||||||||||||||||||||||||||||||||||||||||||||||||||||||||||||||||||||||||||||||||||||||||||||||||||||||