

|
|
1.IntroductionSpontaneous and repetitive peri-infarct depolarizations (PIDs), electrophysiologically similar to cortical spreading depression (CSD), increase metabolic demand in ischemic tissue by causing massive ionic shifts.1, 2 There is evidence that the expansion of ischemic territory is closely coupled to the occurrence of PIDs 1, 3, 4, 5, 6, 7, 8, 9 presumably due to increased metabolic demand of repolarization.3, 5, 10, 11 However, the mechanisms by which PIDs expand the infarct are not fully understood. In particular, the impact of PIDs on oxygen metabolism in focal cerebral ischemia has not been studied in real-time with high spatiotemporal resolution. We have recently demonstrated that cerebral blood flow (CBF) response to PIDs varies throughout the ischemic hemisphere: while PIDs evoke a hyperemic response outside the ischemic territory, they are associated with hypoperfusion in the penumbra and core. This vasoconstrictive form of neurovascular coupling during ischemic depolarizations contributes to infarct expansion.5, 12 Therefore, it is important to develop a more complete understanding of the spatial and temporal characteristics of CBF, hemoglobin oxygenation, and volume, measured in the form of oxy-/deoxyhemoglobin (HbO, HbR), as well as the cerebral metabolic rate of oxygen ,13 in acute focal cerebral ischemia. Measurement of the hemodynamic parameters in the cortex has been demonstrated previously, and sometimes simultaneously, during functional activation studies,14, 15, 16, 17, 18 but most of these measurements had very limited spatial resolution due to the difficulties in obtaining full field images of both CBF and hemoglobin oxygenation. Recently, the technical obstacles that have prevented full field imaging of both CBF and hemoglobin concentration changes, and therefore , have been overcome by combining two different optical imaging approaches.19 Laser speckle flowmetry (LSF) has been demonstrated to be highly effective at imaging CBF changes in animal models with very high spatial and temporal resolutions20, 21, 22, 23, 24 and has been used in studies of cortical spreading depression (CSD),21, 25 ischemia,22 and functional activation,15, 19, 20, 25, 26 as well as a growing number of other experimental paradigms.27, 28 Multispectral reflectance imaging (MSRI)19, 25 is an extension of single-wavelength intrinsic optical imaging,29, 30 whereby the cortex is sequentially illuminated with different wavelength bands and the resulting set of spectral images is combined to produce two-dimensional (2-D), time-resolved maps of changes in blood volume and oxygenation. MSRI has been used to investigate the hemoglobin oxygenation and blood volume responses to functional activation in anesthetized animals.19, 20, 31, 32 In this study, we used simultaneous LSF and MSRI to investigate the spatial and temporal dynamics of changes in oxyhemoglobin (HbO), deoxyhemoglobin (HbR), total hemoglobin (HbT), CBF, and during focal ischemia in mice. We show that the traditional method for determination of changes in hemoglobin concentration using the modified Beer-Lambert law leads to significant overestimation of the magnitude of concentration changes during ischemia. A nonlinear fitting algorithm was thus developed and applied for the first time here, for accurate determination of hemoglobin concentration changes. Using this technique, we extract high-resolution time courses of all five hemodynamic parameters throughout the ischemic core, penumbra, and nonischemic cortex and show that the hemodynamic and metabolic changes accompanying PIDs differ spatially throughout the ischemic territory, providing further evidence of pathological forms of neurovascular coupling in the core and penumbra. 2.Materials and Methods2.1.InstrumentationThe instrument used in these experiments [Fig. 1a ] is a combined, simultaneous multispectral and laser speckle imaging system. It is similar to one used in previously published studies,19, 20 except that two cameras were used to acquire LSF and MSRI images simultaneously. Light for multispectral imaging is provided by a quartz tungsten halogen fiber-optic illuminator (Techniquip R150, Capra Optical, Natick, Massachusetts) and passes through -wide bandpass filters, ranging from . As in the previously described instrument, a laser diode ( , ) provides the coherent illumination required for LSF imaging. The light is captured using a variable magnification objective ( to , Edmund Optics, Barrington, New Jersey) and either focused through (IR laser) or reflected off (visible light) a dichroic mirror onto two CCD cameras (Coolsnap fx, Roper Scientific, Tucson, Arizona, with binning, resulting in image size for MSRI; Cohu 4600, San Diego, California, for LSF). Raw MSRI data was collected in sequences of 30 frames at , with one sequence approximately every . Raw speckle data was similarly collected in sequences of 10 frames at , with one sequence every and converted to speckle contrast images before averaging. The repetition rate of was chosen as a balance between disk space use and data quality, the temporal resolution is adequate to capture the changes observed, although there is no fundamental reason why higher temporal resolution cannot be used. Fig. 1Combined multispectral and speckle contrast imaging of mouse cortex. A schematic of the system for simultaneous LSF and MSRI using two cameras is shown in panel (a). A representation of the mouse skull with a blood flow map obtained from LSF superimposed is shown in panel (b). The arrow [distal middle cerebred artery occlusion (dMCAO)] shows the point at which the MCA is clipped. The ischemic core (which has residual blood flow of ) and penumbra are shown as superimposed thresholded relative CBF maps. Panels (c) and (d) show a reflectance image and a speckle contrast image. The speckle contrast map has been spatially co-registered with the reflectance image using an affine transformation.  2.2.Image AnalysisThe details of CBF imaging using speckle contrast have been published previously.25 Briefly, a speckle contrast image is calculated by dividing the standard deviation by the average intensity of pixels in a small region of the image, over an integration time of , and converting speckle contrast values to correlation times, inversely proportional to velocity,33 which is assumed to be proportional to CBF. The reflectance image from each wavelength was averaged over the sequence and was used to calculate changes in HbO and HbR from baseline. Two approaches were compared for determination of hemoglobin concentration changes: the modified Beer-Lambert law and a nonlinear least-squares fitting approach based on Monte Carlo simulation of wavelength-dependent light propagation in tissue. The modified Beer-Lambert law relates the measured change in intensity to a change in chromophore concentration: where is the measured change in attenuation, is the molar extinction coefficient for each chromophore, is the change in concentration of each chromophore, and is the differential path length factor that accounts for the wavelength dependence of tissue scattering. The differential path length factor also depends on the baseline optical properties (absorption due to HbO, HbR concentrations, and scattering coefficient),34 and was estimated using Monte Carlo simulations that accounted for the geometry of the imaging system,20 using a homogeneous tissue model. Oxygenated and deoxygenated hemoglobin were assumed to be the only chromophores, and scattering changes were also included as a pseudo-chromophore.34The nonlinear fitting procedure is a least-squares minimization of the difference between the measured intensity change and the intensity change predicted by the Monte Carlo model for a given set of optical properties. The measured intensity change is the ratio of the detected intensity at time to the detected intensity at , , while the intensity change predicted by the Monte Carlo model is given by , where is the predicted intensity under the assumed baseline conditions corresponding to . The wavelength-dependent intensity is a function of the tissue absorption coefficient, , and scattering coefficient, . The absorption coefficient was assumed to depend only on the concentrations of HbO and HbR, , where is the molar extinction coefficient, and the scattering coefficient was assumed to follow the form (Ref. 35). Baseline conditions were assumed to be: , , , the anisotropy coefficient , at . The absolute value again had little bearing on the magnitude of changes; therefore, a previously published value was used.34 The values of the fitting parameters that minimized the difference between the measured and modeled intensity changes were determined using the least-squares fitting procedure. A perturbation Monte Carlo model36, 37 was used to optimize the calculation of the reflected intensities for a given set of optical properties. The Monte Carlo model also accounted for the illumination and detection geometries of the experimental setup. The least-squares determination of the hemoglobin concentration and scattering changes at each time point took approximately due to the increased computational efficiency of the perturbation Monte Carlo model. To spatially co-register the images from the LSF and MSRI, speckle contrast images and unprocessed reflectance images were used to establish vascular landmarks, and a transformation matrix was calculated for each experiment (Fig. 1). For the extraction of quantified time courses, one or more small regions of interest (ROIs) were selected by inspection of the MSRI data and mapped onto the LSF data. Hemoglobin concentration and speckle contrast were then averaged over the same physical ROI. The LSF time course was interpolated to make it concurrent with the MSRI data. The data from both MSRI and LSF were then used20, 38 to calculate changes in : 2.3.General Surgical PreparationsMice (C57BL/6J, , ) were anesthetized with isoflurane (2% induction and 1% maintenance), endotracheally intubated, and ventilated (70% 30% ; SAR 830/P, CWE, Ardmore, Pennsylvania). The femoral artery was cannulated for the purposes of continuous recording of blood pressure (BP) (ETH-400 transducer amplifier, ADInstruments, Colorado Springs, Colorado) and heart rate (PowerLab, ADInstruments). Mice were paralyzed (pancuronium, i.p.) and placed on a stereotaxic frame. The scalp and periosteum were pulled aside and mineral oil was applied to the exposed skull to prevent drying. Adequacy of the anesthesia was checked regularly by the absence of a blood pressure response to tail pinch. Body temperature was maintained at using a thermostatic heating pad (FHC, Brunswick, Maine). Arterial blood gases and pH were measured at least once per hour using samples (Blood Gas Analyzer 248, CIBA/Corning, Massachusetts) and used to maintain all physiological parameters within previously reported normal limits.39 Institutional guidelines for the care and use of animals were strictly followed, and all experiments were approved by a review committee. 2.4.Focal Cerebral IschemiaAfter general surgical preparation, the temporalis muscle was separated from the temporal bone and excised. A burr hole ( diameter) was drilled through the temporal bone, just above the zygomatic arch, while saline was applied as a coolant. The dura was kept intact, and a microvascular clip (Ohwa Tsusho, Tokyo, Japan) was used to occlude the distal middle cerebral artery (dMCAO). Based on the severity of CBF reduction during the first minute of dMCAO, three cortical regions [Fig. 1b] of interest (ROIs, ) were manually selected corresponding to the core ( , ), the hemodynamic penumbra ( , steep portion of CBF gradient between the core and nonischemic cortex, ), and the nonischemic cortex (NI; . The location of the dMCAO and the imaging region (gray box) are also shown in Fig. 1b. 3.Results3.1.Discrepancy Caused by the Modified Beer-Lambert ApproximationThe standard analysis for MSRI involves a first-order linear approximation to a nonlinear system. The approximation is valid for small changes in chromaphore concentration; however, one might expect significant errors at large changes. Since changes in chromophore concentration are expected to be very large during ischemia compared to those encountered in studies of functional activation, numerical analysis of the accuracy of the modified Beer-Lambert law for large changes in both HbO and HbR was conducted. The Monte Carlo model was used to generate simulated reflectance data at different hemoglobin concentrations for each wavelength. The changes in HbO and HbR concentrations for each simulated reflectance set were then determined using the modified Beer-Lambert law [Eq. 1], and the difference between the actual concentration changes and those predicted by the modified Beer-Lambert law were determined. For a range of simulated changes in of , the expected changes in reflectance of the six wavelengths of light were calculated from the Monte Carlo model. Here and elsewhere, refers to either HbO or HbR. These intensity changes at each wavelength represent the theoretically true change in reflectance due to the simulated changes in chromophore concentration . From these “true” changes in reflection, changes in chromophore concentration that would be measured using the Beer-Lambert approximation can be calculated . Figure 2 shows the discrepancy in the calculated values, , against the normalized change in concentration for each chromophore , where is the baseline value. The plot of discrepancy in HbO [Fig. 2a] shows that as nHbO decreases, the Beer-Lambert approximation underestimates the value of HbO ( is negative). As nHbO decreases, the discrepancy gets worse; at around , the discrepancy becomes so severe that the calculated value of HbO would become negative. At high nHbO, there is a moderate overestimation of HbO. The similar plot for HbR has nearly radial isolines. The line representing runs nearly along . This means that if the fractional change in the chromophore concentrations were the same across the two chromophores, the results of the Beer-Lambert approximation would be roughly accurate for HbR. This situation would occur if there was no change in the average oxygen saturation, but blood volume could change freely without causing a discrepancy. If the balance of HbO/HbR were to shift in favor of HbO (i.e., an increase in saturation), that would result in a move in parameter space to the top-left half of the plot, where HbR would be underestimated. If oxygen saturation were to decrease, HbR would be overestimated. Fig. 2Discrepancy in calculated values of HbO and HbR introduced by the modified Beer-Lambert approximation. Baseline chromophore concentrations of and were assumed. For a range of changes in HbO and HbR of , expected changes in reflectance in the six wavelengths were calculated using pathlengths taken from a lookup table of precalculated values. The plots show , which is a normalized discrepancy between the actual concentration changes and those determined with the modified Beer-Lambert law. The results for HbO (a), show a strong overestimation of the when is large. The graph shows that the Beer-Lambert approximation would yield nonphysical negative results for HbO. From (b), it can be seen that changes in HbR would be reasonably accurate if the fractional change in HbR was approximately equal to that in HbO, i.e., the average oxygen saturation remains constant. In a stroke experiment, HbO would be severely underestimated, possibly resulting in negative values, and HbR would be overestimated. 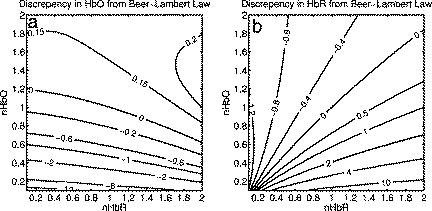 The predictions of the model suggest that in a stroke experiment, where HbO is expected to dramatically decrease and the average oxygen saturation is also expected to decrease, the magnitude of the HbO decrease would be severely overestimated, possibly resulting in negative values, and HbR would be overestimated. Similar plots in which the predicted changes in reflection were then fit with the nonlinear fitting method showed no discrepancy between the and (nonlinear data not shown). Comparison of the analysis of a typical time course for a mouse undergoing dMCAO using the modified Beer-Lambert approximation and the nonlinear fitting method (Fig. 3 ) is consistent with the predictions from the numerical simulations (Fig. 2). Immediately after the occlusion, HbO drops dramatically [Fig. 3a], and as predicted, the values reported by the Beer-Lambert approximation become negative. In contrast, the nonlinear fitting technique yields results that are physically possible. For comparison, scattering was included in the Beer-Lambert fitting method as a pseudo-chromophore,34 and the scattering coefficient was allowed to be fit in the nonlinear method. For the HbO calculation, the inclusion of the scattering coefficient as a fittable parameter made very little difference to either time course. The Beer-Lambert approximation for HbR overestimated the value of HbR compared to the nonlinear solution, also as expected from the simulations. In this case, the inclusion of scattering as a parameter made a noticeable difference in the time courses for both Beer-Lambert and nonlinear methods. These results, particularly those in Fig. 3a, indicate that the modified Beer-Lambert law cannot be used for quantitative analysis of hemoglobin concentration changes during ischemia. In addition, the change in the scattering pseudo-chromophore for the Beer-Lambert approximation and the scattering coefficient for the nonlinear solution are shown. Scattering decreases after occlusion (according to the nonlinear solution) and returns to approximately baseline levels after reperfusion. This might be due to neuroglial depolarization and swelling. It is interesting to note that the loss of photons due to scattering according to the Beer-Lambert approximation goes down. This is not necessarily a contradiction, as the effects of scattering coefficients have an unpredictable effect on photon loss. Fig. 3Comparison of concentration changes in HbO and HbR determined with the modified Beer-Lambert law and the nonlinear fitting. For both techniques, calculations were made either assuming that scattering was constant (solid lines) or fitting for scattering (dashed lines). The modified Beer-Lambert method yields negative results for HbO (a) after the occlusion, which means that the volume of HbO is predicted to drop by more than 100%. Also included (a) are the traces for changes in scattering pseudo-chromophore for the Beer-Lambert approximation and the changes in the scattering coefficient for the nonlinear fitting technique. Note that the fact that the two traces appear to move in opposite directions is not a contradiction, as an increase in scattering does not necessarily mean an increase in the number of photons lost by scattering. Scattering changes only slightly during AD and recovers after reperfusion.  3.2.Time Courses of the Four Hemodynamic Parameters and after dMCAOImmediately after occlusion (Fig. 4 , first dashed line), there is an abrupt decrease in HbO , CBF , and , while HbR increases and HbT shows a small decrease in the ischemic core. This is consistent with a stagnation and deoxygenation of blood in the vasculature after dMCAO. After approximately , there is a secondary reduction in all hemodynamic parameters and that initially occurs in the core. This event is consistent with passive vascular collapse or active vasoconstriction as a result of anoxic depolarization (AD), as previously described.5 The event spreads first to the penumbra and then to the nonischemic cortex (third dashed line) consistent with the first peri-infarct spreading depolarization (PID). During the PID, all parameters except HbR are transiently decreased, followed by partial recovery, while HbR transiently increases. After the PID (fourth dashed line), there is a persistent reduction in , even in the nonischemic cortex. Fig. 4Average time courses of hemodynamic parameters during dMCAO and subsequent anoxic depolarization. Error bars show the standard deviation between animals. The drop in occurs as a two-stage process. The initial phase is a direct result of reduced CBF from the occlusion (first dashed line). During this period, HbT decreases only marginally. After a short period of time (second dashed line), HbT begins to drop, accompanied by a drop in all parameters. This event, which is consistent with passive vascular collapse or active vasoconstriction, corresponds to AD in the core and the first PID in the penumbra and nonischemic cortex; it spreads through the entire hemisphere, reaching the ROI in the nonischemic cortex at the third dashed line. In the nonischemic cortex and penumbra, the effect of this first PID is to transiently suppress CBF, HbO, , and HbT, while HbR increases slightly, followed by partial recovery (fourth dashed line). The change in scattering coefficient (a) is also shown (cyan). (Color online only.)  After the initial PID event, spontaneous and repetitive PIDs are observed, altering the hemodynamic parameters and . In a representative experiment shown in Fig. 5 , four major (vertical dashed lines) and four minor PIDs (vertical dotted lines) are seen. In the nonischemic cortex and penumbra, each PID is accompanied by an initial drop in all parameters except HbR, followed by a transient overshoot. In the ischemic core, a decrease is observed following the PIDs, but there is no discernable overshoot. This result is interesting, as it shows that a small amount of metabolism is taking place even in the most severely ischemic core, as evidenced by a further reduction of during a PID. Fig. 5Exemplar time courses of all four hemodynamic parameters, , and the scattering coefficient (a) during successive PIDs. Error bars show standard deviations. In the ischemic core, each PID is followed by a drop in HbO, HbT, CBF, and and an increase in HbR. In the penumbra and nonischemic cortex, the initial decreases are followed by hyperemic overshoot, with the reverse occurring in HbR. Four major (vertical dashed lines) and four minor (vertical dotted lines) PIDs are shown. A small amount of metabolism takes place even in the most severely ischemic core, as evidenced by a further reduction of during a PID; there are also dips in the other parameters except for HbR, which shows a corresponding increase. Everywhere except for the core, the dip is followed by a transient overshoot, which may represent a form of intrinsic neurovascular coupling. 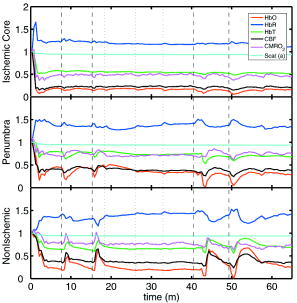 Twelve PIDs taken from six animals were analyzed. The trough of the initial drop in relative to the pre-PID level and the peak of the metabolic overshoot were measured over regions of interest in the core, penumbra, and nonischemic cortex (Fig. 6 ). The magnitude of the initial drop was found to be within experimental errors and not statistically significantly different across the three regions. In contrast, the size of the metabolic overshoot was largest in the nonischemic cortex, smaller in the penumbra, and nonexistent in the core. A one-way ANOVA with post hoc (Bonferroni/Dunn) showed significant differences between all regions of interest , core versus nonischemic cortex; , nonischemic cortex versus penumbra; , core versus penumbra). Fig. 6Effects of PID on in the three regions of interest. The effects of multiple PIDs from six mice are averaged. The lowest point of the initial dip in metabolism and the highest point in the overshoot are averaged. While no significant difference in size of the initial drop is observed using one-way ANOVA and the Bonferroni/Dunn post hoc test, the difference in the magnitude of overshoot is significant.  After approximately of dMCAO, the clip was removed from the MCA to allow reperfusion (Fig. 7 ). In none of the regions was there a complete recovery to preocclusion levels. Interestingly, remained below preocclusion levels after reperfusion, suggesting irreversible metabolic suppression. Interestingly, the reperfusion was more complete in the ischemic core than in the nonischemic cortex, perhaps due to postischemic hyperemia. Fig. 7Average time courses of the four hemodynamic parameters, , and scattering coefficient (a) during reperfusion. Following reperfusion, neither the hemodynamic parameters or recover to the preischemic level. The persistent suppression of , particularly in the ischemic core, after reperfusion suggests irreversible metabolic damage. The scattering coefficient recovers completely. 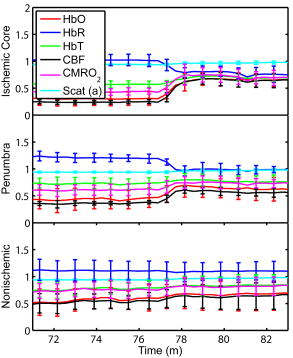 Although the nonlinear fitting technique is too computationally intensive to perform on a high spatiotemporal basis for the entire experiment, qualitative maps of changes in HbO, HbR, and HbT can be made using the Beer-Lambert approximation Video 1 . In these maps, green represents the baseline levels, blue indicates decrease, and red represents increase; no absolute scale bar is given since the maps are not quantitative but sufficient to make observations about spatial extent and effects. Comparing the first few minutes of HbO, HbR, and HbT, it can be seen that changes in HbO and HbR precede the change in HbT, as shown in Fig. 4. Later, at the , frame, particularly in the plot of HbT, a rim of comparative hyperemia can be seen separating the deepest blood volume deficit in the ischemic core from the post-PID oligemia in the nonischemic cortex. No such rim is observed in CBF. PIDs appear to move around the cortex, often emerging from the anterior, or less commonly the medial or posterior, to the infarct. Generally, the depression moves around the edge, apparently not entering the main infarct area but clearly affecting the penumbra and nonischemic cortex. However, when the core region of interest is plotted over time, small amplitude changes can be seen in the core temporally associated with PIDs, suggesting that PIDs or their hemodynamic effects spread into the core as well. Occasionally, in experiments where PIDs are frequent, a PID may appear to move in a circle and go back along the same path, although more commonly, the event travels to the other side of the infarct before disappearing. Video 1Qualitative maps of changes in HbO (a), HbR (b), HbT (c), and CBF (d) of the first of a typical experiment ( , , , color online only). The hemodynamics described in Fig. 4 can be seen in the first eight frames. Note particularly that HbO clearly drops by frame 3 but that HbT has shown little decrease by this point. In addition, a PID can be observed moving through the nonischemic cortex in the last three frames (white arrows). In the middle frames, particularly of panel (c), the comparative hyperemia (black arrow) of the penumbra can be seen. This video demonstrates hemodynamic parameters throughout the experiment, showing anoxic depolarization, multiple PIDs, and reperfusion followed by death by anoxia (MPG, 5.22 MB). Video 1  4.DiscussionMultispectral optical measurements have been widely used to assess changes in cortical concentrations of oxy- and deoxyhemoglobin from changes in light reflectivity as predicted by the modified Beer-Lambert law. The work of Kohl34 explored the use of the modified Beer-Lambert approximation in intrinsic optical imaging. Up to now, the changes measured have been due to functional activation16, 32, 40 or CSD21, 41 and as such have been smaller perturbations than observed here. As a result, linearization has been considered adequate to calculate changes in HbR and HbO concentration. In focal cerebral ischemia, the changes measured are much larger; therefore, we did not assume that linearization was sufficient. The severe changes in HbO and HbR during ischemia lead to significant changes in the path lengths of the detected photons. Based on Monte Carlo simulations, we estimated that the photon path length in the ischemic core increases by more than 60% compared with baseline conditions ( versus ). While the change in path length might in principle affect the laser speckle measurement, in practice, the wavelength used is in a region where little absorption occurs and the path length is short; therefore, path length changes are unlikely to have a significant effect. Numerical simulations and comparisons of results show that the use of the Beer-Lambert approximation in the analysis of ischemia data leads to serious errors, most seriously a large overestimation of the reduction in HbO, leading to calculated values of HbO of less than zero. For this reason, we solved for changes in HbO and HbR from reflectance data using a nonlinear minimization method in a manner similar to that used in other measurements of tissue optical properties36, 42, 43, 44. While this method has the disadvantage of requiring a large increase in computational time, it is practical to extract multiple time courses for relevant regions of interest. In this work we have used the Beer-Lambert approximation to extract qualitative spatial maps of parameter changes that can be useful for observations of hemodynamic behavior (see Video 1.) With additional optimization, the nonlinear fitting procedure should be capable of producing quantitative spatiotemporal maps of hemodynamic changes. There has been much interest in the measurement of in the ischemic and injured brain in both experimental animals45, 46, 47 and humans.48, 49 Metabolic measures are thought to be strong indicators of tissue outcome, with oxygen and glucose metabolism being closely linked.50 LSF imaging has previously been applied to cerebral ischemia,5, 22 and its advantages over laser Doppler flowmetry have been previously established in terms of the free placement of ROIs and increased spatial and temporal resolution.19 Other groups have reported similar decreases in at isolated time points post-ischemia. For example, Singh 45 found a 60% decrease, post global brain ischemia (neck tourniquet), that lasted to post-ischemia. Temma 51 also showed approximately 50% reduction in after transient MCA occlusion in rats. There have been positron emission tomography (PET) studies in primates and cats52, 53 that have shown reductions in CBF of and 60%, respectively, and reductions in levels of . In addition, they report an increase in oxygen extraction fraction,19 which we do not observe. A study with near infrared spectroscopy (NIRS) and Doppler flowmetry in rats has shown a less severe reduction in CBF , although encouragingly, similar time courses during PIDs were observed.54 Also in a gerbil model, Li 55 reported a drop in HbO of and an increase in HbR of . While less severe that our core results, these data are qualitatively similar; the discrepency may simply be a function of our improved spatial resolution. Taken togther, our data are consistant with the wider stroke literature. It is important to note that while the various reports vary slightly, they are conducted in different animal models; we are specifically looking at the cortex, and our technique has higher resolution. In addition, it is difficult to compare across modalities, as simultaneous reporting of all hemodynamic parameters is technically challenging. Here, we demonstrate measurement of changes during AD and subsequent PIDs over regions of interest in three different areas of the cortex in relation to arterial occlusion. We found that immediately after MCA occlusion, CBF dramatically decreases with relatively little change in HbT, even in the core, suggesting that vascular caliber is not altered during this initial phase. An increase in HbR and a decrease in HbO are observed, as the sluggish blood spends more time in the capillary bed and is deoxygenated. In the nonischemic cortex, there was little effect on any hemodynamic parameter during this early phase (i.e., prior to the spread of the first PID). After approximately one minute, HbT decreases in the core, suggesting either passive vascular collapse or active vasoconstriction. This event is accompanied by a further reduction in CBF and oxygenation. As the PID triggered by AD spreads into the nonischemic cortex, secondary reductions in HbT and are observed there as well. During PIDs, is reduced in each of the three regions of interest. Following this initial drop, there is a overshoot in the nonischemic cortex that does not occur in the ischemic core. This overshoot may be a useful measure of integrity of neurovascular coupling. The drop in in the core and the lack of a overshoot suggest that oxygen consumption in the core is delivery limited. Further, it may be possible that the maintenance of neurovascular coupling is a measure of tissue viability. The ischemic core invariably progresses to infarct, whereas the penumbra can either recover or proceed to infarct as verified by histological studies.56 More work is needed to determine whether the neurovascular coupling response to PID is correlated with the viability thresholds of tissue. It is important to note that intense neuroglial depolarizations may impact infarct outcome differently, compared to more physiological modes of depolarization (e.g., somatosensory activation via electrical forepaw stimulation), which have recently been shown to reduce cortical and striatal infarct volumes in rats undergoing MCA occlusion.57 The difference here could be that PIDs are likely to cause higher metabolic demand than forepaw stimulation and are associated with vasoconstrictive coupling rather than vasodilation. Our technique generates spatiotemporal qualitative maps of hemodynamic parameters, allowing the observation of interesting hemodynamic events. See Video 1 for a typical dMCAO experiment. The video shows AD; multiple PIDs, which can be seen moving around the nonischemic cortex; reperfusion; and ultimately, the death of the animal by induced anoxia. Advancing the first few frames of the video frame by frame shows in detail how the initial change in HbO and HbR precedes the change in HbT and leads to the PID that spreads quickly over the cortex. 5.ConclusionCombined MSRI and LSF imaging allows for simultaneous monitoring of changes in HbO, HbR, CBF, and with high spatial and temporal resolution through the intact mouse skull during focal cerebral ischemia. The generally applied modified Beer-Lambert approximation was found to be inaccurate for large changes in chromophore concentrations, and so a nonlinear fitting routine that makes use of path lengths generated from Monte Carlo simulations was used to determine time courses of hemoglobin concentration changes. During cerebral ischemia, we note that AD follows occlusion of the MCA by about a minute and leads to a secondary reduction in CBF, HbT, and in the nonischemic cortex. During PIDs, CBF reduction is accompanied by dramatic reductions in HbO and HbT, as well as ; hence, the close correspondence between with CBF suggests supply-limited oxygen metabolism in the core and penumbra. Combined multispectral reflectance and laser speckle flowmetry is a powerful tool for investigation of hemodynamic and metabolic events in focal cerebral ischemia and for testing of therapeutic agents on oxygen metabolism and tissue viability as end points. AcknowledgmentsThis work was supported by the National Institutes of Health (Grant Nos. NS10828, MAM; NS035611, MAM; NS041291, AKD; and NS050150, AKD), National Science Foundation (Grant No. 0644638 AKD), American Heart Association (Grant Nos. 0335519N, CA; and 0735136N, AKD), and National Institute of Biomedical Imaging and Engineering (Grant No. R01EB00790, DAB). ReferencesT. Back,
M. D. Ginsberg,
W. D. Dietrich, and
B. D. Watson,
“Induction of spreading depression in the ischemic hemisphere following experimental middle cerebral artery occlusion: effect on infarct morphology,”
J. Cereb. Blood Flow Metab., 16
(2), 202
–213
(1996). 0271-678X Google Scholar
E. Busch,
M. L. Gyngell,
M. Eis,
M. Hoehn-Berlage, and
K. A. Hossmann,
“Potassium-induced cortical spreading depressions during focal cerebral ischemia in rats: contribution to lesion growth assessed by diffusion-weighted NMR and biochemical imaging,”
J. Cereb. Blood Flow Metab., 16
(6), 1090
–1099
(1996). 0271-678X Google Scholar
K. A. Hossmann,
“Periinfarct depolarizations,”
Cerebrovasc Brain Metab. Rev., 8
(3), 195
–208
(1996). 1040-8827 Google Scholar
H. Otsuka,
K. Ueda,
A. Heimann, and
O. Kempski,
“Effects of cortical spreading depression on cortical blood flow, impedance, DC potential, and infarct size in a rat venous infarct model,”
Exp. Neurol., 162
(1), 201
–214
(2000). 0014-4886 Google Scholar
H. K. Shin,
A. K. Dunn,
P. B. Jones,
D. A. Boas,
M. A. Moskowitz, and
C. Ayata,
“Vasoconstrictive neurovascular coupling during focal ischemic depolarizations,”
J. Cereb. Blood Flow Metab., 26
(8), 1018
–1030
(2006). https://doi.org/10.1038/sj.jcbfm.9600252 0271-678X Google Scholar
R. M. Dijkhuizen,
R. A. de Graaf,
M. Garwood,
K. A. Tulleken, and
K. Nicolay,
“Spatial assessment of the dynamics of lactate formation in focal ischemic rat brain,”
J. Cereb. Blood Flow Metab., 19
(4), 376
–379
(1999). 0271-678X Google Scholar
O. Kempski,
H. Otsuka,
T. Seiwert, and
A. Heimann,
“Spreading depression induces permanent cell swelling under penumbra conditions,”
Acta Neurochir. Suppl. (Wien), 76 251
–255
(2000). 0065-1419 Google Scholar
T. Back,
K. Kohno, and
K. A. Hossmann,
“Cortical negative DC deflections following middle cerebral artery occlusion and KCl-induced spreading depression: effect on blood flow, tissue oxygenation, and electroencephalogram,”
J. Cereb. Blood Flow Metab., 14
(1), 12
–19
(1994). 0271-678X Google Scholar
K. Ohta,
R. Graf,
G. Rosner, and
W. D. Heiss,
“Calcium ion transients in peri-infarct depolarizations may deteriorate ion homeostasis and expand infarction in focal cerebral ischemia in cats,”
Stroke, 32
(2), 535
–543
(2001). 0039-2499 Google Scholar
J. C. LaManna,
S. A. Romeo,
R. C. Crumrine, and
K. A. McCracken,
“Decreased blood volume with hypoperfusion during recovery from total cerebral ischaemia in dogs,”
Neurol. Res., 7
(3), 161
–165
(1985). 0160-6412 Google Scholar
B. W. McColl,
H. V. Carswell,
J. McCulloch, and
K. Horsburgh,
“Extension of cerebral hypoperfusion and ischaemic pathology beyond MCA territory after intraluminal filament occlusion in C57B1/6J mice,”
Brain Res., 997
(1), 15
–23
(2004). 0006-8993 Google Scholar
H. K. Shin,
S. Salomone,
E. M. Potts,
S. W. Lee,
E. Millican,
K. Noma,
P. L. Huang,
D. A. Boas,
J. K. Liao,
M. A. Moskowitz, and
C. Ayata,
“Rho-kinase inhibition acutely augments blood flow in focal cerebral ischemia via endothelial mechanisms,”
J. Cereb. Blood Flow Metab., 27
(5), 998
–1009
(2006). 0271-678X Google Scholar
J. Mayhew,
D. Johnston,
J. Martindale,
M. Jones,
J. Berwick, and
Y. Zheng,
“Increased oxygen consumption following activation of brain: theoretical footnotes using spectroscopic data from barrel cortex,”
Neuroimage, 13
(6), 975
–987
(2001). 1053-8119 Google Scholar
Z. M. Liu,
K. F. Schmidt,
K. M. Sicard, and
T. Q. Duong,
“Imaging oxygen consumption in forepaw somatosensory stimulation in rats under isoflurane anesthesia,”
Magn. Reson. Med., 52
(2), 277
–285
(2004). 0740-3194 Google Scholar
T. Durduran,
M. G. Burnett,
G. Yu,
C. Zhou,
D. Furuya,
A. G. Yodh,
J. A. Detre, and
J. H. Greenberg,
“Spatiotemporal quantification of cerebral blood flow during functional activation in rat somatosensory cortex using laser-speckle flowmetry,”
J. Cereb. Blood Flow Metab., 24
(5), 518
–525
(2004). https://doi.org/10.1097/00004647-200405000-00005 0271-678X Google Scholar
M. Jones,
J. Berwick,
D. Johnston, and
J. Mayhew,
“Concurrent optical imaging spectroscopy and laser-Doppler flowmetry: the relationship between blood flow, oxygenation, and volume in rodent barrel cortex,”
Neuroimage, 13
(6), 1002
–1015
(2001). 1053-8119 Google Scholar
R. D. Hoge,
M. A. Franceschini,
R. J. Covolan,
T. Huppert,
J. B. Mandeville, and
D. A. Boas,
“Simultaneous recording of task-induced changes in blood oxygenation, volume, and flow using diffuse optical imaging and arterial spin-labeling MRI,”
Neuroimage, 25
(3), 701
–707
(2005). 1053-8119 Google Scholar
A. J. Kennerley,
J. Berwick,
J. Martindale,
D. Johnston,
N. Papadakis, and
J. E. Mayhew,
“Concurrent fMRI and optical measures for the investigation of the hemodynamic response function,”
Magn. Reson. Med., 54
(2), 354
–365
(2005). https://doi.org/10.1002/mrm.20511 0740-3194 Google Scholar
A. K. Dunn,
A. Devor,
H. Bolay,
M. L. Andermann,
M. A. Moskowitz,
A. M. Dale, and
D. A. Boas,
“Simultaneous imaging of total cerebral hemoglobin concentration, oxygenation, and blood flow during functional activation,”
Opt. Lett., 28
(1), 28
–30
(2003). https://doi.org/10.1364/OL.28.000028 0146-9592 Google Scholar
A. K. Dunn,
A. Devor,
A. M. Dale, and
D. A. Boas,
“Spatial extent of oxygen metabolism and hemodynamic changes during functional activation of the rat somatosensory cortex,”
Neuroimage, 27
(2), 279
–290
(2005). 1053-8119 Google Scholar
H. Bolay,
U. Reuter,
A. K. Dunn,
Z. Huang,
D. A. Boas, and
M. A. Moskowitz,
“Intrinsic brain activity triggers trigeminal meningeal afferents in a migraine model,”
Nat. Med., 8
(2), 136
–142
(2002). 1078-8956 Google Scholar
C. Ayata,
A. K. Dunn,
O. Y. Gursoy,
Z. Huang,
D. A. Boas, and
M. A. Moskowitz,
“Laser speckle flowmetry for the study of cerebrovascular physiology in normal and ischemic mouse cortex,”
J. Cereb. Blood Flow Metab., 24
(7), 744
–755
(2004). https://doi.org/10.1097/01.WCB.0000122745.72175.D5 0271-678X Google Scholar
H. Cheng,
Q. Luo,
S. Zeng,
S. Chen,
J. Cen, and
H. Gong,
“Modified laser speckle imaging method with improved spatial resolution,”
J. Biomed. Opt., 8
(3), 559
–564
(2003). https://doi.org/10.1117/1.1578089 1083-3668 Google Scholar
A. Kharlamov,
B. R. Brown,
K. A. Easley, and
S. C. Jones,
“Heterogeneous response of cerebral blood flow to hypotension demonstrated by laser speckle imaging flowmetry in rats,”
Neurosci. Lett., 368
(2), 151
–156
(2004). 0304-3940 Google Scholar
A. K. Dunn,
H. Bolay,
M. A. Moskowitz, and
D. A. Boas,
“Dynamic imaging of cerebral blood flow using laser speckle,”
J. Cereb. Blood Flow Metab., 21
(3), 195
–201
(2001). https://doi.org/10.1097/00004647-200103000-00002 0271-678X Google Scholar
B. Weber,
C. Burger,
M. T. Wyss,
G. K. von Schulthess,
F. Scheffold, and
A. Buck,
“Optical imaging of the spatiotemporal dynamics of cerebral blood flow and oxidative metabolism in the rat barrel cortex,”
Eur. J. Neurosci., 20
(10), 2664
–2670
(2004). https://doi.org/10.1111/j.1460-9568.2004.03735.x 0953-816X Google Scholar
B. Choi,
N. M. Kang, and
J. S. Nelson,
“Laser speckle imaging for monitoring blood flow dynamics in the in vivo rodent dorsal skin fold model,”
Microvasc. Res., 68
(2), 143
–146
(2004). https://doi.org/10.1016/j.mvr.2004.04.003 0026-2862 Google Scholar
H. Cheng and
T. Q. Duong,
“Simplified laser-speckle-imaging analysis method and its application to retinal blood flow imaging,”
Opt. Lett., 32 2188
–2190
(2007). https://doi.org/10.1364/OL.32.002188 0146-9592 Google Scholar
R. D. Frostig,
E. E. Lieke,
D. Y. Ts’o, and
A. Grinvald,
“Cortical functional architecture and local coupling between neuronal activity and the microcirculation revealed by in vivo high-resolution optical imaging of intrinsic signals,”
Proc. Natl. Acad. Sci. U.S.A., 87
(16), 6082
–6086
(1990). https://doi.org/10.1073/pnas.87.16.6082 0027-8424 Google Scholar
A. Grinvald,
E. Lieke,
R. D. Frostig,
C. D. Gilbert, and
T. N. Wiesel,
“Functional architecture of cortex revealed by optical imaging of intrinsic signals,”
Nature (London), 324
(6095), 361
–364
(1986). https://doi.org/10.1038/324361a0 0028-0836 Google Scholar
A. Devor,
A. K. Dunn,
M. L. Andermann,
I. Ulbert,
D. A. Boas, and
A. M. Dale,
“Coupling of total hemoglobin concentration, oxygenation, and neural activity in rat somatosensory cortex,”
Neuron, 39
(2), 353
–359
(2003). https://doi.org/10.1016/S0896-6273(03)00403-3 0896-6273 Google Scholar
A. Devor,
I. Ulbert,
A. K. Dunn,
S. N. Narayanan,
S. R. Jones,
M. L. Andermann,
D. A. Boas, and
A. M. Dale,
“Coupling of the cortical hemodynamic response to cortical and thalamic neuronal activity,”
Proc. Natl. Acad. Sci. U.S.A., 102
(10), 3822
–3827
(2005). https://doi.org/10.1073/pnas.0407789102 0027-8424 Google Scholar
J. D. Briers,
“Laser Doppler, speckle, and related techniques for blood perfusion mapping and imaging,”
Physiol. Meas, 22
(4), R35
–66
(2001). 0967-3334 Google Scholar
M. Kohl,
U. Lindauer,
G. Royl,
M. Kuhl,
L. Gold,
A. Villringer, and
U. Dirnagl,
“Physical model for the spectroscopic analysis of cortical intrinsic optical signals,”
Phys. Med. Biol., 45
(12), 3749
–3764
(2000). https://doi.org/10.1088/0031-9155/45/12/317 0031-9155 Google Scholar
J. R. Mourant,
J. P. Freyer,
A. H. Hielscher,
A. A. Eick,
D. Shen, and
T. M. Johnson,
“Mechanisms of light scattering from biological cells relevant to noninvasive optical-tissue diagnostics,”
Appl. Opt., 37
(16), 3586
–3593
(1998). https://doi.org/10.1364/AO.37.003586 0003-6935 Google Scholar
K. H. Hayakawa,
J. Spanier,
F. Bevilacqua,
A. K. Dunn,
J. S. You,
B. J. Tromberg, and
V. Venugopalan,
“Perturbation Monte Carlo methods to solve inverse photon migration problems in heterogeneous tissues.,”
Opt. Lett., 26
(17), 1335
–1337
(2001). 0146-9592 Google Scholar
A. Sassaroli,
B. Blumetti,
F. Martelli,
L. Alianelli,
D. Contini,
A. Ismaelli, and
G. Zaccanti,
“Monte Carlo procedure for investigating light propagation and imaging of highly scattering media,”
Appl. Opt., 37
(31), 7392
–7400
(1998). 0003-6935 Google Scholar
J. Mayhew,
D. Johnston,
J. Berwick,
M. Jones,
P. Coffey, and
Y. Zheng,
“Spectroscopic analysis of neural activity in brain: increased oxygen consumption following activation of barrel cortex,”
Neuroimage, 12
(6), 664
–675
(2000). 1053-8119 Google Scholar
P. L. Huang,
Z. Huang,
H. Mashimo,
K. D. Bloch,
M. A. Moskowitz,
J. A. Bevan, and
M. C. Fishman,
“Hypertension in mice lacking the gene for endothelial nitric oxide synthase,”
Nature (London), 377
(6546), 239
–242
(1995). 0028-0836 Google Scholar
J. Berwick,
D. Johnston,
M. Jones,
J. Martindale,
P. Redgrave,
N. McLoughlin,
I. Schiessl, and
J. E. Mayhew,
“Neurovascular coupling investigated with two-dimensional optical imaging spectroscopy in rat whisker barrel cortex,”
Eur. J. Neurosci., 22
(7), 1655
–1666
(2005). https://doi.org/10.1111/j.1460-9568.2005.04347.x 0953-816X Google Scholar
A. M. Ba,
M. Guiou,
N. Pouratian,
A. Muthialu,
D. E. Rex,
A. F. Cannestra,
J. W. Y. Chen, and
A. W. Toga,
“Multiwavelength optical intrinsic signal imaging of cortical spreading depression,”
J. Neurophysiol., 88
(5), 2726
–2735
(2002). https://doi.org/10.1152/jn.00729.2001 0022-3077 Google Scholar
P. K. Yalavarthy,
B. W. Pogue,
H. Dehghani, and
K. D. Paulsen,
“Weight-matrix structured regularization provides optimal generalized least-squares estimate in diffuse optical tomography,”
Med. Phys., 34
(6), 2085
–2098
(2007). https://doi.org/10.1118/1.2733803 0094-2405 Google Scholar
I. Seo,
J. S. You,
C. K. Hayakawa, and
V. Venugopalan,
“Perturbation and differential Monte Carlo methods for measurement of optical properties in a layered epithelial tissue model,”
J. Biomed. Opt., 12
(1), 014030
(2007). https://doi.org/10.1117/1.2697735 1083-3668 Google Scholar
Q. Liu and
N. Ramanujam,
“Scaling method for fast Monte Carlo simulation of diffuse reflectance spectra from multilayered turbid media,”
J. Opt. Soc. Am. A, 24
(4), 1011
–1025
(2007). 0740-3232 Google Scholar
N. C. Singh,
P. M. Kochanek,
J. K. Schiding,
J. A. Melick, and
E. M. Nemoto,
“Uncoupled cerebral blood flow and metabolism after severe global ischemia in rats,”
J. Cereb. Blood Flow Metab., 12
(5), 802
–808
(1992). 0271-678X Google Scholar
K. Katsura,
J. Folbergrova,
G. Gido, and
B. K. Siesjo,
“Functional, metabolic, and circulatory changes associated with seizure activity in the postischemic brain,”
J. Neurochem., 62
(4), 1511
–1515
(1994). 0022-3042 Google Scholar
W. E. Hoffman,
D. J. Miletich, and
R. F. Albrecht,
“Maintenance of cerebral blood flow and metabolism during pharmacological hypotension in aged hypertensive rats,”
Neurobiol. Aging, 3
(2), 101
–104.
(1982). 0197-4580 Google Scholar
P. Vespa,
M. Bergsneider,
N. Hattori,
H. M. Wu,
S. C. Huang,
N. A. Martin,
T. C. Glenn,
D. L. McArthur, and
D. A. Hovda,
“Metabolic crisis without brain ischemia is common after traumatic brain injury: a combined microdialysis and positron emission tomography study,”
J. Cereb. Blood Flow Metab., 25
(6), 763
–774
(2005). 0271-678X Google Scholar
G. J. Bouma and
J. P. Muizelaar,
“Cerebral blood flow in severe clinical head injury,”
New Horiz, 3
(3), 384
–394
(1995). 1063-7389 Google Scholar
P. Frykholm,
L. Hillered,
B. Langstrom,
L. Persson,
J. Valtysson, and
P. Enblad,
“Relationship between cerebral blood flow and oxygen metabolism, and extracellular glucose and lactate concentrations during middle cerebral artery occlusion and reperfusion: a microdialysis and positron emission tomography study in nonhuman primates,”
J. Neurosurg., 102
(6), 1076
–1084
(2005). 0022-3085 Google Scholar
T. Temma,
Y. Magata,
Y. Kuge,
S. Shimonaka,
K. Sano,
Y. Katada,
H. Kawashima,
T. Mukai,
H. Watabe,
H. Iida, and
H. Saji,
“Estimation of oxygen metabolism in a rat model of permanent ischemia using positron emission tomography with injectable 15O-O2,”
J. Cereb. Blood Flow Metab., 26
(12), 1577
–1583
(2006). 0271-678X Google Scholar
A. R. Young,
G. Sette,
O. Touzani,
P. Rioux,
J. M. Derlon,
E. T. MacKenzie, and
J. C. Baron,
“Relationships between high oxygen extraction fraction in the acute stage and final infarction in reversible middle cerebral artery occlusion: an investigation in anesthetized baboons with positron emission tomography,”
J. Cereb. Blood Flow Metab., 16
(6), 1176
–1188
(1996). 0271-678X Google Scholar
W. D. Heiss,
R. Graf,
J. Lottgen,
K. Ohta,
T. Fujita,
R. Wagner,
M. Grond, and
K. Weinhard,
“Repeat positron emission tomographic studies in transient middle cerebral artery occlusion in cats: residual perfusion and efficacy of postischemic reperfusion,”
J. Cereb. Blood Flow Metab., 17
(4), 388
–400
(1997). 0271-678X Google Scholar
T. Wolf,
U. Lindauer,
U. Reuter,
T. Back,
A. Villringer,
K. Einhaupl, and
U. Dirnagl,
“Noninvasive near infrared spectroscopy monitoring of regional cerebral blood oxygenation changes during peri-infarct depolarizations in focal cerebral ischemia in the rat,”
J. Cereb. Blood Flow Metab., 17
(9), 950
–954
(1997). https://doi.org/10.1097/00004647-199709000-00004 0271-678X Google Scholar
J.-Y. Li,
H. Ueda,
A. Seiyama,
M. Nakano,
M. Matsumoto, and
T. Yanagihara,
“A near-infrared spectroscopic study of cerebral ischemia and ischemic tolerance in gerbils,”
Stroke, 28
(7), 1451
–1457
(1997). 0039-2499 Google Scholar
J. Vogel,
C. Mobius,
W. Kuschinsky, and
W. I. Rosenblum,
“Early delineation of ischemic tissue in rat brain cryosections by high-contrast staining—editorial comment,”
Stroke, 30
(5), 1134
–1141
(1999). 0039-2499 Google Scholar
M. G. Burnett,
T. Shimazu,
T. Szabados,
H. Muramatsu,
J. A. Detre, and
J. H. Greenberg,
“Electrical forepaw stimulation during reversible forebrain ischemia decreases infarct volume,”
Stroke, 37
(5), 1327
–1331
(2006). 0039-2499 Google Scholar
|


