

|
|
1.IntroductionIt has been more than since A.P. Ivanov, A.P. Chaikovskii, and A.A. Kumeisha advanced and proved experimentally a new method for optical sectioning in scattering, not only reflecting, media by means of depth-resolved measurements of backscattered light with low coherence interferometry.1 A potential for the study of the microstructure of blood, living tissue or leaf, etc. was directly asserted in their pioneer paper. This method is the immediate precursor to optical coherence tomography (OCT).2 It should be evident to familiar with the literature. Recently, the above-mentioned paper has been mentioned by de Boer in his comprehensive references.3 Nowadays, the penetration depth for cross-sectional imaging performed with OCT is limited to a little more than one millimeter for scattering biological tissues such as the human skin.4 At first glance, it could impede the application of OCT. But biomedical imaging is too loose a concept. That is why a distinction should be made between biological subcellular studies and common clinical examinations. Smart optical techniques of subcellular resolution including OCT are able to successfully complement conventional biopsy and histopathology of superficial skin but are not readily available for routine clinical inspections.5, 6 These techniques can identify images of cancer cells to only a few hundred micrometers depth. However, the recent detailed studies of cancer statistics in Germany, Austria, Switzerland, North America, Scotland, and Australia show that the tumor thickness of dominates as the strongest prognostic factor of superior long-term survival for patients with thin cutaneous melanomas.7 Although the occurrence of melanoma is small, e.g., in comparison to basal cell carcinoma—one of the commonest types of malignant superficial lesions, often melanoma-type cancers are not diagnosed until they are in the later stage of development, and the delays are irremediable and horrifying.8 Growing vertically through the epidermal-dermal junction, the tumor damages optically birefringent collagen fibers, an abundant structural and functional component of dermis.9 A depletion of collagen content manifests through a loss of cumulative (macro-) birefringence within the dermis regions invaded by tumor. Estimation of inferior and lateral tumor margins is essential to minimize the number of numerous histological excisions and preserve as much healthy tissue as possible. In general, the potential of polarization-sensitive OCT (PS OCT) to provide functional characterization of abnormal dermis by mapping these margins was demonstrated under laboratory conditions.10, 11 However, for applications with unexpected external perturbations, e.g., mechanical effects and the ambient temperature drift arising in the clinical and hospital environment, PS OCT systems must meet special requirements. Before now, we made just speculative attacks on this challenge.12, 13 Here, we reveal the basic principle and consider in more detail the experimental verification of the specific solution proposed for such systems as well as mention the simplified algorithm for mapping birefringence of dermis through measurements of the depolarization ratio.14 2.Design Criteria2.1.Top-Down ApproachNeedless to say, dermatologists and patients would prefer to deal with a skin probing head that looks like a friendly handheld device coupled to a flexible interface cable. The examinations should be free of tedious readjustments after each test or changes in ambient properties necessarily happening in common cancer care units or consulting rooms. It is also strongly desirable to display results of tests in more indicative form accessible to an ordinary medical operator. But the issues do not add up to ergonomic engineering only. As applied to PS OCT, the main problem is how to reduce deterioration of polarization data integrity in the course of acquisition and communication of optical information from a patient’s body to the operator workstation. The adequate solution is seen in meeting simultaneously the following basic requirements:
Such a top-down approach has brought us to the solution called, for short, quasi-holographic. The solution gives instantaneous A-scans as spatially evolved fringes similar to those obtained in holographic spectroscopy.15 Since spectral content is beyond our interest here the fringe postprocessing is anticipated without Fourier inversion as in the case of the so-called linear OCT (L-OCT) system.16 Therefore, such a quasi-holographic solution does not belong to Fourier domain OCT. In the broad sense, OCT in itself can be considered as a branch of holography.17 Here, we introduce a unique tandem interferometer of polarization type that meets, in our thinking, the above-mentioned main requirements for the best advantage. 2.2.Basic PrincipleThe optical schematic is shown in Fig. 1 . The tandem interferometer is composed of the sensing Mach-Zehnder interferometer (MZI) of polarization type and the receiving Wollaston prism interferometer (WPI). The optical path in the sample arm of the sensing interferometer lies from the hypotenuse verge of NPBS, through FL-S-FL-NPBS- , up to the hypotenuse verge of PBS. In the reference arm, the optical path lies from the hypotenuse verge of NPBS, through , up to the hypotenuse verge of PBS. In this configuration, the crucial function of PBS and WP is to combine rather than split light beams. As is known, the key to operation of tandem interferometers is matching of optical path difference (OPD) between sample and reference beams in sensing and receiving interferometers within the coherence length of probing light. In a sensing interferometer, OPDs are encoded without fringe formation, and in a receiving interferometer, OPDs are decoded, spatially or in time, in the form of fringes to be finally read out.18 Briefly, a tandem interferometer transforms changes of OPD, induced by a measurand, to detectable variations of the fringe pattern.19 Fig. 1Optical schematic of the PS OCT system based on the tandem interferometer. Sensing MZ interferometer: SLD—super luminescent diode; C—collimating lens; and —linear polarizers; NPBS—nonpolarizing beamsplitter; FL—focusing lens with low numerical aperture; S—sample; —steering mirrors; —bistable half-wave switches; PBS—polarizing beamsplitter. Receiving WP interferometer: BE—beam expander; WP—Wollaston-type prism; —linear polarizer; and —cylindrical lenses; CCD—linear CCD array. Angular orientations of optical axes with respect to the plane of the draft are shown in parentheses. For simplicity, a lateral scanning device and a dispersion compensator are omitted.  Our scheme is inherently free of autocorrelation artifacts caused by interference between beams reflected in a sample itself. Also, OPDs attainable in this scheme can exceed more than two orders without any mechanical A-scanning. The basic principle and the previously-mentioned features can be readily explained in terms of the relative group delays between wave trains propagating in the dispersion-compensated arms. Indeed, the light beam from a cw SLD with the spectral bandwidth and the central wavelength has coherence time , where -speed of light. This beam can be well treated as a random sequence of traveling wave trains, each of duration . First, consider the case when depolarization of the beam backscattered (reflected) from the sample is negligible. Therefore, can be temporarily ignored. Although such an assumption simplifies the explanation, it does not compromise the concept in itself. This case is sufficient for experimental validation even within a limited budget (see Sec. 3). Referring again to Fig. 1, a linearly polarized train arrives from SLD through and is split by NPBS into mutually coherent sample and reference trains. Imagine the sample - and -trains that are backscattered, respectively, from the near interface and the rear interface . Let -train and -train spend times and , respectively, for the total traveling of the sample arm. Suppose that the concurrent reference -train needs time to pass through the reference arm. The length of this arm is adjusted so that As seen in Fig. 1, the -, -, and -trains combine in PBS and travel BE to enter WP. For clarity, these trains are denoted in Fig. 1 (lower right) as wave forms with orthogonal polarizations ☉ and ↕. Shown at the entry of WP, relative group delays between the wave forms are arranged according to the relationship 1.Now, observe how the trains pass through WP—the basic element of WPI. The standard WP shown in Fig. 1 comprises two -angled wedges of equal middle thickness jointed by their hypotenuses. The wedges are made of uniaxial negative crystal, preferably calcite, with birefringence , where and are extraordinary and ordinary refractive indices, respectively. As seen in Fig. 1 (lower right) the optical axes ⇕ and ⊗ in the wedges are aligned perpendicular to each other and parallel to the entrance-exit faces of WP. Each of the combinations (☉,⇕) and (↕,⊗) is related to the retarded traveling with the speed , whereas (☉,⊗) or (↕,⇕) corresponds to the less retarded propagation with the speed . For sufficiently small angle and angles of incidence to the entrance face of WP, the following expression well approximates the time needed for the -train to pass through WP at the distance , and time of the -train traveling WP at the same distance isSimilarly, time of the -train traveling WP at the distance is approximated asand time of the -train traveling WP at the distance isEmerging from WP, orthogonally polarized reference and sample trains are able to interfere on the conditions that: (1) their initial group delays are compensated in WP to , and (2) their orthogonal polarization states are recombined to a single linear polarization state to yield interference fringes. The latter interference condition is readily satisfied by means of the linear polarizer . Then, by analogy of birefringent interferometers,15 the fringe pattern with the best visibility will be localized in the plane shown by the dotted line inside WP in Fig. 1 (lower right). This plane is the locus of snap points of the sample and reference rays that are deflected after WP apart from each other at the angle . The first of the preceding interference conditions implies that the best interference contrast is achieved in the vicinities of and on the plane if Now, we define a theoretical interval of depth attainable in our scheme. After trivial algebraic manipulations of Eqs. 2, 3, 4, 5, 6, 7, we have The left side of Eq. 8 represents the double time of traveling the depth interval between interfaces and . Introducing the mean refraction index of the sample medium within the , we easily obtain from Eq. 8 In the general case, any range of the WP light aperture correlates to the following theoretical depth interval:It should be emphasized more particularly that the true decoupling between arms is ensured by orthogonality of polarization states of beams transmitted through each arm. The beams reflected from various interfaces in the sample become linearly polarized after passing through the polarizing beamsplitter PBS and then enter WP. Each of these partial beams travels the halves of WP either as an extraordinary or as an ordinary beam. These beams are not split by WP, but are deflected equally, and propagate as a whole beam. The latter cannot form by itself a spatially localized fringe pattern. In contrast to that, orthogonally polarized reference and sample beams are deflected in WP in opposite directions, as noted earlier. These beams intersect spatially, and after combining by polarization in the linear polarizer , yield a fringe pattern localized in the plane of WP, by some analogy with the Fresnel double-mirror experiment. Reflections between any virtual interfaces in the sample will contribute to this pattern, but incoherently. Therefore, the pattern will be devoid of autocorrelation artifacts that are intrinsic, e.g., to spectral domain OCT.20 This excludes additional corrections based on smart software21 or other contrivances.22 Obviously, if the -train together with the - or -train travel equal optical path lengths in MZI, they lead to a zero-order interference fringe in WPI. Location of this fringe corresponds to the equal wedge thicknesses in WP, i.e., positions where or . In some practical cases, the zero-order interference fringe should be shifted from the center of the WP aperture. For that, it is necessary to change the relative thicknesses of the wedges12 or insert in front or behind WP, a birefringent plate, which is cheaper.23 At the design stage, a required position of can be present beneath the sample surface by choosing the proper plate thickness. Also, the optical path length of the reference arm and the probing beam waist position should be optimized. Included in Eq. 10, values of for human skin24 and for calcite crystal25 are well known within a wide spectral range. Noteworthily, WP-type prisms based on three birefringent wedges have equivalent optical characteristics at smaller and therefore provide better quality of the fringe pattern.26 A slight slope of the plane relative to the faces of WP is less in the three- than the double- or the single-wedge devices. A considerable slope deteriorates a proper projection of the fringes onto the CCD plane. The slope can be eliminated in WP of special design,27 but we prefer to use standard componentry. The more practical solution is seen in slightly tilting a standard WP in the plane of beam splitting.28 2.3.Time Division of Polarization ComponentsStill referring to Fig. 1, consider the more general case. Let the linearly polarized probing light after double-pass traveling the sample acquire both the horizontal and the vertical intensity components of the polarization state. Orientations of these components are denoted by (↕) and (☉), respectively. In general, both sample birefringence and scattering influence the polarization state of the probing light. At submillimeter depths in normal human skin, linearly polarized incident light is maintained preferentially over circularly polarized light.29, 30 At larger depths, PS OCT with linearly polarized light may result in better detection sensitivity and reduction of systematic errors in birefringence measurement as compared with circularly polarized light.31 At submillimeter subcutaneous depths, especially with the use of PS OCT, contribution of scattering to polarization changes can be neglected.32, 33 Regardless of preference for either polarization, all emerged PS OCT topologies are based on the well-known concept of two independent polarization channels.34 The channels are discriminated through a spatial separation35, 36, 37, 38 or in combination with a software-based technique.39 Instead of the spatial separation, we propose a temporal separation, i.e., time division of polarization components. The idea consists in a high-speed alternate transmitting of either orthogonal polarization component through the same optical channel to the same detector. For that, the bistable half-wave switch is introduced in the sample arm of MZI. As shown schematically in Fig. 2 , based on the ferroelectric-liquid-crystal cell operates as an electrically switchable half-wave retarder.40 Diagrams of polarization states and optical axes and planes are represented in successive sections along the beam propagation from left to right. Reversing the polarity of dc low voltage applied to changes orientation of its principal axis exactly from one steady state at to another state at and back. Being sufficiently achromatic, transforms the incoming polarization state, elliptical in the general case, to an intermediate polarization ellipse. The latter holds the same shape but is the mirror of the incoming ellipse about the principal axis activated at the moment. in combination with PBS works both as a discriminator and an accurate discrete modulator of incoming polarization state components and . The discrete modulation is more advantageous than a continuous one since it has less fringe washout during lateral scanning.38 Functional testing of the commercial model LV2500-OEM (Displaytech, Inc.) predesigned as gave us polarization modulation depth up to for incoming light from SLD with the central wavelength of the spectral band . For this device, the typical time of transition between two steady optical states is specified as short as tens of microseconds, and the maximum permissible frequency of modulation is . Fig. 2Alternate transmitting the orthogonal polarization components of the incoming polarization state. 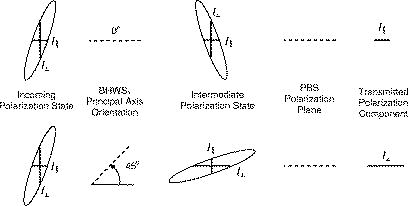 Thus, the mechanism of fringe formation for each of components and comes directly to the case we analyzed in the preceding section. It is also evident in Figs. 1 and 2 that to change by the principal axis orientation of the additional switch , identical to the phase of the reference beam will undergo the half-wave flip. Such modulation yields either in-phase or anti-phase fringes.15, 41, 42 At zero OPD, the in-phase fringes will exhibit positive peaks, and the anti-phase fringes will exhibit negative peaks of a noisy interference signal superimposed on a dc background . The background consists of a noncoherent stationary component and a constant bias caused, e.g., by dust particles. This background does not interfere and is independent of the polarization. In addition, it is assumed to be the same in both fringes and at least during the period of modulation, As seen in Eqs. 11, 12, when subtracting the anti-phase fringes from the in-phase fringes , the background is suppressed and the interference signal is added. The resultant fringe pattern is expressed as the following:Although this fringe pattern still contains the initial noise, suppression of the noncoherent stationary component and the constant bias promotes better fringe visibility and performance reliability. Seemingly, some analogy with a balanced detection43 can be drawn for such a technique.3.Experimental Validation3.1.Balancing of ArmsNoteworthily, some experimental findings are added to elaborate the initial design.13 As is known, the intensity of the beam backscattered from most biological tissues is a few orders of magnitude less than the incident beam intensity.44 That is why the reference arm intensity should be attenuated by two or more orders of magnitude to improve the signal-to-noise ratio.45 As seen in Fig. 1, the reference channel of MZI uses no traditional means to attenuate the reference beam intensity. This function is fulfilled successfully with the linear polarizer . Basically, this optical element serves to combine by polarization the reference and sample beams that propagate in WP either as ordinary or extraordinary beams. On the other hand, smooth rotation azimuthally of allows reciprocal balancing of intensity between the arms with any ratio from 0 to 1. In particular, such an original technique enables easier control of the fringe pattern contrast. 3.2.Projection of FringesTo increase still more the optical efficiency of our scheme, the projection system comprises cylindrical lenses and arranged as shown in Fig. 1. projects on CCD the fringe pattern localized inside WP. “condenses” more light across the length of the linear CCD array.15, 26 A spherical objective lens used instead of would not give both an effective condensing and a sharp imaging with variable magnification. The reason is the intrinsic astigmatism of such a system.46 Since and are crossed at , they form the so-called anamorphic lens system. It is the optimal solution in our particular case inasmuch as the fringe direction is orthogonal to the length of the linear CCD array. Figure 3 illustrates a fragment of the fringe pattern formed using an alignment red laser. The pattern is projected with fourfold magnification from the plane inside WP onto the plane of the expected location of the CCD. Magnification could vary optionally. For comparison, sizes of a single pixel are shown on the right side. The pattern looks somewhat distorted because it is taken using self-made magnifying optics and an amateur camera (Samsung KENOX S500). Nevertheless, the picture is evidence of the dramatically increased optical throughput due to making use of the anamorphic lens system. Also, such an approach may be helpful to the spectrometer design used in spectral domain OCT systems. 3.3.“Rule of Thumb”Figure 4 illustrates the hardware layout of the experimental setup based on the tandem interferometer assembled according to the optical schematic in Fig. 1. It is worthy of notice that the interferometer does not contain high-precision translational stages for lateral positioning, in contrast to the systems of spectral domain PS OCT with two optical channels.38, 47, 48 Nevertheless, due to exploiting a single optical channel and a single detector, the interferometer alignment was relatively straightforward, although additional efforts were required to manipulate bulk optics. On the other hand, bulk optics makes assembling of unique configurations in some respects more flexible. The interferometer structure comprises commercially available optical components that are sufficiently achromatic and have high polarization contrast in the spectral range of SLD (Inphenix Corp.). The central wavelength of SLD is near to the maximal spectral response of the exploited linear CCD array, in particular, model AViiVA M4 (Atmel Corp.). The total number of pixels , and the pixel width with fill factor close to unity. As shown here, is a crucial parameter that determines the theoretically attainable depth interval given by Eq. 10. To establish a practical relationship between and , a kind of rule of thumb can be derived from the following considerations. Using previous notations, the spatial period of fringes inside WP is expressed with the well-known formula49 where is the angle of beam splitting for WP. Combining Eqs. 14, 10 yieldsAssume , where is the full light aperture of WP projected with magnification onto the full physical length of the linear CCD array. Suppose also that is a spatial frequency of sampling defined as a number of pixels per fringe period of the projected pattern. Under these assumptions, the following obvious relationships are valid and manipulation of Eqs. 15, 16 gives finallyThus, the attainable depth interval is determined only by the total number of pixels , the central wavelength , the spatial frequency of fringe sampling , and the mean refraction index of the sample medium within this interval. The rule of thumb expressed with Eq. 17 is valid for estimation of the properly attainable value of , provided the WP aperture is effectively filled with the light beam and projected onto the full length of the linear CCD array. 3.4.Signal-to-Noise ConsiderationsCompare our solution with the interferometer introduced in L-OCT50 and based on the principle similar to Young’s two-pinhole experiment. Although our interferometer differs conceptually from the preceeding, the common feature of both interferometers is that the fringe pattern is formed spatially and projected on a linear CCD array for further readout. An important point is that the attainable depth interval obeys the same Eq. 17 for both interferometers.50 is spatially evolved along the full physical length of the linear CCD array. is scanned electronically during the CCD readout time . It is equivalent to the mechanical scanning of with some velocity . For L-OCT and time-domain OCT (TD, OCT), the approximate signal-to-noise ratios in the case of shot-noise-limited detection of analog signals are expressed with similar equations50 where is the total photon flow incident on the CCD array from the sample arm. It is worthy of special notice that Eq. 18 is valid for our system as well. As is known, TD OCT may exhibit superior performance with respect to , especially in turbid media. Therefore, in spite of the simplified consideration, the analogy with TD OCT still makes L-OCT and our solution promising for probing the nontransparent tissues. In general, PS OCT is able to achieve sufficient for mapping cumulative (macroscopic) birefringence of skin with the reasonable resolution at submillimeter depths.11 Involvement of polarization-preserving fiber optics44 as well as the replacement, with time, of CCD by complementary metal-oxide semiconductor (CMOS)16 would contribute to our system performance.3.5.Comparison of Theory and ExperimentFigure 5 shows the fringe pattern resulting from the interference between the recombined orthogonally polarized reference beam and sample beam in our experimental setup. The sample beam is reflected from the polarization insensitive silver mirror. While translating the mirror along the optical axis of the sample arm, the pattern shifted along the array. Making use of the anamorphic projection and the reciprocal balancing described earlier facilitated obtaining the distinct interference pattern superimposed on a dc background. The pattern is somewhat affected by air turbulences and parasitic interference fringes typical of a Mach-Zehnder interferometer based on bulk optics.51 Exploiting of single-mode fiber optics would suppress these artifacts and smooth the fringe pattern due to spatial filtering.52 Replacing the silver mirror with a coverglass plate (Menzel Gläser GmbH) of thickness , measured with a caliper resolution of , yielded two separate fringe patterns spaced apart and produced by reflections from each of the plate surfaces. As expected, the patterns moved synchronously with shifting of the plate. The distance between the main peaks of the patterns remained the same. This is in accordance with the basic properties of the tandem interferometer revealed earlier. A standard two-element Wollaston prism (CVI Corp.) made of calcite was used as WP and had . The roughly estimated distance between the experimentally observable peaks gave the number of pixels . The magnification was calculated from the thick lens formula applied to the cylindrical lens of model CKX038 (Newport Corp.). Using the evident relationship and substitution of Eqs. 14, 20 into Eq. 15 yieldsAfter substitution into Eq. 21 of the known numerical values and assuming for the used coverglass plate,53 we obtained finally . This is in a good agreement with the plate thickness , which we gauged directly using the caliper.From the fringe envelope subjected to bandpass filtering, we obtained of SLD. This was about and correlates well with the theoretical value evaluated for free-space from the spectral characteristics of SLD, i.e., and corresponding to full width at half maximum (FWHM) of the spectrum approximated with a Gaussian profile. This decisive experiment is plain but indispensable evidence of the ability of the embodied interferometer to decouple between arms by polarization and under the given resolution to “sense at once,” without mechanical A-scans, any reflective interface fallen into the attainable depth interval. According to the derived rule of thumb, at typical of the human skin24 and , i.e., the one-and-half Nyquist frequency, the commercial cameras AViiVA with linear array formats 4k, 6k, and 8k are well suited for submillimeter depth intervals , , and , respectively. The interferometer design allows presetting these intervals of interest further beneath the superficial layers, e.g., behind the epidermal-dermal junction of human skin. To distinguish between the normal and depleted collagen contents in dermis only through measurements of and , a phenomenological model of depolarization is evolved here. 4.Depolarization in Dermis4.1.Phenomenological ModelIn dermal layers, collagen fibrils are packed in collagen bundles and have lamellae structure.54 The finely woven meshwork of reticular collagen fibers is typical of the upper dermis, whereas thick, coarse collagen bundles are the main feature of the deeper layers. In respect to crystal optics, collagen fibrils in skin are nothing but liquid-crystal structures with typical sizes varying from nano- to micrometric scales.55 Human skin biopsies show that birefringent crystalline fibers of collagen, however, are woven in dermis layers more or less chaotically but arranged mainly parallel to the skin surface. With relation to polarimetry and in particular PS OCT, a lamella can be considered as a linear tiny retarder in which slow and fast axes lie, respectively, parallel and perpendicular to the fibril direction.56 Noteworthily, known from the literature a birefringence model of PS OCT for human cornea is based on a stack of thin birefringent lamellae with two preferential, nearly orthogonal orientations, superimposed on a background of lamellae with random orientation.57, 58 The lamellae in the human dermis have a much more disordered structure than in the cornea. Can a great many chaotically oriented collagen lamellae be considered as a single object that still displays birefringent properties? To answer this question, we referred to the theory of light depolarization in a statistical system of parallel crystal plates.59 The theory well interprets depolarization of light for crystallizing polyethylene of high density.60 In general, the lamellar microstructure of collagen in the dermis looks, in our thinking, rather close to crystalline morphology of such polyethylene,61, 62 although birefringence values differ almost by one order of magnitude.63, 64 Consider a single lamella of thickness and optical birefringence , placed between crossed polarizer and analyzer. The optical axis of the lamella is oriented azimuthally at the angle with respect to the polarizer. From the theory of compensators, provided absorption and spectral dispersion are negligible, the intensities of probing light with a center wavelength transmitted through the analyzer parallel and perpendicular to the polarizer are in the ratio corrected for scattering65 where is the optical retardation of the individual lamella. Figure 6 shows a statistical system of lamellae chaotically oriented azimuthally but arranged parallel to any cross section of the probing light beam. For such a system, the afore-mentioned theory65 yields the depolarization ratio of transmitted lightwhere is a variable similar to that in Eq. 23 but averaged over the ensemble of , and is the average number of lamellae encountered on the total path of the light beam with the cross section defined by the circle in Fig. 6. In the strict sense, the depolarization term is not a unique function of material quantities involved in Eq. 23 but depends also on statistical distribution both of lamella sizes and concentration.65For purposes of further analysis, still hypothesize the validity of decoupling the . Suppose that in Eq. 23, variables and are already averaged values, and substitute for in Eq. 24. Obviously, for measurement of and with the PS OCT system shown in Fig. 1, the polarization plane of should be preset at . A probing light beam returning from the dermis depth will undergo depolarization on the double rather than the single pass. Therefore, we have to intuitively suppose the validity also of the optical reciprocity principle.66 Further, assume that the collagen lamellae have average interspacing between layers. Suppose also that the average number of the lamellae per unit cross-section area of the probing beam is and the beam radius is . Now, there is no difficulty to come from Eqs. 23, 24 to where is the depth of the epidermis-dermis interface form which the dermis displays noticeable birefringent properties, i.e., has . As shown here, the algorithm based on measurements and is able to identify inferior margins of simulated tumor.4.2.Estimation AlgorithmConsider a computational “phantom” simulating a dermis-like medium with realistic optical characteristics given in Table 1 . The values of parameters and are close to those given in Ref. 67; , , and are taken, Refs. 54, 68, 69; and and are typical of PS OCT. First, imitate a rise of lamella density with depth for normal dermis as In Eq. 24, is the maximal concentration attainable far beyond the depth of interest, and is some depth in upper dermis with lamella concentration , where is the base of the natural logarithm. The depolarization ratio calculated from Eq. 25 for this case is shown by the upper curve in Fig. 7 .Fig. 7The calculated depolarization ratio as a function of depth in the dermis phantom with normal (upper curve) and depleted (bottom curve) collagen content.  Table 1Design parameters of the computational dermis-like phantom.
Assume that a simulated tumor invades in dermis to the depth of and depletes the lamella concentration to the level of homogeneously throughout the tumor volume. The homogeneity is a quite admissible assumption because, e.g., the early melanoma has a compact tumor,70 and on the other hand, a tumor of smaller size has more homogeneous structure.71 The choice of the levels is caused just by simplicity of the exponential presentation. For this “depletion” case, the depolarization ratio is reduced considerably, as shown by the bottom curve in Fig. 7. In addition the curve of undergoes an upward bend at the inferior margin of the simulated tumor. Qualitatively, these peculiarities resemble the decrease in cumulative birefringence and the similar bend that were demonstrated with PS OCT by Strasswimmer for basal cell carcinoma of nodular type with ulceration.10 Seemingly, the difference is only in the form of birefringence presentation—through either the depolarization ratio or the averaged phase retardation. The averaging over A-scans along a lateral direction is efficient because it takes into account a difference between macroscopic and microscopic distribution of lamellae orientation from site to site on the skin.55, 72 With respect to our approach based on the depolarization ratio, it means a possibility to use probing beams with larger radii although small enough to sufficiently resolve tumor lateral margins. Additionally, it may shorten the time needed for lateral scanning. The relationship 24 can be considered as the intensity-based algorithm for simplified characterization of collagen depletion in dermis through comparative mapping of the depolarization ratio for abnormal and perilesional regions of skin. 5.Conclusion and Future WorkAn experimental proof-of-concept is presented for the original tandem interferometer. The tandem interferometer comprises the sensing Mach-Zehnder interferometer, whose arms are decoupled by polarization, and the receiving interferometer based on a Wollaston-type prism. The prism evolves immediately and unambiguously the depth range in the sample into the spatial fringe pattern, which is scanned electronically by a linear CCD array. The tandem interferometer is intended for a PS OCT system with the following features: only one channel for detection of orthogonal polarization intensities, no mechanical A-scanning, and compatibility with polarization-preserving fibers. Due to these features, the system seems applicable to nonlaboratory conditions with external perturbations. Also, a phenomenological model is evolved from the theory of depolarization of light in crystalline polymers. The simplified algorithm derived from the model uses the measured orthogonal polarization intensities for mapping margins of collagen depletion regions. Preliminary computational results correlate qualitatively with experimental observations known from the literature. In the optical schematic shown in Fig. 1, the sections of optical paths defined by , , and are devised specifically with the possibility of exploiting polarization-preserving fibers in minimal combination with bulk optics. These fibers will be integrated in a flexible, advantageously shielded cable. The cable should couple a handheld head of the optical probe to the main unit of the system. However, this is a challenge to our further research and development. One of the expected engineering issues is the coupling efficiency of interconnections between small-core fibers and bulk optics. Fortunately, commercially available polarization-maintaining fibers possess sufficient stability of polarization-preserving properties with respect to bending, twisting, tension, and temperature changes, which was proved in the severe field environment.73 In addition to these properties, single polarization fibers combine high polarization extinction with an exclusively wide spectral band.74 This makes them prospective candidates for fiber-based PS OCT. AcknowledgmentsThis work was supported in part by Grant No. 10023577 from the Ministry of Commerce, Industry, and Energy, and within the APRI-Research Program of GIST funded by the Ministry of Science and Technology of Korea. ReferencesA. P. Ivanov,
A. P. Chaikovskii, and
A. A. Kumeisha,
“New method for high-range resolution measurements of light scattering in optically dense inhomogeneous media,”
Opt. Lett., 1
(6), 226
–228
(1977). 0146-9592 Google Scholar
D. Huang,
E. A. Swanson,
C. P. Lin,
J. S. Schuman,
W. G. Stinson,
W. Chang,
M. R. Hee,
T. Flotte,
K. Gregory,
C. A. Puliafito, and
J. G. Fujimoto,
“Optical coherence tomography,”
Science, 254 1178
–1181
(1991). https://doi.org/10.1126/science.1957169 0036-8075 Google Scholar
J. F. de Boer,
“Systems and methods for imaging a sample,”
(2006). Google Scholar
A. Knuttel and
M. Boehlau-Godau,
“Spatially confined and temporally resolved refractive index and scattering evaluation in human skin performed with optical coherence tomography,”
J. Biomed. Opt., 5
(1), 83
–92
(2000). https://doi.org/10.1117/1.429972 1083-3668 Google Scholar
W. Drexler,
“Ultrahigh-resolution optical coherence tomography,”
J. Biomed. Opt., 9
(1), 47
–74
(2004). https://doi.org/10.1117/1.1629679 1083-3668 Google Scholar
M. J. Koehler,
K. König,
P. Elsner,
R. Bückle, and
M. Kaatz,
“In vivo assessment of human skin aging by multiphoton laser scanning tomography,”
Opt. Lett., 31
(19), 2879
–2881
(2006). https://doi.org/10.1364/OL.31.002879 0146-9592 Google Scholar
U. Leiter,
P. G. Buettner,
T. K. Eigentler, and
C. Garbe,
“Prognostic factors of thin cutaneous melanoma: an analysis of the central malignant melanoma registry of the German Dermatological Society,”
J. Clin. Oncol., 22 3660
–3667
(2004). 0732-183X Google Scholar
C. Constanzo,
I. T. Jackson,
C. McEwan, and
J. M. Self,
“Desmoplastie malignant melanoma: an aggressive tumor,”
Eur. J. Plast. Surg., 9 137
–140
(1987). Google Scholar
P. Henriet,
Z.-D. Zhong,
P. C. Brooks,
K. I. Weinberg, and
Y. A. DeClerck,
“Contact with fibrillar collagen inhibits melanoma cell proliferation by up-regulating ,”
Proc. Natl. Acad. Sci. U.S.A., 97 10026
–10031
(2000). https://doi.org/10.1073/pnas.170290997 0027-8424 Google Scholar
J. Strasswimmer,
M. C. Pierce,
B. H. Park,
V. Neel, and
J. F. de Boer,
“Polarization-sensitive optical coherence tomography of invasive basal cell carcinoma,”
J. Biomed. Opt., 9
(2), 292
–298
(2004). https://doi.org/10.1117/1.1644118 1083-3668 Google Scholar
R. V. Kuranov,
V. V. Sapozhnikova,
I. V. Turchin,
E. V. Zagainova,
V. M. Gelikonov,
L. B. Snopova, and
N. N. Prodanetz,
“Complementary use of cross-polarization and standard OCT for differential diagnosis of pathological tissues,”
Opt. Express, 10
(15), 707
–713
(2002). 1094-4087 Google Scholar
V. Tugbaev and
R. Myllyla,
“Feasibility of a compact fiberoptic probe for real time tracing of subsurface skin birefringence,”
Proc. SPIE, 5861 M10
–19
(2005). 0277-786X Google Scholar
V. Tougbaev,
T. J. Eom,
C.-S. Kee,
D.-K. Ko, and
J. Lee,
“Polarization sensitive optical coherence tomography for application conditions with external perturbations,”
Proc. SPIE, 6535 H1
–10
(2007). 0277-786X Google Scholar
V. Tougbaev,
T. J. Eom,
W. Shin,
Y. L. Lee,
B.-A. Yu,
C.-S. Kee,
D.-K. Ko, and
J. Lee,
“Depth-resolved simplified characterization of collagen depletion in dermis with polarization sensitive optical coherence tomography applicable to nonlaboratory conditions,”
Proc. SPIE, 6627 66271U
(2007). https://doi.org/10.1117/12.728190 0277-786X Google Scholar
S. Minami,
“Fourier transform spectroscopy using image sensors,”
Mikrochim. Acta, 93 309
–324
(1987). 0026-3672 Google Scholar
P. Koch,
V. Hellemanns, and
G. Hüttmann,
“Linear optical coherence tomography system with extended measurement range,”
Opt. Lett., 31
(19), 2882
–2884
(2006). 0146-9592 Google Scholar
E. N. Leith,
“Reflections on the origin and subsequent course of holography,”
Proc. SPIE, 5005 431
–438
(2003). 0277-786X Google Scholar
J. D. C. Jones,
“Interferometry and polarimetry for optical sensing,”
The Handbook of Opt. Fibre Sens. Tech., 227
–245 John Wiley & Sons Ltd.(2002). Google Scholar
G. Duplain,
“Optical sensor using low-coherence interferometry,”
(2006). Google Scholar
A. Szkulmowska,
M. Wojtkowski,
I. Gorczynska,
T. Bajraszewskil,
M. Szkulmowskil,
P. Targowskil,
A. Kowalczyk, and
J. J. Kaluzny,
“Coherent noise-free ophthalmic imaging by spectral optical coherence tomography,”
J. Phys. D, 38 2606
–2611
(2005). https://doi.org/10.1088/0022-3727/38/15/011 0022-3727 Google Scholar
R. K. Wang and
Z. Ma,
“A practical approach to eliminate autocorrelation artefacts for volume-rate spectral domain optical coherence tomography,”
Phys. Med. Biol., 51 3231
–3239
(2006). https://doi.org/10.1088/0031-9155/51/12/015 0031-9155 Google Scholar
J. Ai and
L. V. Wang,
“Spectral-domain optical coherence tomography: removal of autocorrelation using an optical switch,”
Appl. Phys. Lett., 88 111115
(2006). https://doi.org/10.1063/1.2186520 0003-6951 Google Scholar
J. Ma and
W. J. Bock,
“White-light fringe restoration and high-precision central fringe tracking using frequency filters and Fourier-transform pair,”
IEEE Trans. Instrum. Meas., 54
(5), 2007
–2012
(2005). 0018-9456 Google Scholar
H. Ding,
J. Q. Lu,
W. A. Wooden,
P. J. Kragel, and
X.-H. Hu,
“Refractive indices of human skin tissues at eight wavelengths and estimated dispersion relations between 300 and ,”
Phys. Med. Biol., 51 1479
–1489
(2006). https://doi.org/10.1088/0031-9155/51/6/008 0031-9155 Google Scholar
G. Ghosh,
“Dispersion-equation coefficients for the refractive index and birefringence of calcite and quartz crystals,”
Opt. Commun., 163 95
–102
(1999). https://doi.org/10.1016/S0030-4018(99)00091-7 0030-4018 Google Scholar
V. Tugbaev,
“Polarization interferometer for visible Fourier transform spectrometer of static type,”
Proc. SPIE, 2089 292
–293
(1994). 0277-786X Google Scholar
C. C. Montarou and
T. K. Gaylord,
“Analysis and design of modified Wollaston prisms,”
Appl. Opt., 38
(31), 6604
–6616
(1999). 0003-6935 Google Scholar
M. C. Simon,
“Wollaston prism with large split angle,”
Appl. Opt., 25
(3), 369
–376
(1986). 0003-6935 Google Scholar
V. Sankaran, J. T. Walsh Jr., D. J. Maitland,
“Comparative study of polarized light propagation in biologic tissues,”
J. Biomed. Opt., 7
(3), 300
–306
(2002). https://doi.org/10.1117/1.1483318 1083-3668 Google Scholar
V. V. Tuchin,
“Optical properties of tissues with strong (multiple) scattering,”
Tissue Optics: Light Scattering Methods and Instruments for Medical Diagnosis, 13
–33
(2000) Google Scholar
W.-C. Kuo,
H.-J. Huang,
C.-M. Lai,
G.-J. Jan, and
C. Chou,
“Polarization-sensitive optical coherence tomography using only linearly polarized light,”
Opt. Quantum Electron., 37
(13–15), 1213
–1223
(2005). https://doi.org/10.1007/s11082-005-4193-6 0306-8919 Google Scholar
G. Jarry and
F. Henry,
“Anisotropy and multiple scattering in thick mammalian tissues,”
J. Opt. Soc. Am. A, 17
(1), 149
–153
(2000). 0740-3232 Google Scholar
S. Jiao,
G. Yao, and
L. V. Wang,
“Depth-resolved two-dimensional Stokes vectors of backscattered light and Mueller matrices of biological tissue measured with optical coherence tomography,”
Appl. Opt., 39
(34), 6318
–6324
(2000). 0003-6935 Google Scholar
M. R. Hee,
D. Huang,
E. A. Swanson,
J. G. Fujimoto,
“Polarization-sensitive low-coherence reflectometer for birefringence characterization and ranging,”
J. Opt. Soc. Am. B, 9
(6), 903
–908
(1992). 0740-3224 Google Scholar
J. F. de Boer,
S. M. Srinivas,
A. Malekafzali,
Z. Chen, and
J. S. Nelson,
“Imaging thermally damaged tissue by polarization sensitive optical coherence tomography,”
Opt. Express, 3
(6), 212
–218
(1998). 1094-4087 Google Scholar
C. K. Hitzenberger,
E. Götzinger,
M. Sticker,
M. Pircher, and
A. F. Fercher,
“Measurement and imaging of birefringence and optic axis orientation by phase-resolved polarization sensitive optical coherence tomography,”
Opt. Express, 9
(13), 780
–790
(2001). 1094-4087 Google Scholar
R. G. Cucu,
A. Gh. Podoleanu,
R. B. Rosen,
A. B. Boxer, and
D. A. Jackson,
“En face polarization sensitive optical coherence tomography,”
Proc. SPIE, 5140 113
–119
(2003). https://doi.org/10.1117/12.500779 0277-786X Google Scholar
M. Yamanari,
S. Makita,
V. D. Madjarova,
T. Yatagai, and
Y. Yasuno,
“Fiber-based polarization-sensitive Fourier domain optical coherence tomography using B-scan-oriented polarization modulation method,”
Opt. Express, 14
(14), 6502
–6515
(2006). https://doi.org/10.1364/OE.14.006502 1094-4087 Google Scholar
C. Fan,
Y. Wang, and
R. K. Wang,
“Spectral domain polarization sensitive optical coherence tomography achieved by single camera detection,”
Opt. Express, 15
(13), 7950
–7961
(2007). https://doi.org/10.1364/OE.15.007950 1094-4087 Google Scholar
N. F. Hartman,
T. K. Gaylord,
T. J. Drabik, and
M. A. Handschy,
“Phase stability of ferroelectric liquid crystals upon repeated switching and static temperature characteristics,”
Appl. Opt., 32
(20), 3720
–3725
(1993). 0003-6935 Google Scholar
G. Boer,
P. Ruffieux,
T. Scharf,
P. Seitz, and
R. Dändliker,
“Compact liquid-crystal-polymer Fourier-transform spectrometer,”
Appl. Opt., 43
(11), 2201
–2208
(2004). https://doi.org/10.1364/AO.43.002201 0003-6935 Google Scholar
A. R. Harvey,
“Determination of the optical constants of thin films in the visible by static dispersive Fourier transform spectroscopy,”
Rev. Sci. Instrum., 69
(10), 3649
–3658
(1998). https://doi.org/10.1063/1.1149154 0034-6748 Google Scholar
Y. Zhou,
M. J. Everett, and
M. Hacker,
“High efficiency balanced detection interferometer,”
(2006). Google Scholar
H. D. Ford,
R. Beddows,
P. Casaubieilh, and
R. P. Tatam,
“Comparative signal-to-noise analysis of fiber-optic based optical coherence tomography systems,”
J. Mod. Opt., 52
(14), 1965
–1979
(2005). https://doi.org/10.1080/09500340500106774 0950-0340 Google Scholar
W. V. Sorin and
D. M. Baney,
“A simple intensity noise reduction technique for optical low-coherence reflectometry,”
IEEE Photonics Technol. Lett., 4
(12), 1404
–1406
(1992). https://doi.org/10.1109/68.180591 1041-1135 Google Scholar
J. Lewandowski and
L. Desjardins,
“Light sectioning with improved depth resolution using a cylindrical lens to magnify the line deformation,”
Proc. SPIE, 2348 227
–238
(1994). 0277-786X Google Scholar
E. Götzinger,
M. Pircher, and
C. K. Hitzenberger,
“High-speed spectral domain polarization sensitive optical coherence tomography of the human retina,”
Opt. Express, 13
(25), 10217
–10229
(2005). https://doi.org/10.1364/OPEX.13.010217 1094-4087 Google Scholar
B. H. Park,
M. C. Pierce,
B. Cense,
S.-H. Yun,
M. Mujat,
G. J. Tearney,
B. E. Bouma, and
J. F. de Boer,
“Real-time fiber-based multifunctional spectral-domain optical coherence tomography at ,”
Opt. Express, 13
(11), 3931
–3944
(2005). https://doi.org/10.1364/OPEX.13.003931 1094-4087 Google Scholar
J. Kemp,
X. Q. Jiang,
Y. N. Ning,
A. W. Palmer, and
K. T. V. Grattan,
“A displacement measurement system, utilizing a Wollaston interferometer,”
Opt. Laser Technol., 30 71
–75
(1998). 0030-3992 Google Scholar
C. Hauger,
M. Wörz, and
T. Hellmuth,
“Interferometer for optical coherence tomography,”
Appl. Opt., 42
(19), 3896
–3902
(2003). https://doi.org/10.1364/AO.42.003896 0003-6935 Google Scholar
J. M. Simon,
S. A. Comastri, and
R. M. Echarri,
“The Mach-Zehnder interferometer: examination of a volume by nonclassical localization plane shifting,”
J. Opt. Soc. Am. A, 3 242
–249
(2001). 0740-3232 Google Scholar
G. Huss,
P. Leproux,
F. Reynaud, and
V. Doya,
“Spatial filtering efficiency of single-mode optical fibers for stellar interferometry applications: phenomenological and numerical study,”
Opt. Commun., 244 209
–217
(2005). https://doi.org/10.1016/j.optcom.2004.09.060 0030-4018 Google Scholar
R. S. Pillai,
G. J. Brakenhoff, and
M. Müller,
“Analysis of the influence of spherical aberration from focusing through a dielectric slab in quantitative nonlinear optical susceptibility measurements using third-harmonic generation,”
Opt. Express, 14
(1), 260
–269
(2006). https://doi.org/10.1364/OPEX.14.000260 1094-4087 Google Scholar
A. N. Bashkatov,
E. A. Genina,
V. I. Kochubey, and
V. V. Tuchin,
“Optical properties of human skin, subcutaneous, and mucous tissues in the wavelength range from ,”
J. Phys. D, 38 2543
–2555
(2005). https://doi.org/10.1088/0022-3727/38/15/004 0022-3727 Google Scholar
I. A. Brown,
“Scanning electron microscopy of human dermal fibrous tissue,”
J. Anat., 113
(2), 159
–168
(1972). 0021-8782 Google Scholar
M. G. Ducros,
J. F. de Boer,
H.-E. Huang,
L. C. Chao,
Z. Chen,
J. S. Nelson,
T. E. Milner, and
H. G. Rylander,
“Polarization sensitive optical coherence tomography of the rabbit eye,”
IEEE J. Sel. Top. Quantum Electron., 5
(4), 1159
–1167
(1999). https://doi.org/10.1109/2944.796342 1077-260X Google Scholar
R. H. Newton and
K. M. Meek,
“The integration of the corneal limbal fibrils in the human eye,”
Biophys. J., 75 2508
–2512
(1998). 0006-3495 Google Scholar
A. Daxer and
P. Fratzl,
“Collagen fibril orientation in the human corneal stroma and its implication in keratoconus,”
Invest. Ophthalmol. Visual Sci., 38 121
–129
(1997). 0146-0404 Google Scholar
A. Ziabicki and
B. Misztal-Faraj,
“Applicability of light depolarization technique to crystallization studies,”
Polymer, 46 2395
–2403
(2005). 0032-3861 Google Scholar
A. Ziabicki and
B. Misztal-Faraj,
“Interpretation of light depolarization data in terms of polymer crystallinity,”
Mater. Sci., 24
(2/2), 493
–505
(2006). 0137-1339 Google Scholar
S. Sasaki,
Y. Sakaki,
A. Takahara, and
T. Kajiyama,
“Microscopic lamellar organization in high-density polyethylene banded spherulites studied by scanning probe microscopy,”
Polymer, 43 3441
–3446
(2002). 0032-3861 Google Scholar
D. Eglin,
G. Mosser,
M.-M. Giraud-Guille,
J. Livage, and
T. Coradin,
“Type I collagen, a versatile liquid crystal biological template for silica structuration from nano- to microscopic scales,”
Soft Mater., 1 129
–131
(2005). 1539-445X Google Scholar
R. Kuranov,
V. Sapozhnikova,
L. Snopova,
G. Gelikonov, and
A. Morozov,
“Investigation of biological tissues using PM-fiber based polarization sensitive optical coherence tomography,”
Proc. SPIE, 5316 314
–323
(2004). 0277-786X Google Scholar
B. L. Evans,
“The optical birefringence of injection-moulded polystyrene and polyethylene,”
J. Mater. Sci., 24 3588
–3598
(1989). https://doi.org/10.1007/BF02385744 0022-2461 Google Scholar
A. Ziabicki,
“Transmission of light through a statistical system of birefringent plates,”
J. Opt. Soc. Am. A, 7 774
–782
(2005). 0740-3232 Google Scholar
R. J. Potton,
“Reciprocity in optics,”
Rep. Prog. Phys., 67 717
–754
(2004). https://doi.org/10.1088/0034-4885/67/5/R03 0034-4885 Google Scholar
D. Y. Churmakov,
I. V. Meglinski,
S. A. Piletsky, and
D. A. Greenhalgh,
“Analysis of skin tissues spatial fluorescence distribution by the Monte Carlo simulation,”
J. Phys. D, 36 1722
–1728
(2003). https://doi.org/10.1088/0022-3727/36/14/311 0022-3727 Google Scholar
I. S. Saidi,
S. L. Jacques, and
F. K. Tittel,
“Mie and Rayleigh modeling of visible-light scattering in neonatal skin,”
Appl. Opt., 34
(31), 7410
–7418
(1995). 0003-6935 Google Scholar
D. Sampson,
“Trends and prospects for optical coherence tomography,”
Proc. SPIE, 5502 51
–58
(2004). 0277-786X Google Scholar
G. Häusler and
M. W. Lindner,
“‘Coherence radar’ and ‘Spectral Radar’—new tools for dermatological diagnosis,”
J. Biomed. Opt., 3
(1), 21
–31
(1998). https://doi.org/10.1117/1.429899 1083-3668 Google Scholar
S. D. Nathanson,
P. Anaya,
M. Avery,
F. W. Hetzel,
T. Sarantou, and
S. Havstad,
“Sentinel lymph node metastasis in experimental melanoma: relationships among primary tumor size, lymphatic vessel diameter and 99mTc-Labeled human serum albumin clearance,”
Ann. Surg. Oncol., 4
(2), 161
–168
(1997). 1068-9265 Google Scholar
T. Yasui,
Y. Tohno, and
T. Araki,
“Characterization of collagen orientation in human dermis by two-dimensional second-harmonic-generation polarimetry,”
J. Biomed. Opt., 9
(2), 259
–264
(2004). https://doi.org/10.1117/1.1644116 1083-3668 Google Scholar
Y. Sasaki,
T. Hosaka, and
J. Noda,
“Polarization-maintaining optical fibers used for a laser diode redundancy system in a submarine optical repeater,”
J. Lightwave Technol., LT-2
(6), 816
–823
(1984). 0733-8724 Google Scholar
M.-J. Li,
X. Chen,
D. A. Nolan,
G. E. Berkey,
J. Wang,
W. A. Wood, and
L. A. Zenteno,
“High bandwidth single polarization fiber with elliptical central air hole,”
J. Lightwave Technol., 23
(11), 3454
–3460
(2005). https://doi.org/10.1109/JLT.2005.855856 0733-8724 Google Scholar
|


