
|
|
1.IntroductionIn vivo confocal microendoscopes provide high resolution cellular imaging in a relatively small package. This minimally invasive technique provides instant visualization of tissue and allows pathologists to make a diagnosis in situ without having to use traditional tissue extraction biopsy methods. Confocal microendoscopy can be performed in reflectance1, 2 or fluorescence3, 4, 5, 6, 7, 8 modes. However, most confocal microendoscopes are designed for fluorescence imaging and record the integrated fluorescence signal in a single image. Confocal microendoscopy has been used for the detection and diagnosis of diseases in a broad variety of organs such as cervix,2 colon,3 oral cavity,7 esophagus,8 and ovary.9 We have previously reported on the design and demonstration of several confocal microendoscope systems. The grayscale imaging mode of our confocal microendoscope has shown significant promise as a diagnostic instrument, and a laparoscopic version is currently being used to investigate ovarian cancer in an in vivo clinical trial. The details of the grayscale confocal microendoscope, and the general concept of multispectral confocal microendoscopy, have been presented in previous publications.10, 11, 12, 13, 14 Our current confocal microendoscope is a modification of a previous system, in which a new multispectral imaging mode has been implemented. The multispectral mode of operation provides additional diagnostic information by measuring the fluorescence signal as a function of wavelength. To our knowledge, there is only one other confocal microendoscope capable of spectral data acquisition.15 This system provides full spatial resolution in two distinct spectral ranges and also provides full spectral information averaged over the entire field of view. Our multispectral confocal microendoscope can provide full spectra associated with every image point. Applications for the multispectral confocal microendoscope include the detection of disease by providing unique diagnostic information using tissue or organelle-specific fluorophores with specific spectral properties. The purpose of this work is to describe the design of the multispectral imaging mode of our confocal microendoscope and demonstrate the capabilities of the system as a clinical diagnostic instrument. First, the current grayscale mode of operation is described in terms of system design, performance, and results. Then, a detailed description of the multispectral mode of operation is given, including the tools associated with presenting the multispectral data. Finally, preliminary multispectral imaging results obtained from biological specimens are presented. 2.Design of the System2.1.Grayscale Imaging ModeFigure 1 shows the layout of the confocal microendoscope in grayscale mode.11 A diode-pumped solid-state laser (Coherent, Santa Clara, California) is used as the excitation source. A line of illumination, formed by spherical and cylindrical lenses, is coupled into the proximal end of the catheter by a microscope objective (Leeds Precision Instruments, Minncapolis, Minnesotre). A 30,000 element coherent fiber bundle (Sumitomo Electric USA, Torrance, California) transmits the illumination profile to the distal end of the fiber, which is imaged into the tissue by a miniature objective. A focus mechanism enables focus control down to below the tissue surface. Scan mirror 1 sweeps the illumination profile across the field of view. Fluorescence light from the sample is collected back into the system via the miniature objective and fiber bundle, and separated from the reflected illumination by a dichroic beamsplitter (Chroma Technology Corporation, Rockingham, Vermont). The fluorescence light is then focused onto the confocal slit aperture, which rejects light from out-of-focus planes and provides the optical sectioning (confocal) capability of the system. A second scan mirror, placed between two lenses, images the light passing through the confocal slit onto a charge-coupled device (CCD) camera (Photometrics, Tucson, Arizona). The two scan mirrors are synchronized to provide correspondence between the illumination profile in the tissue and the detection profile on the CCD. Figure 2 shows a picture of the confocal microendoscope system.11 Fig. 1Layout of the confocal microendoscope. The orthogonal view shows the illumination path from the direction for which the cylindrical lens has optical power. 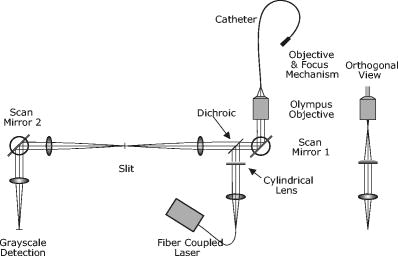 In operation, the distal end of the catheter is placed in contact with the sample and a small amount of fluorescent dye ( per image) is delivered to the area of interest. The user adjusts the focus of the catheter, and images are collected by the computer for processing and/or subsequent analysis. 2.2.Multispectral Imaging Mode2.2.1.Layout of the multispectral channelThe layout of the multispectral mode is shown in Fig. 3 . The novel design requires nothing more than a BK7 prism (OptoSigma, Santa Ana, California) located away from the optical axis. The off-axis position enables us to leave the prism in a fixed position that does not disturb the beam path in grayscale mode. The system switches rapidly between the two modes of operation (grayscale and multispectral) in less than half a second. To switch from grayscale to multispectral imaging mode, the computer-controlled galvo mirror (scan mirror 2) is rotated to a fixed position. The fluorescence signal, reflected by this mirror, is dispersed by the prism and focused on the CCD camera at different spatial locations according to wavelength. For each position of the first scan mirror (scan mirror 1), the system records the 2-D light signal pattern on the CCD, which has one spatial dimension (along the slit direction) and one spectral dimension (perpendicular to the slit direction). Repeating this process (reading out a frame of data from the 2-D detector) for every position of the first scan mirror allows one to reconstruct a 3-D data cube that consists of two spatial dimensions and one spectral dimension. The prism is adjusted for minimum deviation to simplify the design and the theoretical modeling of the system. This configuration also yields a simple way of aligning the prism in the system. The orientation of the prism and the incidence angle of the beam on the prism entrance face are such that the central wavelength, , is imaged to the center of the CCD detector at minimum deviation. In other words, the signal comes out of the prism parallel to the optical axis. The diameter of the camera lens ( focal length and entrance pupil) is large enough to collect the dispersed beam from the prism. Fig. 3Grayscale (a) and multispectral (b) beam paths. Shorter wavelengths exit the prism with the largest deviation angle. Dispersed light is focused on the CCD camera. The position on the detector is directly related to wavelength. Mirror 2 is stationary in the multispectral mode of operation.  A calibration procedure employing a theoretical dispersion profile is used to map detector pixels to wavelength. The details of the calibration procedure are discussed in the next section. 2.2.2.Tools used in the multispectral modeMultspectral data cubeAs discussed in the previous section, the camera records one spatial dimension and one spectral dimension for each orientation of scan mirror 1. Figure 4 shows images obtained from three different positions of scan mirror 1. The amplitude of the mirror is set to sweep the illumination line over the full field of the fiberoptic imaging bundle. The frequency of the mirror is adjusted so that the camera acquires 512 frames in a single sweep. Collection of a full dataset takes roughly and results in a data cube consisting of spatial pixels and 150 spectral pixels. Fig. 4Relationship between spatial location (top graphs) and spectral frames (bottom graphs). The lines in the upper images represent the slit illumination profile as it scans across the axis of the field of view. The lower images show the dispersion introduced by the prism at the selected scanning positions. 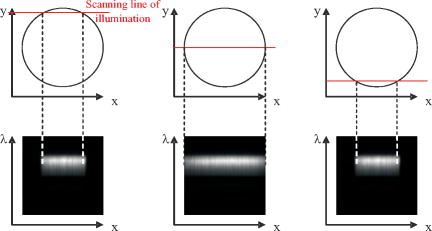 Display softwareCustom software was developed to aid in the display and analysis of the 3-D multispectral data cube. Figure 5 shows a screenshot of this software when the confocal microendoscope was back illuminated by a white light source filtered down to a spectral range. The main window shows the 2-D spatial distribution of the sample at a specific wavelength, while the side windows show the distribution of one spatial dimension as a function of wavelength. At the bottom, the software displays the full spectrum associated with the current cursor location. Fig. 5Image of the illuminated fiber bundle using a lamp with a optical filter. (a) Cross-section planes of the data cube and (b) spectrum of the image point indicated by a white cross. The intensity is unitless because it is scaled relatively to the maximum intensity in the image. 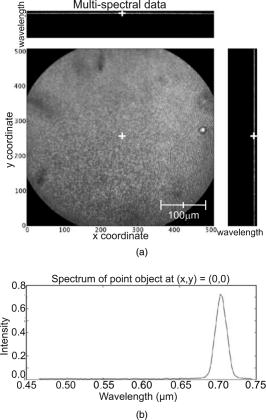 The program is fully interactive; a mouse click anywhere on the 2-D image in the main window will plot the spectrum associated with that point and update the side windows to show the spectral information along the horizontal and vertical lines through the selected point. A mouse click on one of the side windows will display, in the main window, the 2-D spatial distribution of the 3-D data cube at the specified wavelength. Wavelength calibration procedureTo plot the spectrum associated with a given spatial point in the image (bottom plot of the display program), it is necessary to determine the relationship between CCD pixel position and wavelength. The fixed tilt angle of mirror 2 and the rotation angle of the prism define the incident angle of the light on the prism surface. Given the incident angle of light on a prism of wedge angle and index of refraction , the deviation angle produced by the prism is given by The deviation angle varies with wavelength because the index of refraction of the prism is wavelength dependent. This property is well described by the Sellmeier equation for the BK7 glass in the prism. The deviation and the angles and are related to the incident angle of the light entering the camera. The pixel offset on the CCD is given by the relationshipwhere is the number of pixels offset from the optical axis, is the pixel size, is the focal length of the camera lens, and is the angle of incidence on the camera lens. Using Eq. 2, the Sellmeier equation, and the various parameters of the system, it is possible to numerically invert Eq. 1 to determine wavelength as a function of pixel offset or . Through this numerical inversion, a lookup table can be generated to precisely convert CCD pixel offset to wavelength.In practice, a multispectral calibration image is collected using a narrowband optical filter (e.g., Fig. 5). The calibration routine looks for the maximum intensity in the reference 3-D data cube and records its spectral value in terms of pixel number on the CCD. The program then uses this information, along with a pixel offset lookup table, derived by the method just described, to determine the correspondence between wavelength and pixel position for the entire CCD. 3.System Performance and Results3.1.Performance of the SystemThe slit-scan confocal microendoscope uses a catheter based on a fiber optic imaging bundle. The pixilated fiber bundle acts as a sampling system with a center-to-center pixel spacing. In terms of the spatial resolution, the effect of the fiber bundle may be modeled as a convolution of the object with the pixel function. This model predicts a theoretical tissue-space lateral resolution of and a theoretical tissue-space axial resolution of using our -diam distal objective with a magnification of 1.5 from tissue to fiber.13 The confocal microendoscope provides the same spatial resolution in both multispectral and grayscale imaging modes. Spatial resolution was measured, based on the full width at half maximum (FWHM) of the point spread function (PSF), by Rouse 10 to be roughly lateral and axial resolution over a field of view of . The confocal microendoscope is able to focus down to a depth of in the tissue. For the experimental results shown thereafter, the depth of observation is not precisely known. Images were acquired by focusing on the tissue surface. The optical power incident on the surface of the tissue is typically less than . This yields a power density over the field of view of roughly . The camera used in the multispectral confocal microendoscope is a Photometrics Cascade II CCD (Photometrics, Tucson, Arizona) with a detector matrix. Each detector element is . The camera is capable of recording 30 images per second, so a 3-D dataset consisting of 150 spectral samples is collected in about . Methods to increase the collection speed are presented in Sec. 4. Spectral resolution is defined as the minimum resolvable wavelength difference. In our system, the theoretical spectral linewidth is determined by the convolution of the geometrical image of the slit on the detector, the camera pixel function, and the PSF of the camera lens. The theoretical FWHM of the spectral linewidth is and does not change significantly with wavelength within our spectral bandwidth. The spacing between two resolvable wavelengths is then approximately 2 camera pixels. This spacing can be correlated to a change in wavelength using the wavelength calibration procedure described. Because refractive index is a nonlinear function of wavelength, the dispersion of light through the prism is not constant. Consequently, the spectral resolution is not constant with wavelength. Our system achieves a spectral resolution of at a wavelength of and at a wavelength of . Table 1 shows the spectral resolution with respect to wavelength at intervals of . At this stage of the system development, the recorded spectra are not corrected for the camera spectral sensitivity. Table 1Wavelength-dependent spectral resolution.
3.2.Results from Grayscale ImagingThe grayscale imaging mode of the confocal microendoscope has been used to investigate a wide variety of human and animal tissues. The results presented here were obtained through topical administration of acridine orange (AO) (Invitrogen, Eugene, Oregon), which is a vital dye that stains DNA and RNA. Figure 6 shows an ensemble of grayscale confocal microendoscope images obtained from excised human tissues and in a mouse11 that was sacrificed immediately prior to an in situ experiment. For each biological sample, about of AO ( of concentration) was applied to the tissue surface. Imaging was started almost immediately. Fig. 6Grayscale results from excised human tissues and in situ animal tissues. (a) Normal appearing epithelium of human ovary, (b) unusual area of human ovary, (c) normal tissue of human esophagus, (d) human Barrett’s esophagus, (e) peritoneal wall of a mouse, and (f) liver of a mouse. 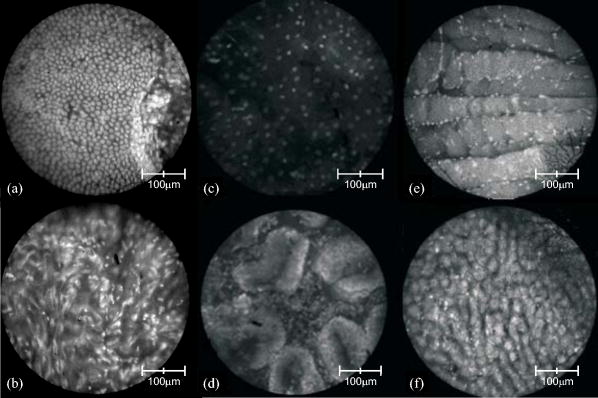 Figures 6a and 6b show results obtained from excised human ovary. One can clearly visualize significant differences between the two images. Figure 6a shows a uniform layer of cells, which is typical for healthy ovarian epithelium. Figure 6b shows an abnormal pattern of cells that is indicative of pathology. These data were histologically verified as normal for Fig. 6a and cancerous for Fig. 6b. Figures 6c and 6d show images obtained from excised human esophagus. The sample in Fig. 6c was diagnosed as normal squamous epithelium, while the sample in Fig. 6d was diagnosed as Barrett’s esophagus, which is a common precursor to esophageal adenocarcinoma. The sparse punctate nuclei of Fig. 6c and the glandular structure of Fig. 6d are in agreement with the histological findings. The images presented in Figs. 6a, 6b, 6c, 6d were collected over several experiments and as such, the absolute brightness and contrast between images should not be compared. Figures 6e and 6f show images of mouse peritoneal wall and liver, respectively. The animal used in this experiment was considered healthy, and no specific abnormalities were observed in the images. 3.3.Results from Multispectral ImagingPreliminary multispectral imaging experiments were performed using a phantom containing a mixture of -diam microspheres (Invitrogen, Eugene, OR) with different spectral properties. Figure 7 shows images of these microspheres at two different spectral planes of the multispectral data cube. Fig. 7Fluorescence images from microspheres at wavelength (a) and (b) , and spectra associated with image point indicated by the white cross. 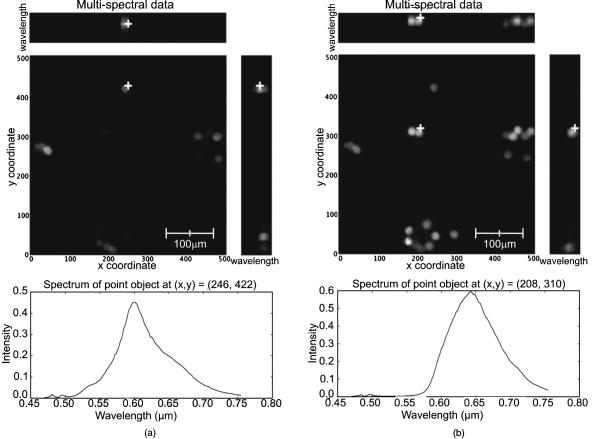 Some beads are visible at (a) that are not visible at (b). The difference in the spectra shows that two groups of microspheres are present in the sample. The first group has a peak emission around , while the second group has a peak emission at . Figure 8 shows multispectral data obtained from an excised human esophagus stained with AO. This biological sample was from a patient diagnosed with Barrett’s esophagus. Several drops of AO ( of concentration) were topically applied to the tissue. Imaging was initiated almost immediately and continued for roughly . The left image shows a low wavelength emission at , while the right image shows a high wavelength emission at . Different structured features are observed at the different wavelengths. This is also visible on the side windows (representing one spatial dimension as a function of wavelength), where the intensity distribution varies depending on the wavelength and exhibits two broad spectral regions of fluorescence. The spectrum at the bottom of each image is plotted for the point in the image indicated by the white cross. The presence of two distinct spectral structures is confirmed by the dual peaked spectra. Although the tissue is from a patient with Barrett’s esophagus, typical glandular structures of Barrett’s [see Fig. 6d] were not observed for this sample (not even in a slide made from this tissue and viewed with a standard microscope), and a normal-looking distribution of squamous epithelium corresponding to nuclei are visible at the low wavelength. At the high wavelength, a uniformly distributed bright region is caused by the fluorescence from cellular cytoplasm. Nuclei are still visible in the background. Some dark areas correspond to the voids left by blood vessels that were washed off in the process of biopsy. AO typically shows green fluorescence in the nuclei and red fluorescence in the cytoplasm when excited at . However, the peak and linewidth of AO’s fluorescence spectrum varies depending on the pH in the tissue and the concentrations of the solvent and other cellular structures.16, 17, 18 Fig. 8Human Barrett’s esophagus tissue stained with AO (a) at a low wavelength and (b) at a higher wavelength. The spectrum associated with the image point indicated by the white cross is displayed below each image. 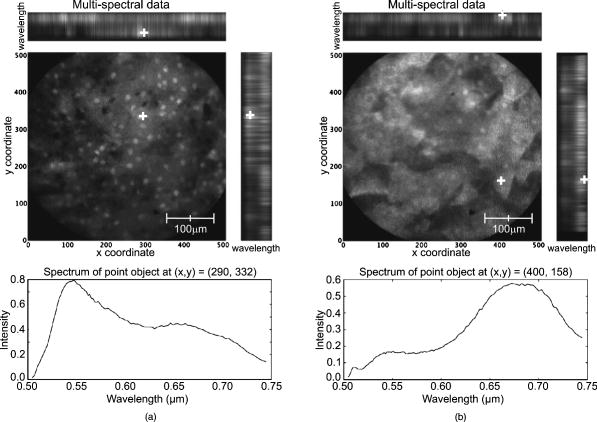 Figure 9 shows images of the peritoneal wall of a mouse stained with AO and obtained in situ. The mouse was sacrificed prior to the experiment and opened up to allow insertion of the catheter. A few drops of AO ( of concentration) was deposited on the peritoneal wall. We started imaging about one minute later and continued for approximately total. Again, some structures are visible at the higher wavelength , but not at the lower wavelength . These organelles might be lysosomes. The spectra associated with the cursor location are also shown; the spectrum on the left has a peak around , while the spectrum on the right, corresponding to the organelles, exhibits a peak around . Thus different aspects of the tissues are distinguishable through their emission spectra. Fig. 9In situ images of the peritoneal wall of a mouse stained with AO at different wavelengths, (a) and (b) . The spectrum associated with the image point indicated by the white cross is displayed below each image.  Figure 10 shows data obtained from a rat intestine after tagging it with DiA. DiA is a fluorophore that is used to label cytoplasmic membranes, with a peak emission at and a peak excitation at (Invitrogen, Eugene, Oregon). Tissues were topically stained with DiA at a concentration of . Different structures are observed when scanning from low to high wavelengths (from left to right in Fig. 10). The spectra associated with these structures are plotted below the corresponding images and also confirm the presence of different staining patterns. The left spectrum has a broad peak in the 610-to-640-nm range, while the spectrum in the other two images shows a broad peak in the 660-to-710-nm range. Fig. 10Rat intestine stained with DiA at a (a) low wavelength, (b) intermediate wavelength, and (c) high wavelength. 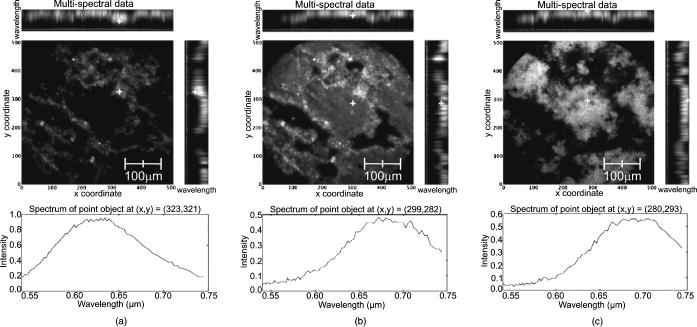 The images demonstrate that the multispectral confocal microendoscope can differentiate different tissue types and provide high quality images across the whole field of view. Moreover, the automated data acquisition system and processing software that has been developed yield spectral information that has the potential to provide additional in vivo diagnostic information. As a consequence, distinct elements of a given tissue sample can be highlighted based on spectral differences in their fluorescence properties. 4.DiscussionThe multispectral confocal microendoscope has been dramatically improved compared to a previous design.12, 13 The current system has fewer than half the components of the older system, making it more compact, robust, and mobile with less risk of misalignment. The reduction in complexity also increases the throughput of the system as well as the overall optical performance. The dual scan-mirror design allows the implementation of both grayscale and multispectral imaging capability using a single CCD camera. The system is capable of rapidly switching between the two imaging modes of operation simply by tilting the second scan mirror to a fixed position, scanning the first mirror more slowly, and collecting data in multiple frames. The multispectral mode of operation was designed to collect data over a spectral range of approximately with a spectral resolution of better than across this range. The spectral resolution of the system could be increased by using a prism made from glass with higher dispersion. For instance, using F2 glass instead of BK7, one could theoretically achieve a spectral resolution of at and at , which is about a two-fold improvement in spectral resolution. The price to be paid is the readout of a larger area of the CCD and a roughly two-fold increase in data collection time. There are constraints imposed by the off-axis prism design for the multispectral mode of operation. The deviated beam coming out of the prism has to fall within the entrance pupil of the camera lens, and the spread of angles caused by the prism has to remain within the angular field of view imposed by the size of the CCD and the imaging optics. A focal length f/2.8 lens was used to satisfy these constraints. As an alternative configuration, the prism could be replaced by a diffraction grating. A higher spectral resolution could be achieved that would remain constant with respect to wavelength. However, the simple off-axis design would not work and the grating would need to be translated into the beam. This would require a more complex mechanical system and a slightly longer transition time between grayscale and multispectral imaging modes. A grating-based design would also suffer from slightly reduced light efficiency. In the current system, collection of the full multispectral dataset takes a significant amount of time (about ). Motion of the sample during data acquisition leads to image distortions. However, the contact imaging catheter is quite stable during in vivo experiments, which allows us to collect high quality multispectral data. The speed of acquisition can be increased in several ways. One could choose a reduced number of spectral samples around a specific spectral region of interest, or set up the camera to bin in the spectral dimension. Cameras are available (e.g., Computer Modules Incorporation, San Diego, California) that operate at several thousand frames per second. However, a shorter data collection time would lead to a decrease in signal-to-noise ratio (SNR), assuming the same illumination level and dye concentration. There is clearly a tradeoff between multispectral data acquisition time, motion sensitivity, and SNR that should be carefully evaluated for each specific application. The results obtained from the multispectral mode of operation are quite promising, and further investigation of additional dyes that stain specific cellular components is warranted. The use of multiple dyes and perhaps multiple excitation sources could yield even more useful spectral information. Data postprocessing, incorporating spectral unmixing, could provide more quantitative information. Morphological changes in cellular structure could be monitored via multispectral data collection. For example, measurement of nuclear-to-cytoplasmic ratio in cells could be accomplished using dyes that label the cell nucleus and cytoplasm with different spectral emission characteristics. This could be accomplished with multiple dyes or a single dye, such as acridine orange. Measurement of morphologic changes might be useful for early cancer detection, where loss of tissue organization and enlarged nuclei are markers of dysplasia. One issue of concern is that the dyes used in these experiments, AO and DiA, are not approved for use in humans. We are currently carrying out an animal safety study to assess the potential toxicity and mutagenicity of AO. Acriflavine hydrochloride, which is a homolog of AO, has been used for in vivo human imaging in Europe and Australia.3 AO has also been used during photodynamic therapy to treat synovial sarcoma (soft tissue tumors) on human patients in Japan.19 There are clearly many applications of multispectral fluorescence measurement in biological monitoring and diagnosis. The multispectral imaging mode of the confocal microendoscope is a flexible and powerful feature of the system that will extend the range of applications as well as the system performance in those applications. 5.ConclusionsIn this project, a confocal microendoscope system that can collect grayscale images in real time is upgraded by adding a multispectral imaging channel. The system is able to rapidly switch from grayscale imaging mode to collecting spatially resolved spectral information. Software to control the system and interactively display the multispectral information is also developed. The grayscale imaging mode of the confocal microendoscope has routinely provided high quality results and is currently involved in early stage in vivo clinical trials. The multispectral imaging mode of the confocal microendoscope produces excellent preliminary results. It has the same optical characteristics as the grayscale imaging mode in terms of spatial resolution, and enables the acquisition of high quality spatially localized spectra. The multispectral mode of the confocal microendoscope may be able to provide important diagnostic information in vivo. By using tissue or organelle-specific fluorophores with unique spectral properties, multispectral imaging can separate signal from different cellular compartments and provide unique diagnostic information. AcknowledgmentsThe authors would like to thank Molly Brewer at the Arizona Health Sciences Center (AHSC) and Richard Sampliner at the Veterans Administration Hospital in Tucson for the clinical collaborations; and Christie Howison at the AHSC for providing the small animals. This research work was supported by NIH grants CA73095 and CA115780, and ADCRC grant 9711. ReferencesK. Carlson,
M. Chidley,
K. B. Sung,
M. Descours,
A. Gillenwater,
M. Follen, and
R. Richards-Kortum,
“In vivo fiber-optic confocal reflectance microscope with an injection-molded plastic miniature objective lens,”
Appl. Opt., 44
(10), 1792
–1797
(2005). https://doi.org/10.1364/AO.44.001792 0003-6935 Google Scholar
K.-B. Sung,
C. Liang,
M. Descours,
T. Collier,
M. Follen, and
R. Richards-Kortum,
“Fiber-optic confocal reflectance microscope with miniature objective for in vivo imaging of human tissues,”
IEEE Trans. Biomed. Eng., 49
(10), 1168
–1172
(2002). https://doi.org/10.1109/TBME.2002.803524 0018-9294 Google Scholar
R. Kiesslich,
J. Burg,
M. Vieth,
J. Gnaendiger,
M. Enders,
P. Delaney,
A. Polglase,
W. McLaren,
D. Janell,
S. Thomas,
B. Nafe,
P. R. Galle, and
M. F. Neurath,
“Confocal laser endoscopy for diagnosing intraepithelial neoplasias and colorectal cancer in vivo,”
Gastroenterology, 127
(3), 706
–713
(2004). https://doi.org/10.1053/j.gastro.2004.06.050 0016-5085 Google Scholar
A. Perchant,
G. Le Goualher,
M. Genet,
B. Viellerobe, and
F. Berier,
“An integrated fibered confocal microscopy system for in vivo and in situ fluorescence imaging–applications to endoscopy in small animal imaging,”
692
–695 Google Scholar
E. Laemmel,
M. Genet,
G. Le Goualher,
A. Perchant,
J. F. Le Gargasson, and
E. Vicaut,
“Fibered confocal fluorescence microscopy (Cell-viZio™) facilitates extended imaging in the field of microcirculation,”
J. Vasc. Res., 41 400
–411
(2004). https://doi.org/10.1159/000081209 1018-1172 Google Scholar
L. Thiberville,
S. Moreno-Swirc,
T. Vercauteren,
E. Peltier,
C. Cavé, and
G. Bourg-Heckly,
“In vivo imaging of the bronchial wall microstructure using fibered confocal fluorescence microscopy,”
Am. J. Resp. Crit. Care Med., 175 22
–31
(2007). 1073-449X Google Scholar
P. S. P. Thong,
M. Olivo,
K. W. Kho,
W. Zheng,
K. Mancer,
M. Harris, and
K. C. Soo,
“Laser confocal endomicroscopy as a novel technique for fluorescence diagnostic imaging of the oral cavity,”
J. Biomed. Opt., 12
(1), 014007
(2007). https://doi.org/10.1117/1.2710193 1083-3668 Google Scholar
M. Goetz,
A. Hoffman,
P. R. Galle,
M. F. Neurath, and
R. Kiesslich,
“Confocal laser endoscopy: new approach to the early diagnosis of tumours of the esophagus and stomach,”
Future Oncol., 2
(4), 469
–476
(2006). Google Scholar
M. A. Brewer,
U. Utzinger,
J. K. Barton,
J. B. Hoying,
N. D. Kirkpatrick,
W. R. Brands,
J. R. Davis,
K. Hunt,
S. J. Stevens, and
A. F. Gmitro,
“Imaging of the ovary,”
Technol. Cancer Res. Treat., 3
(6), 617
–627
(2004). 1533-0346 Google Scholar
A. R. Rouse,
A. Kano,
J. A. Udovich,
S. M. Kroto, and
A. F. Gmitro,
“Design and demonstration of a miniature catheter for a confocal microendoscope,”
Appl. Opt., 43
(31), 5763
–5771
(2004). https://doi.org/10.1364/AO.43.005763 0003-6935 Google Scholar
A. R. Rouse,
A. A. Tanbakuchi,
J. A. Udovich, and
A. F. Gmitro,
“Design of an in vivo multi-spectral confocal microendoscope for clinical trials,”
Proc. SPIE, 6082 15
–22
(2006). 0277-786X Google Scholar
Y. S. Sabharwal,
A. R. Rouse,
L. Donaldson,
M. F. Hopkins, and
A. F. Gmitro,
“Slit-scanning confocal microendoscope for high resolution in vivo imaging,”
Appl. Opt., 38
(34), 7133
–7144
(1999). https://doi.org/10.1364/AO.38.007133 0003-6935 Google Scholar
A. R. Rouse and
A. F. Gmitro,
“Multispectral imaging with a confocal microendoscope,”
Opt. Lett., 25
(23), 1708
–1710
(2000). https://doi.org/10.1364/OL.25.001708 0146-9592 Google Scholar
A. R. Rouse,
J. A. Udovich, and
A. F. Gmitro,
“In vivo multi-spectral confocal microscopy,”
Proc. SPIE, 5701 73
–84
(2005). 0277-786X Google Scholar
F. Jean,
G. Bourg-Heckly, and
B. Viellerobe,
“Fibered confocal spectroscopy and multicolor imaging system for in vivo fluorescence analysis,”
Opt. Express, 15
(7), 4008
–4017
(2007). https://doi.org/10.1364/OE.15.004008 1094-4087 Google Scholar
C. Millot,
J. M. Millot,
H. Morjani,
A. Desplaces, and
M. Manfait,
“Characterization of acidic vesicles in multidrug-resistant and sensitive cancer cells by acridine orange staining and confocal microspectrofluorometry,”
J. Histochem. Cytochem., 45
(9), 1255
–1264
(1997). 0022-1554 Google Scholar
J. Kapuscinski,
Z. Darzynkiewicz, and
M. R. Melamed,
“Interactions of acridine orange with nucleic acids. Properties of complexes of acridine orange with single stranded ribonucleic acid,”
Biochem. Pharmacol., 32 3679
–3694
(1983). 0006-2952 Google Scholar
A. V. Zelenin,
“Fluorescence microscopy of lysosomes and related structures in living cells,”
Nature (London), 212 425
–426
(1966). 0028-0836 Google Scholar
K. Kusuzaki,
“Clinical outcome of a novel photodynamic therapy technique using acridine orange for synovial sarcomas,”
Photochem. Photobiol., 81 705
–709
(2005). 0031-8655 Google Scholar
|


