
|
|
1.IntroductionOsteoarthritis is a widespread, painful, and debilitating joint disease characterized by the degeneration and eventual loss of the cartilage from the joint surface. Healthy cartilage has a well-ordered structure, containing few cells, but an extensive extracellular matrix comprising a network of collagen fibers immersed in an amorphous, highly hydrated gel rich in proteoglycans (see Fig. 1 ). This structure is lost as the disease progresses, and many lines of research into its pathophysiology and treatment are critically dependent on the development of techniques for quantifying these changes.1, 2 Particular interest attaches to the organization of the network of collagen fibers that are the principal determinant of the structure, and associated mechanical properties that are central to the biomechanical function of the tissue and a number of physical methods have been applied to this problem. Polarized light microscopy, small and wide-angle x-ray scattering, and polarization sensitive optical coherence tomography (PSOCT) have been employed in a number of important and revealing studies.3, 4, 5 The latter has the great attraction, because it can provide depth imaging on tissue attached to subchondral bone, thus opening the prospect of imaging in the intact joint. However, the depth and lateral resolution of PSOCT are too low to address many structural issues pertinent to cartilage pathophysiology, and in the present work, we investigate the ability of multiphoton microscopy to fulfill this need. Fig. 1A schematic diagram showing the different zones found in transverse sections of articular cartilage. The left-hand image represents the collagen fiber arrangements within the tissue, and the right-hand side shows changes in cell shape and arrangement that have been observed to occur with depth in the cartilage. Cartilage thickness is typically , depending on the species and joint examined.  Multiphoton microscopy has been applied to biological systems ranging from living cells6, 7 to whole tissues.8, 9and even living organisms,10 and it has a number of inherent advantages. Its nonlinearity allows the use of infrared excitation wavelengths that maximize tissue penetration while maintaining intrinsically high spatial resolution.11 It relies on two nonlinear processes that do not require the introduction of exogenous probe molecules or fixation and staining of the tissue. The first is two-photon fluorescence (TPF). A number of endogenous fluorophores have been identified in cells12 and, particularly relevant to the present study, the extracellular matrix,13 although their characterization is still incomplete. The second mechanism, second harmonic generation (SHG), occurs in molecules that do not possess inversion symmetry. It is again fortunate for the study of the extracellular matrix that collagen fibers are a strong source of SHG, although the mechanisms of its generation are still under debate.14, 15 The SHG signal is polarization sensitive and its intensity depends on the angle between the fibers and the polarization of the exciting radiation. This relationship has been explored in a number of studies on rat tail tendon,15, 16, 17, 18, 19 a tissue that is composed primarily of highly ordered fibrils of type-I collagen. To a first approximation, the maximum signal intensity is generated when the polarization is parallel with the fiber axis, and the minimum intensity signal is generated when the polarization is perpendicular to the fiber axis. Therefore, polarization sensitivity studies of SHG from tissues can provide information on the fiber organization.20 Cartilage contains type-II collagen, which has important but small biochemical differences from type I and forms morphologically similar, but rather finer, fibers with a complex organization that varies through the depth of the cartilage, as shown in Fig. 1. This level of organization would lead to the expectation that the SHG from cartilage would be polarization sensitive, although a previous study only detected in diseased tissue where the collagen fiber organization had been disrupted.21 Further to explore this unexpected observation was the starting point of the present investigation. Variations in SHG polarization sensitivity with depth have previously been measured in tendons18, 22 and other tissues such as dentine, dermis and bone.22 The study investigates the polarization sensitivity with depth in tendon and cartilage, and also considers the effects of the biattenuance and birefringence of the overlying tissue on the measure polarization sensitivity curve. Our approach is based on comparisons of the variations in the polarization sensitivity of TPF and SHG with depth. We first study tendon as an example of a highly ordered collagenous structure whose birefringence and biattenuance have been characterized in some detail.3, 23 We then analyze normal cartilage and lesions in the equine metacarpophalangeal joint. This tissue was selected because its structure has been extensively characterized by other methods,3, 4 and the lesions that develop spontaneously share many of the characteristics of human disease.24 2.Materials and Methods2.1.MethodsThe experiments were carried using a home-built microscope, whose essential features are illustrated in Fig. 2 . A reflection mode configuration was chosen, as this enabled the en-face examination of cartilage samples still attached to the subchondral bone, minimizing the disruption of the collagen architecture. Excitation was at using a tuneable pulsed Ti:saphire laser with a repetition rate of (Spectra Physics, Mountain View, California, USA) The selection of the excitation wavelength was based on a number of considerations. Previous studies have produced conflicting results as to which wavelength most efficiently excites SHG in collagen,7, 25 but we found that in our system, the signal of both SHG and TPF peaked between 780 and , and the use of longer wavelengths increases tissue penetration and minimizes cellular damage.6 A 1.0-NA water dipping objective with a working distance was employed (Fluor ) and data acquisition was via a photon-counting photomultiplier tube and a PC-based photon counting card (Hamamatsu-Hamamatsu Japan). The laser fundamental was removed by a short pass dichroic beamsplitter (CVI laser, Albuquerque, New Mexico, USA) and a bandpass filter (CVI laser, Albuquerque, New Mexico, USA). Blocking of the fundamental was greater than 9 OD and the transmission of the TPF and SHG light about 30%. To change between SHG and TPF imaging, the filter directly below the PMT was changed, with a bandpass filter being used for TPF detection and a filter for SHG detection (CVI laser, Albuquerque, New Mexico, USA). For polarization measurements, two half wave plates were added to the system. The first wave plate (CVI laser, Albuquerque, New Mexico, USA) was placed before the dichroic beamsplitter, orientated to ensure that completely p-polarized entered the beamsplitter. The second (Meadow lark, Frederick, Colorado, USA) was placed directly behind the back aperture of the microscope objective to allow the polarization of the light incident on the sample to be rotated. This arrangement was necessary because our dichroic beamsplitter introduced differential phase-shifts between s and p-polarized states when used in a reflection mode, which would convert the incident linear polarization state to an elliptical state if the polarization was rotated before the dichroic. The photon-counting PMT used for the detection of the TPF and SHG signal was polarization insensitive, and therefore the effect the wave-plate had on the TPF light passing back through the objective would not affect the experimental results. Axial imaging was performed by raster scanning the beam using two scanning galvanometer mirrors (Cambridge Technologies Incorporated, Lexington, Massachusetts, USA). An axial scan was generated by moving the sample upward on a motor stage with an accuracy of about (Physik Instrumente, Palmbach, Germany). The field of view of the microscope objective allowed images up to to be acquired, the size being controlled by the voltage applied to the galvanometer mirrors. The images reported in this study were and composed of . The pixel dwell time was . The laser power used for imaging was approximately exiting the microscope objective. For the polarization sensitivity measurements, a power of was used for acquisition of surface images, but power was increased with scanning depth so that at depth, the power exiting the objective was . In polarization sensitivity experiments, the polarization of the light incident on the sample was rotated in steps using the half wave plate behind the microscope objective. The total intensity from the area scan was measured, and the intensities for each angle were combined to create the polarization sensitivity curve. This process was repeated at depth steps into the tissue of in tendon and healthy cartilage and in cartilage lesions. The depth steps were chosen as a compromise between collecting a very detailed dataset and minimizing the total scan time. 2.2.MaterialsTissue samples were obtained fresh from the abattoir, cartilage from the metacarpophalangeal joints and tendon from the deep flexor tendon of horses. The age of the samples was estimated by the abattoir staff and ranged from . Some samples were frozen prior to imaging, but this had no discernable effect on the images. At the laboratory, the joint was opened and a full depth plug of cartilage and several millimeters of subchondral bone was excised from the apex of the joint using a jeweller’s saw. During measurement, samples were maintained at room temperature and kept moist by immersion in saline. 3.Results and DiscussionThe first stage of the investigation was to examine the TPF and SHG signals generated from the surface layer of both tendon and cartilage. In the case of cartilage, we explored the variations in collagen fiber orientations within the imaging area by producing ratio images from the polarization sensitivity data. We then investigated signals emanating from deeper in the tissue, first in tendon, which constitutes a simple model system because its structure is uniform through the depth of the tissue, and then in cartilage. The final section reports data obtained from cartilage lesions. 3.1.Surface Measurements on Cartilage and TendonFigure 3 shows the angular variations in intensity of SHG and TPF at the surface of cartilage and tendon. The images were acquired at a depth of from the surface zone of fibers aligned parallel to the surface (Fig. 1). The polarization angle is defined as the angle between the collagen fiber and the polarization of the incident radiation, and in both tissues TPF varied only weakly with angle. The visibilities for tendon and cartilage were and , respectively, ( , measurements from five samples). Variations in the intensity with polarization angle were comparable in magnitude with the measurement noise. It therefore appears that TPF generation in both tissues does not have any significant intrinsic polarization sensitivity, or the generation is polarization sensitive but the sources are randomly orientated. As found by previous researchers,15, 16, 17, 18, 19 the SHG signal from tendon showed a strong polarization dependence, with the greatest intensity when the laser excitation was parallel with the collagen fibrils. The peak in the SHG signal corresponded with the long axis of the collagen fibers visible in the SHG images to within . The SHG signal from the cartilage surface also depended on polarization and had a period of , suggesting a preferred orientation of the collagen fibers in the superficial zone of the cartilage. Though this was not observed in previous studies on SHG from cartilage,21 it is consistent with well-established histological evidence.1, 26 Fig. 3Polarization sensitivity curves for both TPF and SHG taken at the surface in (a) cartilage and (b) tendon, with the axis showing the angle between the collagen fiber axis and the polarization of the laser fundamental. The intensities are normalized with respect to the mean intensity for each curve. Data were acquired at a depth of beneath the articular surface.  The visibility of the intensity-polarization angle plots was calculated as a measure of the degree of collagen fiber organization in the tissue. For tendon, the visibility was , and for cartilage the visibility was ( , measurements from six samples). These differences are consistent with the perceived differences in the level of collagen fiber organization in the two tissues, but different levels of intrafibrillar organization or optical properties between type-I and -II collagen may also contribute. To investigate whether there were differences in collagen fiber organization within the scanning area, we compared SHG images with the polarizer set to provide maximum signal with those with the polarizer rotated through . Representative images and the resulting ratio image are shown in Fig. 4 . Histological studies have described the pericellular matrix as basket-like and containing finer collagen fibrils.1, 26, 27 Therefore, we were expecting less polarization sensitivity and consequently a ratio close to 1 in these regions. However, these differences were not apparent in the ratio image, and although the ratio varied between 0.5 and 2 on a length scale of a few microns, the variations showed no obvious correlation with position. On the basis of these observations, it was felt that averaging over a image area was suitable for subsequent polarization sensitivity investigations. A smaller area will provide information on the collagen fiber arrangement on lower hierarchical levels instead of the zonal architecture described in Fig 1. Averaging over longer length scales is not required, as the polarization sensitivity results averaged over the image area are repeatable, and therefore a larger imaging area will produce the same results. Fig. 4SHG images acquired with the polarizer at the position of (a) maximum intensity and (b) rotated through , with the arrows indicating the polarization angle. (c) shows the ratio of the two images. The dark regions in (a) and (b) represent the locations of the chondrocytes. In the ratio image, these areas are circled. (Field , arrows indicate the polarization of the laser light.) The dark region in the top right quarter of the image represents an area where the polarization sensitivity varies from that found in the rest of the scan area.  3.2.Depth Variations in TendonTo determine how the effects of biattenuance and birefringence in the overlying tissues affected measurements of changes in polarization sensitivity with depth, we undertook an initial study on tendon, whose structure and fiber orientations are constant with depth and can be observed directly in the multiphoton images. The angular dependence of SHG and TPF was measured at depths up to and values averaged over a field in three samples are summarized in Fig. 5 . Although the orientation of the collagen fibers remained constant with depth, the SHG polarization sensitivity pattern changed dramatically with depth, as is shown in Fig. 5a. The TPF polarization sensitivity in Fig. 5b shows an increase with depth, with strong peaks in intensity appearing perpendicular to the collagen fiber orientations. This indicates that the optical properties of the overlying tissue are contributing to the measured patterns. Figures 5c and 5d show the natural log of the unnormalized data for the SHG and TPF polarization, respectively. These plots have been included because they show the attenuation of the light through the tissue. Fig. 5Polarization dependence of (a) SHG and (b)TPF in tendon at different depths [collagen fibers orientated at to the original incident beam polarization , intensities normalized by the mean intensity of the image field at each depth]. (c) and (d) show the natural log of the unnormalized polarization sensitivity. (e) shows the ratio of maximum intensity of the TPF/ the minimum intensity of the TPF as a function of depth in the tissue.  From the TPF data, it was possible to estimate an upper bound for the biattenuance of the tissue at the excitation wavelength. Surface imaging demonstrated that the TPF excitation efficiency has no intrinsic polarization sensitivity, which in turn suggests an isotropic orientation of fluorescence excitation dipoles within the focal volume. The variation in TPF emission at depth can thus be presumed to arise from “biattenuance” (a term introduced by Kemp 23 to describe differential absorption or scattering of the excitation and/or emitted light for different incident polarization states). Let us assume that the superficial layer contains a well-defined transmission axis such that field strengths of light linearly polarized parallel and perpendicular to this axis experience a differential attenuation coefficient given by , where is the biattenuance of the medium. Further, let us assume that these axes are coincident with the birefringence fast and slow axes of the superficial layer, i.e., we effectively assume that the superficial tissue can be described by a complex birefringence . Incident linearly polarized light aligned with either of these directions will thus remain polarized along these directions with increasing depth, and the differential attenuation of the excitation light between these directions will attain the maximum value. Linearly polarized light incident at other angles will undergo conversion to elliptical polarization states with increasing depth, and will thus experience an intermediate degree of attenuation. We thus identify the angles at which maximum and minimum TPF intensities occur as defining the directions of the fast and slow axes. Recalling that our detection system is polarization insensitive, if the emitted TPF were itself unpolarized, then the emitted light would propagate to the detector with equal efficiency, regardless of the polarization direction of the excitation light. We could then use the difference in the maximum and minimum TPF intensities to infer at the excitation wavelength a follows. Following Kemp, 23 we note that defines the ratio of the field strengths polarized along the two axes at a depth , such that Noting the TPF intensity scales as the fourth power of the field, the ratio of the emitted TPF fluxes is then described byThus, if the tissue has biattenuance, the ratio of the maximum to minimum intensity should increase exponentially with depth and a plot of versus would have a slope of , where unambiguously represents the biattenuance at the excitation wavelength, i.e., . We see from the data [Fig. 5e] that an exponential increase can be fitted to the first of the curves, but beyond this, the ratio remains constant or falls. The exponential increase appears quasi linear over this range due to the low value for the biattenuance of collagen. This may be because at these depths, the excitation light becomes depolarized due to scattering in the tissue,28 or the collagen fibers are no longer perfectly aligned. However, restricting the analysis to the most superficial , we fitted the data to the equationwhere is the depth into the tissue, is a factor to allow for any uncertainty in identifying the surface of the tendon, is the wavelength of the incident light, and is the biattenuance using Microcal Origin, Northampton, Massachusetts, USA. This gave a biattenuance of (range , for all fits), which is comparable with values measured for different types of tendon using polarization sensitive OCT (rat tail tendon , rat Achilles tendon , chicken patellofemoral tendon ).23These estimates represent only an upper bound for the biattenuance, however, because even with an isotropic distribution of fluorophores, the TPF may still be partially polarized. This is because the incident polarization vector will most efficiently excite parallel-aligned dipoles, resulting in the TPF being partially polarized in the direction of the incident laser polarization (unless the fluorophores rotate on a time scale fast compared with the fluorescence lifetime, which is unlikely in collagen).29 This means that the emitted light will be transmitted to the detector with different efficiencies for the two orthogonal polarization states, so that the intensity ratio will then depend on the value of at both the excitation and emission wavelengths. The precise relationship between our value and the true values at 400 and will depend on the degree of fluorescence anisotropy. This highlights the need for further research into not only identifying but also characterizing the properties of endogenous two-photon fluorophores. For the SHG, the pattern of polarization with depth in tendon represents the combined effects of the biattenuance, birefringence, and the intrinsic polarization sensitivity of the collagen SHG. Tendon is birefringent, with a higher refractive index for light polarized parallel to the collagen fibers.19 The birefringence is approximately 0.0045 for equine flexor tendon,3 indicating that a thickness of tendon would act as a whole wave plate at . It should be possible to use this information to recreate our polarization sensitivity patterns, using either a Jones or a Muller matrix (if scattering is found to be a significant effect) to describe the effects of the overlying tissue, and the Freund model16 to describe the polarization sensitivity of collagen fibers. However, the effects of beam geometry, such as varying interaction lengths and ray-to-fiber inclination angles across the beam profile, are likely to be significant for the large numerical aperture objective we employed, and it would be a nontrivial task to include these in the calculations. Such studies will form the basis of further work to be reported in the future. 3.3.Depth Variations in CartilageTPF and SHG polarization sensitivity data were taken on the same field in samples of healthy cartilage, and representative plots are shown in Fig. 6 . It proved possible to acquire data at depths up to . This region is marked on the histological section taken of the sample after imaging [Fig. 6e]. From this we can see it corresponds to the superficial and transitional zones shown in Fig. 1. The TPF polarization measurements were affected by photobleaching, and although exposure time was kept to a practical minimum, it was impossible entirely to eliminate the effect. The photobleaching in cartilage was a more significant effect than in tendon. This may indicate that a different fluorophore is responsible for the fluorescence in the two tissues, or that the differences in the extracellular matrix environment effect the photobleaching rates. In contrast to tendon, the TPF images did not show strong polarization sensitivity. At , four peaks were evident but their visibility was very small compared to that in tendon at a similar depth. It is therefore apparent that biattenuance is not as significant in cartilage as it is in tendon, and the structural bases of this difference require further investigation. If this is interpreted as a null result for detecting biattenuance in cartilage, we can place an upper bound for the possible biatteunance of by assuming that periodic variations should be at least two times greater than the variations due to noise or photobleaching. Fig. 6Polarization sensitivity with depth in cartilage, (a) SHG and (b) TPF (intensities normalized by the mean field intensity at each depth). (c) and (d) show the natural log of the unnormalized polarization sensitivity for SHG and TPF. (e) shows a histological section taken from the sample after the polarization sensitive measurements, viewed through crossed polarizers to reveal collagen organization.  The variation in SHG polarization with depth showed a clear repeatable pattern in all the normal samples of cartilage investigated. At the surface of the tissue, there were two intensity maxima, but at greater depths two additional peaks occurred between the original peaks. There was also an increase in visibility of the peaks with depth into the tissue. The depth at which the additional peaks appeared varied between 60 and in different samples. Relating the changes in polarization sensitivity with depth to fiber orientation is a more complex problem in cartilage than in tendon. In contrast to tendon, the birefringence and biattenuance properties of the tissue are likely to change with depth, and this level of complexity cannot simply be described by a single Jones or Muller matrix. In addition, the collagen fibers form a 3-D network, so the fibers in the deeper zones no longer lie in the imaging plane, and the larger the angle between the collagen fiber and the imaging plane, the weaker the polarization dependence and the weaker the SHG signal.19 It seems therefore that it will be necessary to develop a numerical model, perhaps based on measurements of biattenuance and birefringence, in a series of thin slices of cartilage at increasing depth into the tissue. 3.4.Cartilage LesionsSpontaneous lesions were found on the apex of a large number of the metacarpophalangeal joints examined. The histology of these lesions has been discussed in detail elsewhere.30 We report here on the detailed examination of three such lesions. Figure 7 shows paired TPF and SHG images taken from the surface of the cartilage in the histologically normal tissue close to the lesion, at the periphery of the lesion, and in the center of the lesion. The former images are very similar to those described earlier and reported by previous authors.21, 31 At the periphery of the lesion, where the histology showed an intact surface but a loss of zonal structure, the TPF images appeared normal, but the SHG images showed abnormally high signal intensities from the pericellular matrix. In the core of the lesion, there were far fewer cells and the matrix also appeared abnormal with a rippling effect clearly visible. The rippling appears more strongly in the SHG than the TPF and so can be confidently ascribed to a collagen abnormality. Ratio images emphasized the difference in the pericellular matrix between the normal tissue and the tissue peripheral to the lesion, with the ratio of SHG/TPF much greater in the pericellular matrix at the periphery of the lesion. Fig. 7Cartilage lesion. (a) SHG and TPF images taken from a region away from the center of the lesion, which appeared normal in histological sections. (b) Images from the periphery of the lesion, showing abnormalities in the SHG from the pericellular matrix, while the TPF image remains normal. (c) Images from the center of the lesion, showing loss of cells and rippling effect in the SHG image. (Field ). The ratio images shown in the right-hand column highlight the changes in (b) the pericellular matrix and that (c) the rippling effect is stronger in the SHG image.  Figure 8 shows the measurements of both SHG and TPF polarization as a function of depth, in the core of the lesion and at the periphery, in macroscopically normal tissue. At the latter sites, the tissue showed the weak biattenuance in the TPF signal reported earlier, but at the core of the lesion, no polarization sensitivity was observed. Again we interpret this as a null result and place an upper bound of on the biattenuance, as for the TPF from healthy cartilage. Fig. 8The polarization dependence of TPF and SHG in the vicinity of a lesion, with site 1 being macroscopically normal-looking tissue close to the lesion, site 2 being approximately central to the lesion and site 3 being tissue in the periphery of the lesion. 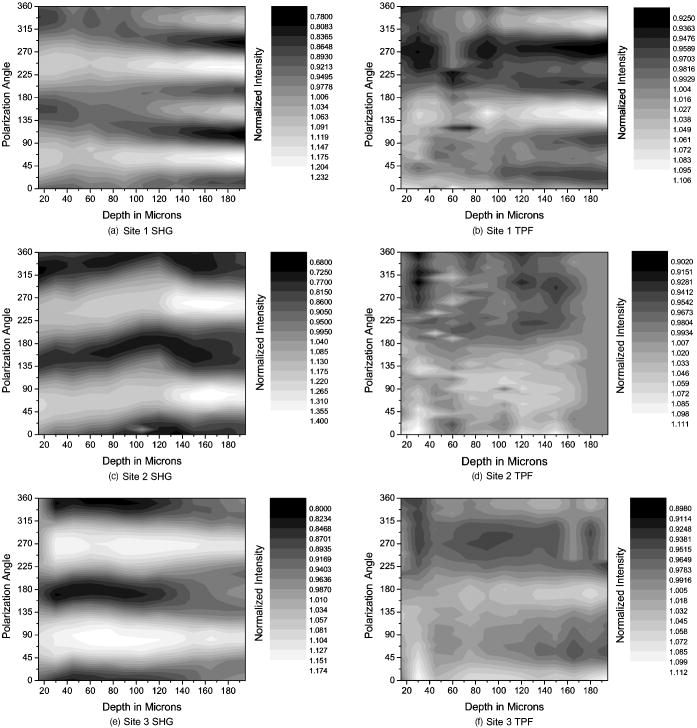 The SHG depth profiles showed larger changes than the TPF in the vicinity of the lesion, and so Fig. 9 shows a set of nine depth scans taken at intervals across the lesion. The first three scans covered regions that were histologically normal, and the scans were indistinguishable from those obtained in normal tissue at remote sites. However, at the site of the fourth scan, the histological structure was disrupted with the cartilage zones no longer clearly identifiable, and the SHG pattern in the four peak pattern beginning to be lost. The remaining scans were grossly abnormal in showing only two intensity maxima. In addition, the angle at which the peaks in intensity occurred was not constant with depth. This indicates a change in the angle of the fibers, as observed in x-ray diffraction studies on similar lesions.4 The intensity of the polarization sensitivity was greatest in the center of the lesion. This is consistent with a previous study that was able only to measure polarization sensitivity in diseased and not in healthy cartilage.21 Fig. 9Polarization dependence of SHG with depth for a series of ten sites at lateral positions through the lesion. Position 1 is anterior to the lesion and position 9 is posterior. At position 6, at the center of the lesion, the structure was too broken to detect any pattern of polarization sensitivity with depth. [All scales as in (a)].  4.ConclusionsWe demonstrate that nonlinear microscopy is a useful tool with which to study cartilage changes associated with disease, with polarization sensitivity measurements in particular providing information on changes in collagen fiber organization. The work is carried out in reflection mode, which enables examination of the surface of cartilage still attached to subchondral bone. Although the SHG signal from collagen is propagated primarily in the forward direction, backscattering was sufficiently strong to make this viable. The source of TPF remains uncertain. The ratio of TPF to SHG in cartilage was six times greater than that in tendon. TPF was not codistributed with the SHG, and so collagen cross links, at least some of which are fluorescent, are unlikely to be the only source. Elastin is a strong source of TPF, but it is present in articular cartilage only in very small quantities, if at all, and certainly not with the observed distribution. Proteoglycans are present at much higher concentrations in cartilage than tendon, and so are potential contributors to the tissue difference, but in our hands, pure preparations of aggrecan monomers and aggregates did not produce TPF at the wavelengths employed (data not shown). Further work on this and other fundamental questions such as the mechanisms of generation of SHG in collagen15 is required if multiphoton methods are to provide detailed information on tissue composition. The SHG signal is polarization dependent, and surface studies prove a sensitive means of detecting fiber orientation in the superficial layers of cartilage. Since disruption of this layer is believed to be one of the earliest indicators of disease, the potential of these measurements for early in-vivo detection is worth consideration. However, the interpretation of polarization sensitivity data acquired from deeper regions of the tissue requires care and further information. It is clear that these signals are distorted by the birefringence and biattenuance of the overlying tissue, and quantitative measurements of these properties, together with detailed models of light propagation in tissue, will be required to correct for these effects. However, the detailed characterization of changes in the structure of living tissue on microscopic scales that could be obtained would well reward such efforts. In addition to detecting changes in the organization of the intercellular matrix, multiphoton microscopy reveals changes in the pericellular matrix that appear to precede changes in the intercellular matrix. The ability to observe this structure in living tissue should provide new avenues for studying the underlying biological processes. AcknowledgmentsWe would like to thank Kenton Arkill and Charlotte Moger for help in collecting and preparing the tissue samples, the physics department mechanical workshop for manufacturing custom parts used in the microscope construction, and John Hale and Alan Brady for help with the image processing. ReferencesR. A. Stockwell, Biology of Cartilage Cells, Cambridge University Press, Cambridge, UK
(1979). Google Scholar
R. A. Stockwell,
“Cartilage failure in osteoarthritis: relevance of normal structure and function. A review,”
Clin. Anat., 4 161
–191
(1991). 0897-3806 Google Scholar
N. Ugryumova,
D. P. Attenburrow,
C. P. Winlove, and
S. J. Matcher,
“The collagen structure of equine articular cartilage, characterized using polarization-sensitive optical coherence tomography,”
J. Phys. D: Appl. Phys., 38 2612
–2619
(2005). https://doi.org/10.1088/0022-3727/38/15/012 0022-3727 Google Scholar
C. J. Moger,
R. Barrett,
P. Bleuet,
D. A. Bradley,
R. E. Ellis,
E. M. Green,
K. Knapp,
P. Muthuvelu, and
C. P. Winlove,
“Regional variations of collagen orientation in normal and diseased articular cartilage and subchondral bone determined using small angle X-ray scattering (SAXS),”
Osteoarthritis Cartilage, 15 682
–687
(2007). 1063-4584 Google Scholar
N. Ugryumova,
S. V. Gangnus, and
S. J. Matcher,
“Three-dimensional optic axis determination using variable-incidence-angle polarization-optical coherence tomography,”
Opt. Lett., 31 2305
–2307
(2006). https://doi.org/10.1364/OL.31.002305 0146-9592 Google Scholar
W. R. Zipfel,
R. M. Williams,
R. Christie,
A. Y. Nikitin,
B. T. Hyman, and
W. W. Webb,
“Live tissue intrinsic emission microscopy using multiphoton-excited native fluorescence and second harmonic generation,”
Proc. Natl. Acad. Sci. U.S.A., 100 7075
–7080
(2003). https://doi.org/10.1073/pnas.0832308100 0027-8424 Google Scholar
A. Zoumi,
A. Yeh, and
B. J. Tromberg,
“Imaging cells and extracellular matrix in vivo by using second-harmonic generation and two-photon excited fluorescence,”
Proc. Natl. Acad. Sci. U.S.A., 99 11014
–11019
(2002). https://doi.org/10.1073/pnas.172368799 0027-8424 Google Scholar
G. Cox,
E. Kable,
A. Jones,
I. K. Fraser,
F. Manconi, and
M. D. Gorrell,
“3-dimensional imaging of collagen using second harmonic generation,”
J. Struct. Biol., 141 53
–62
(2003). https://doi.org/10.1016/S1047-8477(02)00576-2 1047-8477 Google Scholar
P. J. Campagnola,
A. C. Millard,
M. Terasaki,
P. E. Hoppe,
C. J. Malone, and
W. Mohler,
“Three-dimensional high-resolution second harmonic generation imaging of endogenous structural proteins in biological tissues,”
Biophys. J., 81 493
–508
(2002). 0006-3495 Google Scholar
J. Sun,
T. Shilagard,
B. Bell,
M. Motamedi, and
G. Vargas,
“In vivo multimodal nonlinear optical imaging of mucosal tissue,”
Opt. Express, 12 2478
–2486
(2004). https://doi.org/10.1364/OPEX.12.002478 1094-4087 Google Scholar
R. Gauderon,
P. B. Lukins, and
C. J. R. Sheppard,
“Optimization of second-harmonic generation microscopy,”
Micron, 32 691
–700
(2001). https://doi.org/10.1016/S0968-4328(00)00066-4 0968-4328 Google Scholar
L. Hsu,
K. H. Kim,
C. Y. Dong,
P. Kaplan,
T. Hancewicz,
C. Buehler,
K. Berland,
B. R. Masters, and
P. T. C. So,
“Two-photon imaging of tissue physiology based on endogenous fluotophores,”
Confocal and Two-Photon Microscopy: Foundations, Applications and Advances, 431
–448 Wiley-Liss, New York
(2002). Google Scholar
R. Richards-Kortum,
R. Drezek,
K. Sokolov,
I. Pavlova, and
M. Follen,
“Survey of Endogenous Biological Fluorophores,”
Handbook of Biomedical Fluorescence, 237
–264 Marcel Dekker, New York
(2003). Google Scholar
R. M. Williams,
W. R. Zipfel, and
W. W. Webb,
“Interpreting second-harmonic generation images of collagen I fibrils,”
Biophys. J., 88 1377
–1386
(2005). https://doi.org/10.1529/biophysj.104.047308 0006-3495 Google Scholar
P. Stoller,
P. M. Celliers,
K. M. Reiser, and
A. M. Rubenchik,
“Quantitative second-harmonic generation microscopy in collagen,”
Appl. Opt., 42 5209
–5219
(2003). https://doi.org/10.1364/AO.42.005209 0003-6935 Google Scholar
I. Freund,
M. Deutsch, and
A. Sprecher,
“Connective-tissue polarity—optical 2nd-harmonic microscopy, crossed-beam summation, and small-angle scattering in rat-tail tendon,”
Biophys. J., 50 693
–712
(1986). 0006-3495 Google Scholar
S. Roth and
I. Freund,
“Second harmonic generation in collagen,”
J. Chem. Phys., 70 1637
–1643
(1978). https://doi.org/10.1063/1.437677 0021-9606 Google Scholar
P. Stoller,
B. M. Kim,
A. M. Rubenchik,
K. M. Reiser, and
L. B. Da Silva,
“Polarization-dependent optical second-harmonic imaging of a rat-tail tendon,”
J. Biomed. Opt., 79
(2), 205
–214
(2002). 1083-3668 Google Scholar
P. Stoller,
K. M. Reiser,
P. M. Celliers, and
A. M. Rubenchik,
“Polarization-modulated second harmonic generation in collagen,”
Biophys. J., 82 3330
–3342
(2002). 0006-3495 Google Scholar
T. Yasui,
Y. Tohno, and
T. Araki,
“Determination of collagen fiber orientation in human tissue by use of polarization measurement of molecular second-harmonic-generation light,”
Appl. Opt., 43 2861
–2867
(2004). https://doi.org/10.1364/AO.43.002861 0003-6935 Google Scholar
A. T. Yeh,
M. J. Hammer-Wilson,
D. C. Van Sickle,
H. P. Benton,
A. Zoumi,
B. J. Tromberg, and
G. M. Peavy,
“Nonlinear optical microscopy of articular cartilage,”
Osteoarthritis Cartilage, 13 345
–352
(2005). 1063-4584 Google Scholar
T. Yasui,
K. Sasaki,
Y. Tohno, and
T. Araki,
“Tomographic imaging of collagen fiber orientation in human tissue using depth-resolved polarimetry of second-harmonic-generation light,”
Opt. Quantum Electron., 37 1397
–1408
(2005). https://doi.org/10.1007/s11082-005-4219-0 0306-8919 Google Scholar
N. J. Kemp,
H. N. Zaatari,
J. Park,
H. G. Rylander, and
T. E. Milner,
“Form-biattenuance in fibrous tissues measured with polarization-sensitive optical coherence tomography (PS-OCT),”
Opt. Express, 13 4611
–4628
(2005). https://doi.org/10.1364/OPEX.13.004611 1094-4087 Google Scholar
C. W. McIlwraith,
“Current Concepts in Equine Degenerative Joint Disease,”
J. Am. Vet. Med. Assoc., 180 239
–250
(1982). 0003-1488 Google Scholar
T. A. Theodossiou,
C. Thrasivoulou,
C. Ekwobi, and
D. L. Becker,
“Second harmonic generation confocal microscopy of collagen type I from rat tendon cryosections,”
Biophys. J., 91 4665
–4677
(2006). 0006-3495 Google Scholar
D. Eyre,
“Collagen of articular cartilage,”
Arth. Res., 4 30
–35
(2002). Google Scholar
W. Horton,
“Morphology of connective tissue: cartilage,”
Connective Tissue and Its Heritable Disorders, 73
–84 Wiley-Liss, New York
(1993). Google Scholar
V. Sankaran,
J. T. Walsh, and
D. J. Maitland,
“Comparative study of polarized light propagation in biologic tissues,”
J. Biomed. Opt., 7 300
–306
(2002). https://doi.org/10.1117/1.1483318 1083-3668 Google Scholar
J. R. Lakowicz,
“Chapter 10 fluorescence anisotropy,”
Principles of Fluorescence Spectroscopy, Kluwer Scientific, New York
(1999). Google Scholar
H. Brommer,
P. R. van Weeren,
P. A. Brama, and
A. Barneveld,
“Quantification and age-related distribution of articular cartilage degeneration in the equine fetlock joint,”
Equine Vet. J., 35 697
–701
(2003). 0425-1644 Google Scholar
J. C. Mansfield,
C. P. Winlove,
K. Knapp, and
S. J. Matcher,
“Imaging articular cartilage using second harmonic generation microscopy—art. no. 60891O,”
Multiphoton Microscopy in the Biomedical Sciences VI, O891
–O891 SPIESPIE, Bellingham, Washington State, USABellingham, Washington State, USA
(2006). Google Scholar
|


