|
|
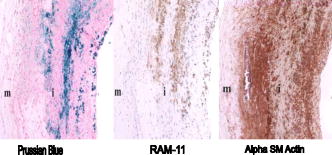
1.IntroductionAtherosclerosis resulting in myocardial infarction, stroke, and peripheral vascular disease is the leading cause of death worldwide. These cardiovascular deaths are commonly caused by rupture of “vulnerable” plaques. The histological characteristic features of vulnerable plaques are well established by autopsy studies in humans and include large lipid cores, thin fibrous caps, and an abundance of infiltrated macrophages. Many inflammatory cells and molecules associated with plaque vulnerability have been identified, contributing to the hypothesis that inflammation plays a significant role in initiation, progression, mechanical instability, and rupture of atherosclerotic plaque.1, 2, 3 Several features of the inflammatory process have been identified that contribute to mechanical instability, and increased risk of plaque rupture, these include activation and recruitment of macrophages,4 overexpression of matrix metalloproteinases (MMPs),5 decreasing collagen synthesis,6 and thinning of the fibrous cap overlying a large lipid core.7, 8 Activation and recruitment of macrophages can induce breakdown of a thin fibrous cap and increase mechanical instability and risk of plaque rupture by local production of MMPs. Thus, macrophages are an important cellular marker for the risk of plaque rupture in the coronary, cerebral, and peripheral circulations. Optical coherence tomography (OCT)9 is a rapidly emerging imaging modality demonstrating improved resolution capable of performing high-resolution imaging (axial resolution of , transverse resolution limited by wavelength, and beam numerical aperture) not available with other techniques, such as intravascular ultrasonography,10 multislice CT,11 and magnetic resonance imaging (MRI).12 More recently, OCT has been successfully applied to image quantitatively morphometric features of vulnerable plaque, such as the large lipid core and thin fibrous cap. 7, 13, 14, 15, 16, 17, 18 The capability of conventional OCT to distinguish consistently in vivo macrophages from the surrounding tissues with high confidence in the presence of atherosclerosis is uncertain.13, 19 For example, scattering features attributed to macrophages might originate in calcium, speckle, or other plaque constituents. Investigators have demonstrated that phase-sensitive microscopy based on spectral domain OCT could be used for quantitative phase-contrast imaging with improved resolution.20, 21, 22 Differentialphase optical coherence tomography (DP-OCT) is capable of high path length sensitivity and is able to detect a optical path length change between discrete reflecting surfaces.23 DP-OCT has been applied to phase contrast imaging of cells,21 used to measure nanometer-scale displacement changes corresponding to neuron activity,24 electro-kinetic response of cartilage,25 photothermal response of tissue,26 and changes in analyte concentration.27 In our recent work, we have shown that by using DP-OCT we are able to detect tissue-based macrophages in murine liver containing Feridex IV (Advanced Magnetics Inc., ) nanoparticles and an external oscillating magnetic field.28 However, to our knowledge, no published report is available on the detection of macrophages using nanoparticles in an intact atherosclerotic tissue. Nanoparticle dosimetry in the reticulo-endothelial system is different from that for atherosclerotic tissues. To target nanoparticles to macrophages in atherosclerotic plaques, the size should be to reduce uptake by the reticulo-endothelial system.29 Therefore, the objective of this study is to demonstrate detection of macrophages in atherosclerotic animal models using smaller diameter ironoxide nanoparticles . These studies were completed using two atherosclerotic animal models: Watanabe and balloon-injured fat-fed New Zealand white rabbits. The Watanabe model targeted nanoparticles to superficial macrophages, whereas the New Zealand white rabbits provided tissues with MION in deeper macrophages in atherosclerotic lesions. 2.Method2.1.DP-OCT InstrumentationThe fiber-based dual-channel DP-OCT system used in this study has been described previously.28 Briefly, partially polarized light from an optical semiconductor amplifier (AFC Technologies, central wavelength , ) is polarized and coupled into fast and slow axes of a polarization-maintaining (PM) fiber. Light is split by a PM coupler into reference and sample paths. The phase of light in the reference path is modulated by a waveguide phase modulator while group delay is varied by a rapid scanning optical delay line. Additionally, the rapid scanning optical delay line (RSOD) was used to balance dispersion imbalance between reference and sample paths introduced by the waveguide phase modulator and birefringent calcite wedges. Polarization modes of light in the sample path undergo a user-selectable differential delay when propagating through a pair of birefringent calcite wedges with orthogonal fast axes. The differential delay between polarization modes may be varied by adjusting the thickness of the calcite wedges. The differential delay is set to provide equal pathlengths of light reflecting from the bottom surface of a -thick glass window providing a reference air-glass interface and the atherosclerotic tissue specimen. A rubber o-ring positioned underneath the -thick glass window provided an adjustable distance between the reference air-glass interface and the atherosclerotic tissue specimen. Unpolarized thick surface of light was focused on the specimen with a 0.2 numerical aperture so that the Rayleigh range included both the specimen and reference air-glass interface. Light returning from the sample and reference path recombine and interfere in the PM coupler. A Wollaston prism separates interfering light in fast and slow axes of the PM fiber into channel 1 (ch1) and channel 2 (ch2). The dual-channel Michelson interferometer was used to measure differential phase between light backscattered from the reference air-glass interface and atherosclerotic tissue specimen surface when applying a sinusoidal focused magnetic flux density. Detected fringe signals may be written where is a scale factor, is source coherence length, and are reflectivity from reference and sample, is the modulation frequency of the phase modulator, is the phase noise in the interferometer due to environmental perturbations, and and are the phase of fringes in reference and sample paths, is the sample-reference pathlength difference in channels or 2. Optical path length change measured in this study corresponds to magneto-mechanical tissue surface displacement in response to a high-strength magnetic flux density applied to iron-laden tissue and can be calculated from the differential phase and central wavelength of source light ,The two signals recorded from channels 1 and 2 by the DP-OCT system were used to measure magnetomechanical tissue surface displacement due to movement of magnetic nanoparticles taken up by macrophages. Forward and reverse bandpass filtering was used for zero-phase distortion and to eliminate noise from interferometric fringe data. After data processing, a second-order low-pass Chebyshev type II digital filter was utilized to eliminate noise from the optical path length change signal with a stopband ripple down from the peak passband and with cutoff frequency of . After processing, the root-mean-square level of phase noise of signals recorded from arterial test specimens was reduced from . Noise in unfiltered signals was predominantly at and believed to originate in mechanical vibration. 2.2.Magnetic Flux Density GeneratorA finite element method (FEM) was used to design the magnetic flux density generator and evaluate spatial variation of field strength. The magnetic field generator consists of a solenoid (Ledex 6EC, Saia-Burgess Inc., USA), a function generator (HP 33120A, Hewlett Packard Inc., USA), a current amplifier, and power supply. FEM calculations (Maxwell SV, Ansoft Inc., USA) and teslameter (Magnetometer, AlphaLab Inc., USA) measurement indicated that maximum magnetic flux density at a distance of from the tip of the iron core was . The FEM simulation demonstrated that an iron core positioned along the centerline of the solenoid substantially increased magnetic flux density at the target specimen compared to without the core. Magnetic flux density distributions from the FEM simulation showed the maximal and principal direction of the magnetic field strength was along the direction. The conical iron core provided focusing and substantially increased the magnetic flux density. 2.3.Iron NanoparticlesMonocrystalline iron oxide nanoparticles (MIONs) composed of a monocrystalline iron core with a dextran coating was used as a magnetic label and were taken up by inflammatory macrophages in atherosclerotic lesions. The core diameter30 of these particles is and with the dextran coating is . The reduced diameter of these particles reduces competitive uptake by the reticulo-endothelial system, increases blood circulation half-life, and allows for increased phagocytosis by atherosclerotic macrophages.29 2.4.Animal Preparation and Specimen PreparationAll experimental procedures were performed in accordance with protocols approved by the University of Texas Institutional Animal Care and Use Committee. Four hyperlipidemic Watanabe rabbits and two double-balloon injured fat-fed New Zealand white rabbits were included in the study. The Watanabe is a spontaneous mutation that results in atherosclerotic disease and does not require fat feeding for plaque development. Atherosclerotic plaques may be induced in New Zealand white rabbits by double-balloon injury and fat feeding, as previously reported by Feldman and coworkers.31 Two Watanabe and one New Zealand white rabbits were injected with MIONs at a dose of body weight. This iron dosage is times the recommended FDA dosage for humans; however, this dose is well tolerated in rabbits. The other three rabbits (two Watanabe and one New Zealand white) were injected with saline and served as controls. Each aortic specimen was evaluated ex vivo using DP-OCT measurement of tissue surface displacement in response to magnetomotive excitation. After three days following MION injection, an intravascular bolus of heparin was injected to prevent clot formation and animals were then euthanized with a dose of Phenobarbital. Aortic specimens were removed, flushed with saline, and cut into -sized specimens for DP-OCT measurement. 2.5.Histology AnalysisAfter completion of DP-OCT measurements, the rabbit aorta specimens were fixed in 4% paraformaldehyde for , and embedded in paraffin. Arterial cross sections were cut in to -thick sections and stained with Prussian blue to identify iron deposition and RAM-11 for macrophage cell identification in the atherosclerotic lesions. In aortic specimens taken from New Zealand white rabbits, in addition to Prussian blue and RAM-11, alpha smooth muscle actin was used to identify smooth muscle cells. Positive staining for alpha smooth muscle actin is a mirror image of RAM-11 and Prussian blue stains and thus serves as a control. 3.Results3.1.Watanabe Atherosclerotic Aortic Tissue Surface DisplacementIn Watanabe atherosclerotic rabbit tissue, measurements of peak-to-peak magnetomechanical tissue surface displacement are illustrated (Fig. 1 ) in ex vivo aorta specimens following intravenous MION (0.2 mmol Fe/kg body weight) or saline injection. While applying a , input magnetic flux density to aorta specimens, is , while no tissue surface displacement was observed in saline control aorta specimens. Fig. 1Magnetomechanical tissue surface displacement in Watanabe aorta specimens in response to focused magnetic flux density excitation. Magnetomechanical tissue surface displacement in of MION-laden aorta specimens ( , ) (top), and magnetomechanical tissue surface displacement in of MION-laden aorta specimens by applying a swept frequency excitation over a time period (bottom).  Peak-to-peak magnetomechanical tissue surface displacement in rabbit aorta specimens (0.2 mmol Fe/kg body weight) was measured in response to application of a swept frequency high-intensity focused magnetic flux density (Fig. 1, bottom). A swept frequency magnetic flux density was applied to investigate if the aorta specimen responded to a variable excitation of . With maximum magnetic flux density of , is . Frequency response of in MION aorta specimens was twice the externally applied modulation frequency (Fig. 1). Peak-to-peak magnetomechanical tissue surface displacement in MION atherosclerotic Watanabe aorta ( body weight) with frequency of the sinusoidal magnetic flux density increasing from in increments is (a) 123, (b) 156, (c) 174, and (d) , respectively (Fig. 2 ). Increasing the modulation frequency of the magnetic flux density from , increased by . Further increases in frequency of the sinusoidal magnetic flux density did not substantially increase magnetomechanical tissue surface displacement . Fig. 2Magnetomechanical tissue surface displacement in MION-laden Watanabe aorta specimens with input frequency ranging from in increments with MION dose ( body weight). . 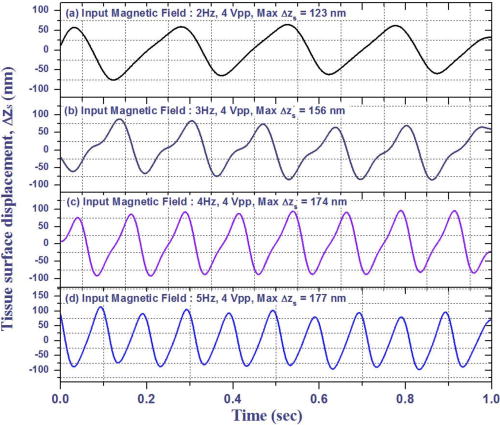 Quantitative analysis of the experiments in Watanabe MION aorta specimens using box-and-whisker plots of peak-to-peak magnetomechanical tissue surface displacement versus applied sinusoidal input voltage with (a) MION dose and (b) control specimens are shown in Fig. 3 . Corresponding magnetic flux density for sinusoidal input voltages was 0.25, 0.47, 0.67, 0.87, and , respectively. Compared to MION aorta specimens, magnetomechanical tissue surface displacement of Watanabe control specimens did not vary with increasing magnetic field; with maximum tissue surface displacement of corresponding to the background noise level. Fig. 3Quantitative analysis of MION Watanabe aorta specimens using box-and-whisker plot of peak-to-peak magnetomechanical tissue surface displacement versus sinusoidal input voltage with MION dose (left) and control specimens (right). Edges of rectangular box are the 25th percentile, and 75th percentile, respectively. The central small box indicates the mean, and whiskers show minimum and maximum values. 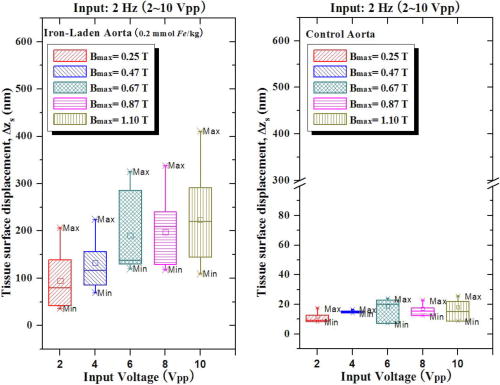 3.2.New Zealand White Aortic Tissue Surface DisplacementIn double-balloon injured fat-fed New Zealand white rabbits, measurements of peak-to-peak magnetomechanical tissue surface displacement are illustrated (Fig. 4 ) in ex vivo aorta specimens following intravenous MIONs ( body weight). While applying a , input magnetic flux density to aorta specimens, is and decreases to with filtering. Fig. 4Magnetomechanical tissue surface displacement in New Zealand white rabbit aortic specimens in response to focused magnetic flux density excitation. Input magnetic field (top); magnetomechanical tissue surface displacement in of MION-laden aorta specimens ( , ) (middle), and filtered magnetomechanical tissue surface displacement (bottom). 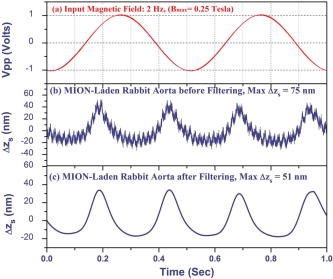 3.3.HistologyHistologic images of aortic tissue sections from a Watanabe heritable hyperlipidemic (WHHL) rabbit injected with MIONs at a dose of body weight and interrogated with DP-OCT ( with , Tesla) are shown in Fig. 5 . Prussian blue stain (a) demonstrates MION engulfed by superficial macrophages (arrows) which also stains positive with RAM-11 [(b), arrow], confirming these cells are macrophages in intimal hyperplasia. Fig. 5Histologic images of atherosclerotic Watanabe MION-laden aorta tissue sections where magnetomechanical tissue surface displacement was measured with DP-OCT ( with , ). Prussian Blue (a) and RAM-11 stains (b) at a MION dose ( body weight) are shown. Adjacent histological sections indicated in (a) and (b) are apart and demonstrate presence of MIONs in macrophages (arrows). 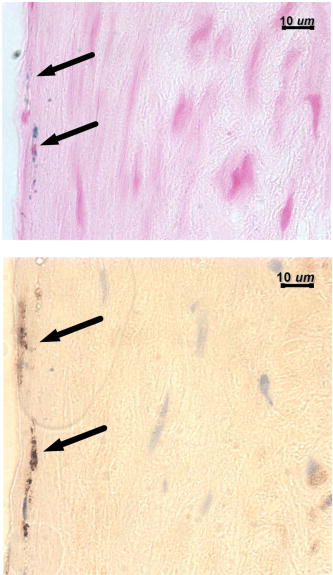 Histologic images of aortic tissue sections from a double-balloon injured fat-fed New Zealand white rabbit injected with MIONs at a dose of 0.2 mmol Fe/kg body weight and interrogated with DP-OCT ( with , ) are shown in Fig. 6 . The section stained with Prussian blue (left) demonstrates iron oxide present in the deep intima. The section stained with RAM-11 confirms that MIONs are in the macrophages. The section stained with -smooth muscle (SM) actin demonstrates SM cells in adjacent areas and represents a mirror image of the sections stained with Prussian blue and RAM-11. 4.DiscussionWe have demonstrated a novel quantitative diagnostic detection modality that uses DP-OCT combined with a high-intensity focused magnetic flux density to detect macrophages in ex vivo atherosclerotic tissues that have taken up MIONs. Use of small-diameter MION magnetic particles allowed longer circulation times, reduced competitive uptake by the reticulo-endothelial system, and improved delivery to macrophages in atherosclerotic plaques. Magnetic force acting on the nanoparticles was varied by applying a sinusoidal or swept-frequency current to a solenoid containing a conical iron core that substantially increased and focused the magnetic flux density on the tissue. Our results suggest that DP-OCT with nanometer sensitivity allows detection of iron-laden macrophages in WHHL and New Zealand white rabbits at doses of body weight. Locations of magnetomechanical tissue motion measured with DP-OCT were confirmed with histology to be areas positive for macrophages which had taken up MION. Although less surface displacement was observed in aortic specimens taken from the New Zealand double-balloon injured fat-fed animal model and corresponding macrophages were deeper, experiments with additional rabbits are required to confirm statistically observed differences in the two models. Preliminary experiments to identify macrophages in coronary arteries of patients using intravascular OCT have been reported.13, 19 However, limitations in the specificity of this approach to identify macrophages has been noted; for instance, although dark regions in OCT images correlated with macrophage presence in histology, contributions from other tissue components, such as calcium, should not be ruled out. Use of conventional OCT to identify macrophages with high confidence in plaque lesions and thereby evaluate macrophage density in vivo may be problematic due to confounding contributions from other tissue components. Magnetomotive OCT was recently demonstrated to enhance image contrast using magnetic particles in vivo in tadpoles by measuring optical scattering changes.32 This approach did not provide a quantitative phase-based measurement of tissue displacement. Our studies are the first to perform with high confidence cellular identification of tissue-based macrophages and distinguish them from other competing plaque components. Extending these results to detection of plaque associated macrophages in vivo will require a phase-sensitive OCT system that may be interfaced to an optical fiber catheter. Because the DP-OCT system utilized in the current study is a time-domain system with limited signal-to-noise ratio and requires birefringent calcite wedges to vary optical pathlength difference, in vivo application with a catheter is not feasible. Frequency response of magnetomechanical tissue surface displacement from iron-laden macrophages was twice the excitation frequency of the input magnetic flux density (Figs. 1, 2, 4). The frequency-doubling effect is due to magnetic force on the nanoparticles being proportional to the product of magnetic moment and the gradient. The magnetic flux density induces a magnetic moment in the nanoparticles, which experience a force proportional to the gradient of the externally applied field. When magnetic flux density reverses direction, the induced magnetic moment in the nanoparticle flips together with the gradient of the external field, producing a force in the same direction. The result is an oscillatory motion of the tissue at twice the frequency of the applied field. Application of a swept frequency magnetic flux indicates aortic specimens containing nanoparticles respond dynamically between 1 and (Fig 1, bottom). Nanoparticles exposed to an external magnetic flux density, , have a dynamic response determined by the induced magnetic moment, , and viscoelastic properties of the surrounding material. The magnetic moment, , induced in volume, is given by, where is magnetization. The constitutive relation between nanoparticle magnetization and the applied magnetic field strength is given by the Langevin function.33 At low magnetic flux densities, the Langevin magnetization curve for MIONs is approximately linear and proportional to magnetic field strength.30 Under these conditions, magnetic force acting on iron nanoparticles is proportional to the gradient of the square magnitude of the magnetic field strength. We assume a sinusoidal magnetic flux density that is directed principally along the direction, and we write Magnetic force, acting on the nanoparticles iswhere is the modulation frequency of the applied sinusoidal magnetic field. When the internalized MIONs are contained in a lysosome, they interact with the cell cytoskeleton, the total force acting on nanoparticles also includes elastic restoring , and viscous damping components. Assuming a Voigt mechanical model34 for the nanoparticle-cytoskeleton system, the equation of motion is Here, is the magnetic susceptibility and is the volume of the nanoparticle cluster and is the permeability of free space. When the product of the magnetic field and its gradient does not vary over longitudinal positions corresponding to displacement of the nanoparticle, the forcing term in Eq. 4 becomes independent of and an analytic expression for the sinusoidal displacement of nanoparticles may be found using Laplace transforms. Maximum amplitude of nanoparticle displacement in steady state (after the magnetic field is applied for some time) occurs when , where is twice the angular frequency of the magnetic flux density, and is a viscous damping parameter characteristic of the frictional force of the surrounding macrophage cytoplasm on the nanoparticles, and is the natural oscillation frequency of the cytoskeleton. At high modulation frequencies , amplitude of nanoparticle displacement diminishes to zero.To compute the tissue surface displacement in response to nanoparticle movement in macrophages, one may consider a cluster of nanoparticles in a lysosome surrounded by the cytoskeleton of a macrophage. The force exerted by the nanoparticle cluster on macrophage cytoskeleton is transmitted elastically to the tissue surface. At maximum displacement of the nanoparticle cluster, the velocity is zero so that the viscous force is zero. At this position when the nanoparticle cluster is stationary and the frequency of the applied magnetic field is small , the force provided by the external magnetic field produces a tissue surface displacement that is approximately equal to that of a static force as given by Mindlin’s expression.35 To compute an estimate of tissue surface displacement requires values of the elastic modulus and magnitude of viscous damping. A better magnetomechanical model that provides more accurate measurement of tissue surface displacement might be obtained using a fractional calculus approach which better simulates the mechanical properties of the macrophage cellular anatomy.36 5.ConclusionIn conclusion, we have demonstrated a technique using DP-OCT for detection of macrophages in WHHL and New Zealand white rabbit aortic tissues. Frequency response of tissue surface displacement in response to an externally applied magnetic flux density was twice the stimulus frequency. Increasing the magnetic flux density strength increased magnetomechanical surface displacement in atherosclerotic specimens containing MIONs. In saline control atherosclerotic tissue specimens, no significant magnetomechanical tissue surface displacement was observed in response to an externally applied magnetic flux density. Results of our experiments suggest that further research investigating magneto-mechanical DP-OCT to detect macrophages containing magnetic nanoparticles in tissues is warranted. AcknowledgmentThis work was supported by a Veterans Administration Merit Grant to Dr. Marc D. Feldman. ReferencesP. Libby,
“Inflammation in atherosclerosis,”
Nature (London), 420 868
–874
(2002). https://doi.org/10.1038/nature01323 0028-0836 Google Scholar
P. Libby,
“Vascular biology of atherosclerosis: overview and state of the art,”
Am. J. Cardiol., 91 3A
–6A
(2003). 0002-9149 Google Scholar
R. Ross,
“Atherosclerosis—An inflammatory disease,”
N. Engl. J. Med., 340 115
–126
(1999). https://doi.org/10.1056/NEJM199901143400207 0028-4793 Google Scholar
Y. V. Bobryshev,
“Monocyte recruitment and foam cell formation in atherosclerosis,”
Micron, 37 208
–222
(2006). 0968-4328 Google Scholar
I. M. Loftus,
A. R. Naylor,
S. Goodall,
M. Crowther,
L. Jones,
P. R. Bell, and
M. M. Thompson,
“Increased matrix metalloproteiase-9 activity in unstable cartoid plaques,”
Stroke, 31 40
–47
(2000). 0039-2499 Google Scholar
P. Libby,
“Atherosclerosis the NEW VIEW,”
Sci. Am., 286 46
–55
(2002). 0036-8733 Google Scholar
M. Cilingiroglu,
J. H. Oh,
B. Sugunan,
N. J. Kemp,
J. Kim,
S. Lee,
H. N. Zaatari,
D. Escobedo,
S. Thomsen,
T. E. Milner, and
M. D. Feldman,
“Detection of vulnerable plaque in a murine model of atherosclerosis with optical coherence tomography,”
Catheter Cardiovasc. Interv., 67
(6), 915
–923
(2006). Google Scholar
G. J. Tearney,
H. Yabushita,
S. L. Houser,
H. T. Aretz,
I. K. Jang,
K. H. Schlendorf,
C. R. Kauffman,
M. Shishkov,
E. F. Halpern, and
B. E. Bouma,
“Characterization of human atherosclerosis by optical coherence,”
Circulation, 106 656
–656
(2002). 0009-7322 Google Scholar
D. Huang,
E. A. Swanson,
C. P. Lin,
J. S. Schuman,
W. G. Stinson,
W. Chang,
M. R. Hee,
T. Flotte,
K. Gregory,
C. A. Puliafito, and
J. G. Fujimoto,
“Optical coherence tomography,”
Science, 254 1178
–81
(1991). https://doi.org/10.1126/science.1957169 0036-8075 Google Scholar
S. E. Nissen,
J. C. Gurley,
C. L. Grines,
D. C. Booth,
R. McClure,
M. Berk,
C. Fischer, and
A. N. DeMaria,
“Intravascular ultrasound assessment of lumen size and wall morphology in normal subjects and patients with coronary artery disease,”
Circulation, 84 1087
–1099
(1991). 0009-7322 Google Scholar
T. J. Vogl,
N. D. Abolmaali,
T. Diebold,
K. Engelmann,
M. Ay,
S. Dogan,
G. Wimmer-Greinecker,
A. Moritz, and
C. Herzog,
“Techniques for the detection of coronary atherosclerosis: multi-detector row CT coronary angiography,”
Radiology, 223 212
–220
(2002). 0033-8419 Google Scholar
J. F. Toussaint,
G. M. LaMuraglia,
J. F. Southern,
V. Fuster, and
H. L. Kantor,
“Magnetic resonance images lipid, fibrous, calcified, hemorrhagic, and thrombotic components of human atherosclerosis in vivo,”
Circulation, 94 932
–938
(1996). 0009-7322 Google Scholar
B. D. MacNeill,
B. E. Bouma,
H. Yabushita,
I. K. Jang, and
G. J. Tearney,
“Intravascular optical coherence tomography: Cellular imaging,”
J. Nucl. Cardiol., 12 460
–465
(2005). 1071-3581 Google Scholar
V. Bhatia,
R. Bhatia,
S. Dhindsa, and
M. Dhindsa,
“Imaging of the vulnerable plaque: New modalities,”
Southwest Med., 96 1142
–1147
(2003). 0038-4860 Google Scholar
D. Stamper,
N. J. Weissman, and
M. Brezinski,
“Plaque characterization with optical coherence tomography,”
J. Am. Coll. Cardiol., 47 C69
–C79
(2006). https://doi.org/10.1016/j.jacc.2005.10.067 0735-1097 Google Scholar
H. Yabushita,
B. E. Bouma,
S. L. Houser,
H. T. Aretz,
I. K. Jang,
K. H. Schlendorf,
C. R. Kauffman,
M. Shishkov,
D. H. Kang,
E. F. Halpern, and
G. J. Tearney,
“Characterization of human atherosclerosis by optical coherence tomography,”
Circulation, 106 1640
–1645
(2002). https://doi.org/10.1161/01.CIR.0000029927.92825.F6 0009-7322 Google Scholar
G. J. Tearney,
M. E. Brezinski,
B. E. Bouma,
S. A. Boppart,
C. Pitris,
J. F. Southern, and
J. G. Fujimoto,
“In vivo endoscopic optical biopsy with optical coherence tomography,”
Science, 276 2037
–2039
(1997). https://doi.org/10.1126/science.276.5321.2037 0036-8075 Google Scholar
I. K. Jang,
B. E. Bouma,
D. H. Kang,
S. J. Park,
S. W. Park,
K. B. Seung,
K. B. Choi,
M. Shishkov,
K. Schlendorf,
E. Pomerantsev,
S. L. Houser,
H. T. Aretz, and
G. J. Tearney,
“Visualization of coronary atherosclerotic plaques in patients using optical coherence tomography: comparison with intravascular ultrasound,”
J. Am. Coll. Cardiol., 39 604
–609
(2002). https://doi.org/10.1016/S0735-1097(01)01799-5 0735-1097 Google Scholar
G. J. Tearney,
H. Yabushita,
S. L. Houser,
H. T. Aretz,
I. K. Jang,
K. H. Schlendorf,
C. R. Kauffman,
M. Shishkov,
E. F. Halpern, and
B. E. Bouma,
“Quantification of macrophage content in atherosclerotic plaques by optical coherence tomography,”
Circulation, 107 113
–119
(2003). https://doi.org/10.1161/01.CIR.0000044384.41037.43 0009-7322 Google Scholar
M. A. Choma,
A. K. Ellerbee,
C. Yang,
T. L. Creazzo, and
J. A. Izatt,
“Spectral-domain phase microscopy,”
Opt. Lett., 30 1162
–1164
(2005). https://doi.org/10.1364/OL.30.001162 0146-9592 Google Scholar
C. G. Rylander,
D. P. Dave,
T. Akkin,
T. E. Milner,
K. R. Diller, and
A. J. Welch,
“Quantitative phase-contrast imaging of cells with phase-sensitive optical coherence microscopy,”
Opt. Lett., 29 1509
–1511
(2004). https://doi.org/10.1364/OL.29.001509 0146-9592 Google Scholar
C. Joo,
T. Akkin,
B. Cense,
B. H. Park,
“Spectral-domain optical coherence phase microscopy for quantitative phase-contrast imaging,”
Opt. Lett., 30 2131
–2133
(2005). https://doi.org/10.1364/OL.30.002131 0146-9592 Google Scholar
D. P. Dave and
T. E. Milner,
“Optical low-coherence reflectometer for differential phase measurement,”
Opt. Lett., 25 227
–229
(2000). 0146-9592 Google Scholar
T. Akkin,
D. P. Dave,
T. E. Milner, and
H. G. Rylander,
“Detection of neural activity using phase-sensitive optical low-coherence reflectometry,”
Opt. Express, 12 2377
–2386
(2004). https://doi.org/10.1364/OPEX.12.002377 1094-4087 Google Scholar
J. I. Youn,
T. Akkin, and
T. E. Milner,
“Electrokinetic measurement of cartilage using differential phase optical coherence tomography,”
Physiol. Meas, 25 85
–95
(2004). 0967-3334 Google Scholar
S. A. Telenkov,
D. P. Dave,
S. Sethuraman,
T. Akkin, and
T. E. Milner,
“Differential phase optical coherence probe for depth-resolved detection of photothermal response in tissue,”
Phys. Med. Biol., 49 111
–119
(2004). https://doi.org/10.1088/0031-9155/49/1/008 0031-9155 Google Scholar
K. V. Larin,
T. Akkin,
R. O. Esenaliev,
M. Motamedi, and
T. E. Milner,
“Phase-Sensitive optical low-coherence reflectometry for the detection of analyte concentrations,”
Appl. Opt., 43 3408
–3414
(2004). https://doi.org/10.1364/AO.43.003408 0003-6935 Google Scholar
J. W. Oh,
M. D. Feldman, and
J. Kim,
“Magneto-motive detection of tissue-based macrophages by differential phase optical coherence tomography,”
Lasers Surg. Med., 39 266
–272
(2007). https://doi.org/10.1002/lsm.20473 0196-8092 Google Scholar
M. E. Kooi,
V. C. Cappendijk,
K. B. Cleutjens,
A. G. Kessels,
P. J. Kitslaar,
M. Borgers,
P. M. Frederik,
M. J. Daemen, and
J. M. van Engelshoven,
“Accumulation of ultrasmall superparamagnetic particles of iron oxide in human atherosclerotic plaques can be detected by in vivo magnetic resonance imaging,”
Circulation, 107 2453
–2458
(2003). https://doi.org/10.1161/01.CIR.0000068315.98705.CC 0009-7322 Google Scholar
R. Weissleder,
A. S. Lee,
B. A. Khaw,
T. Shen, and
T. J. Brady,
“Antimyosin-labeled monocrystalline iron oxide allows detection of myocardial infarct: MR antibody imaging,”
Radiology, 182 381
–385
(1992). 0033-8419 Google Scholar
F. Hyafil,
J. P. Laissy,
M. Mazighi,
D. Tchetche,
L. Louedec,
H. Adle-Biassette,
S. Chillon,
D. Henin,
M. P. Jacob,
D. Letourneur, and
L. J. Feldman,
“Ferumoxtran-10-enhanced MRI of the hypercholesterolemic rabbit aorta,”
Arterioscler., Thromb., Vasc. Biol., 26 176
–181
(2005). 1079-5642 Google Scholar
A. L. Oldenburg,
F. J. J. Toublan,
K. S. Suslick,
A. Wei, and
S. A. Boppart,
“Magnetomotive contrast for in vivo optical coherence tomography,”
Opt. Express, 13 6597
–6614
(2005). https://doi.org/10.1364/OPEX.13.006597 1094-4087 Google Scholar
E. A. Guggenheim,
“The specific thermodynamic properties of aqueous solutions of strong electrolytes,”
Philos. Mag., 19 588
–643
(1935). 0031-8086 Google Scholar
A. R. Bausch,
F. Ziemann,
A. A. Boulbitch,
K. Jacobson, and
E. Sackmann,
“Local measurements of viscoelastic parameters of adherent cell surfaces by magnetic bead microrheometry,”
Biophys. J., 75 2038
–2049
(1998). 0006-3495 Google Scholar
R. D. Mindlin,
“Force at a point in the interior of a semi-infinite solid,”
Physics (N.Y.), 7 195
–202
(1936). https://doi.org/10.1063/1.1745385 0092-8437 Google Scholar
V. D. Djordjevic,
J. Jaric,
B. Fabry,
J. J. Fredberg, and
D. Stamenovic,
“Fractional derivatives embody essential features of cell rheological behavior,”
Ann. Biomed. Eng., 31 692
–699
(2003). https://doi.org/10.1114/1.1574026 0090-6964 Google Scholar
|