|
|
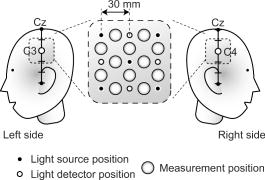
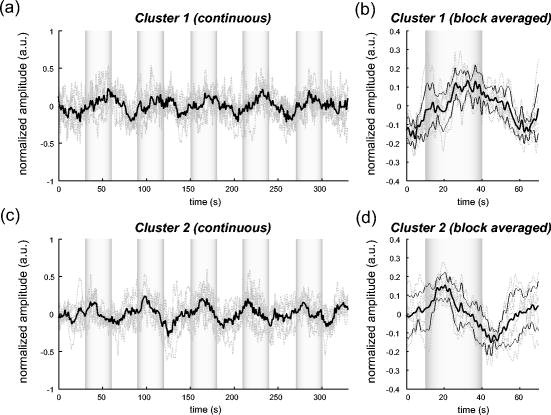
1.IntroductionIndependent component analysis1, 2, 3, 4, 5 (ICA) is a useful method for analyzing functional magnetic resonance imaging (fMRI) or optical topography6, 7, 8 (OT) signals because they both contain components due to system noise and due to physiological changes other than neuronal activation-induced blood oxygenation changes.9, 10, 11, 12, 13, 14 ICA, however, still has some problems when used in practical applications. One of these problems is that the separated ICs need to be assigned by using another procedure for each case. In fMRI studies, we can extract neuronal activity-related ICs by calculating the correlation between the ICs and well-established model functions for neuronal activation signals. However, in OT studies, we have not obtained such model functions yet. We have developed an analysis procedure for extracting ICs related to neuronal activation separated from OT signals that does not need any model functions. Functional brain imaging studies involve investigating the response of localized cortical activations to experimental tasks. Regional cerebral hemodynamic changes are thought to be related to localized cortical activations. However, these changes are sometimes affected by systemic hemodynamics. Any systemic hemodynamic changes occurring during experimental tasks interfere with the measured cerebral hemodynamic changes and obscure the results even if the actual neuronal activations related to the experimental tasks are localized in certain cortical areas.15 These systemic hemodynamic changes are considered global noise components when the measurement is intended to examine a localized brain function. When the amplitudes of these components are negligible, the interference caused by them may not be a serious problem. However, in experiments using motor tasks that affect systemic hemodynamics, the measured hemodynamic changes may contain systemic changes, such as noise that are not negligible. Nonnegligible systemic changes may also occur in experiments involving cognitive tasks that may affect the autonomic nervous system. Any analysis of these noisy OT signals must take this effect into account and treat the noise as appropriately as possible. Using a simple bandpass filter is not the best way to remove signals caused by systemic hemodynamic changes because the signals always fluctuate across a wide range of frequencies, including fluctuations due to hemoglobin changes caused by cortical activation.12, 13 There are three stages in the analysis procedure we propose (Fig. 1 ). In the first stage, we use ICA to separate the signals measured by OT, which are a combination of source signals. In the second stage, ICs are selected based on mean intertrial cross-correlation (MITC), which is a measure of appropriateness for task-related ICs (TR-ICs). If a given IC is reproducible over repeated trials, it can be regarded as a TR-IC. However, both systemic changes and cortical activation changes are sometimes TR changes.10, 11, 13 Therefore, in the third stage, we first categorize TR-ICs into two clusters using a -means clustering method. One of the two clusters is expected to consist of TR neuronal activation-related ICs (TR-AICs) and the other of TR noise ICs (TR-NICs). This method works well when the waveforms of the two types of TR-ICs are significantly different. Then, after categorizing the TR-ICs into two clusters, we classify the clusters. We use locality of brain function to determine whether a cluster corresponds to TR-AIC or TR-NIC. If the cluster indicates an explicit locality, then it can be classified as TR-AIC. Such an approach will be also be useful for model-based analysis methods because it will provide helpful information for constructing empirical models for task-induced cerebral hemodynamic changes. Fig. 1Schematic diagram of data analysis. Participant data was separately analyzed in first and second stages. Then, TR-ICs, results from second stage, were collected from all participants and classified in third stage. 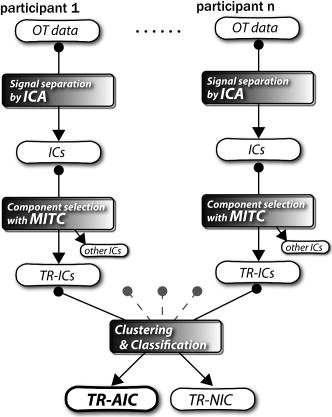 There have been numerous fMRI studies that used the ICA method to separate mixed activation signals (i.e., signals containing activation signals and noises). 16, 17, 18, 19, 20, 21, 22, 23, 24, 25 For example, Bartels and Zeki16 reported using a spatial-ICA method. To clarify whether ICs were appropriate, they checked the spatial and temporal attributes of ICs. They also determined the relationships between ICs using the IC’s temporal aspects. In OT studies, new analysis approaches that treat noises in observed signals have been developed.15, 26, 27, 28, 29 Shroeter 29 and Plichta 28 used a model-based analysis approach based on a general linear model to extract cortical activation changes from noisy OT signals. Zhang 15 proposed using an analysis procedure without using a hemodynamic model. They assumed that the signals measured in the resting period contain only systemic or other noises and filtered out noises in the activation period by eigenvector-based filtering to reduce physiological interference in diffuse optical imaging. Morren 27 demonstrated the potential of the ICA method in extracting fast neuronal signals in the motor cortex. For the data from finger tapping at the heart beats, they used a second-order blind-identification algorithm, which is the same as the ICA algorithm we use. They found that the power of selected ICs at a given finger-tapping frequency was larger in a task period than in a rest period in 9 out of 14 subjects. Akgul 26 also applied the ICA method (FastICA30) to extract cognitive activity-related waveforms. They checked the correlation coefficient (CC) between separated ICs and a Gamma function model for brain hemodynamic response (BHR). The CC for an oddball task period was larger than the CC for a rest period. They concluded that it was plausible that waveforms extracted using the ICA method were related to BHR. In our study, to demonstrate the general applicability of the ICA method, we analyzed the data for a block-design paradigm and evaluated the results without using the hypothetical hemodynamic model function. 2.Method2.1.Participants and Experimental ParadigmOT data obtained from 30 healthy adult participants (20 males, 10 females), all of whom were righthanded, was used in this study. All participants gave informed consent before participation. The data set we used in this study was the same data described by Sato 31 In the task period, participants were asked to tap their left or right thumb and one of their other fingers sequentially and continuously after the visual cue, an asterisk, began blinking at . The experimental paradigm consisted of five repetitive sets. Each set consisted of a rest period and a task period. All participants performed the task once with their left hand and once with their right hand. Participants were told to relax in a dark room. In addition, 29 of the 30 participants were assigned no tasks but still saw the same visual cues as were presented in the experimental tasks. 2.2.Data AcquisitionAll data were measured using an ETG-100 (Hitachi Medical Corporation, Japan), which had 24 measurement positions. The wavelengths of the irradiation light were 780 and . The light was modulated at different frequencies. The signals for all measurement positions were sampled simultaneously at a frequency of . Twelve probes used to measure responses were arranged on a 3-by-3 probe holder (Fig. 2 ), with one probe holder on each side of the participant’s head. The center of the probe holder was C3 or C4 (as defined by the international 10–20 system32), which is where the sensorimotor cortex is located. 2.3.Time-Delayed Decorrelation AlgorithmWe used the time-delayed decorrelation algorithm (TDD) to separate OT signals. The TDD is based on the time structure of data (temporal ICA).1, 2, 33, 34, 35, 36 In this analysis, we assumed that the cross-correlations between different source signals vanished with any time delay (i.e., the independence of source signals is represented by a zero cross-correlation in any time delay). Detailed explanations of the TDD can be found in previous studies.33, 34, 36 2.4.Analysis Procedure2.4.1.Signal preprocessingWe analyzed all the signals using a software we developed called the Platform for Optical Topography Analysis Tools, a plug-in-based analysis platform that runs on Matlab® 6.5 (Math Works, Inc.). We preprocessed all the data in the following way. First, we passed the data through a bandpass filter with a bandwidth of 0.008 to with a rectangular window. Second, we detected motion artifacts based on the criteria that the signal change between two successive samplings is or that the support of the signal values for each measurement position is . The measured positions of a motion artifact were excluded from the analysis even if the artifact was found only once. 2.4.2.Signal separationWe conducted principal component analysis (PCA) on the obtained data to denoise the data set and to truncate the data dimension as the first step in signal separation. The original data were collected from 24 measurement positions that took 3000 samplings (at a sampling frequency of ). The PCA truncation neglects components that contribute of the total energy. Thus, the component numbers of all the data sets were reduced from 24 to . In the second step, we applied TDD to the PCA denoised data set separately for each participant. We set the time delay between 0 and in steps. In the third step, we selected TR-ICs from all the ICs from all participants. The criterion for detecting TR-ICs was intertrial reproducibility, which was measured by using the MITC obtained from the time course data for ICs alone. This was not a model-based method, but rather a data-based one. The MITC is the average value of the interblock correlation coefficients over all the pairs of blocks. In this study, the number of pairs is 10 because the number of blocks is 5 for each session . To select TR-ICs from all the ICs, in our group analysis, we set a criterion that MITC was . This threshold was determined for each experimental condition based on the distribution of the MITC values. As shown in Fig. 3 , for all the experimental conditions the MITC value symmetrically distributes around zero within a range of to 0.2, where the corresponding IC does not seem to be task related. We normalized all TR-ICs (mean 0, ) for further group analysis. Note that we applied smoothing to all trial data with a Gaussian kernel in order to calculate MITC (FWHM ). Fig. 3Histograms of MITC distributions for LT, RT, and NT. (a), (c), and (e) represent oxy-Hb, and (b), (d), and (f) represent deoxy-Hb for LT, RT, and NT, respectively. 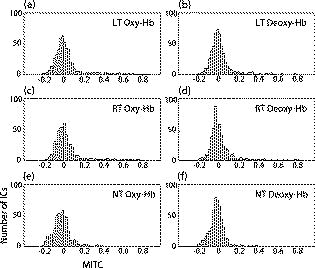 Another criterion for finding TR-ICs is a model-based one that checks cross-correlation between the ICs and the model function. This method relies entirely on the accuracy of the model. The problem is that such accuracy has not yet been established for OT signals. However, OT signals are clear enough compared to fMRI signals for their wave-form characteristics to be determined. Therefore, it is possible to select TR-ICs based on the reproducibility of waveforms for repetitive trials. Such reproducibility is a basic concept in functional brain imaging. This criterion is more robust than the model-based one. 2.4.3.Evaluation of task-related independent componentsAssuming that TR-ICs were of two types, we classified them into TR-AIC and TR-NIC clusters. We also assumed that time courses of two types of TR-ICs differed and used a -means clustering method. The distance measure in the clustering process was based on the Pearson correlation coefficient. To classify signals using waveforms rather than amplitudes, we normalized the components and determined the sign of the IC so that the correlation between the boxcar waveform and the IC became positive. The data for the three experimental conditions [left-handed finger tapping (LT), right-handed finger tapping (RT), and no-task (NT)] were analyzed separately. To assign classified clusters, we examined the “spatial” attribute of each IC derived from temporal ICA, which is based on only the time structure of signals and not on the spatial attribute. The activation area is thought to be localized in a certain cortical subdivision; therefore, if a TR-IC is definitely localized, then the TR-IC can be classified as a TR-AIC. In this study, however, because we focused only on the sensorimotor cortex area, the measurement area was not large enough to determine the general locality. Therefore, we adopted a laterality index as a measure of locality. If the spatial attribute of a TR-IC represents the definite contralaterality in a one-hand finger-tapping task, the TR-IC belongs to a TR-AIC. This criterion was adopted for determining which of the two clusters corresponds to the set of TR-AICs. We used the weighted laterality index (wLI)37, 38 to quantify the laterality of each TR-IC. The wLI indicates the degree of laterality from (completely lateralized to the right hemisphere) to 1 (completely lateralized to the left hemisphere). To calculate the wLI, we obtained the spatial weight of the TR-IC under consideration for each measurement position by setting to zero if the spatial weight was smaller than half the value of the maximum of . Using , we defined wLI as where and are two parts of , whose measurement positions are in the left and right hemispheres, respectively. The sums were taken over measurement positions in each hemisphere.3.ResultsFigure 4 shows oxy hemoglobin (oxy-Hb) changes for LT. The time courses for clusters 1 and 2 continuous and block averaged over five trials are shown in Figs. 4a, 4c, 4b, 4d, respectively. Clear task-related changes can be seen with a few-seconds delay. The same tendency is found in the results for RT (Fig. 5 ). Fig. 4Time courses in clusters for LT for oxy-Hb. All ICs in each cluster are shown as gray dotted lines. Mean of ICs in cluster is shown as solid black line. In block-averaged data [(b), (c)], thin solid black lines indicate standard deviation of ICs in cluster. The task period is shown as a gray rectangle. Amplitudes of all ICs are normalized: (a) Continuous time courses in cluster 1, (b) block-averaged time courses in cluster 1, (c) continuous time courses in cluster 2, (d) block-averaged time courses in cluster 2. 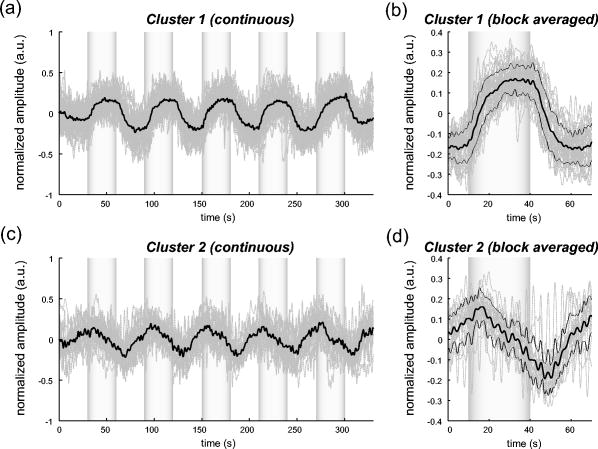 In cluster 1 [Fig. 4a and 4b], there is a small overshoot of a few seconds after the onset of each task and a few seconds after it ends, which is often found in the results of motor task experiments. Steady-state periods appear in the middle of the trial but are not completely stable. The signals increase continuously and converge at a peak a few seconds after the end of the task. After the peak, the signals fall rapidly to the baseline. Cluster 2 also shows task-related changes. However, it shows no steady-state period, and the time structure is an N-shaped pattern with its inflection points appearing a few seconds after the start and end of the task period. The amplitude power ratios of TR-ICs are shown in Table 1 . The mean amplitude power ratios, which are averaged values of power ratios for all participants for each experimental condition, are shown in Fig. 6 . For evaluation of the power contribution ratio of selected TR-ICs to all separated ICs, we defined the amplitude power ratio with the following equation: where index is the channel number and index is the component number, and is the weight value for the component at the channel. The mean amplitude power ratio of LT-cluster 1 is larger than that of RT-cluster 1 for oxy-Hb . The averaged MITC values tend to be higher in cluster 1 than in cluster 2. The values are in both clusters (Table 2 ).Fig. 6Averaged power ratios for oxy-Hb changes. Error bar indicates standard deviation over ICs in cluster. Averaged power ratio for LT-cluster 1 is larger than that for RT-cluster 1 . 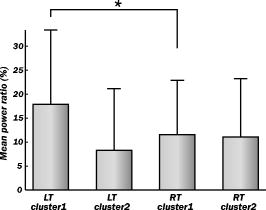 Table 1Amplitude power ratio of TR-ICs for all 30 participants in percent.
Table 2Derived values averaged for ICs in cluster.
To assign the two clusters, we checked the spatial attributes of the clusters by introducing wLI. The wLI values are and for LT-clusters 1 and 2, respectively (Table 2). The wLI of LT-cluster 1 shows clear contralaterality ( ; hypothesis is ), but cluster 2 does not . The same results are also found in the wLI values for RT clusters. Results for deoxy hemoglobin (deoxy-Hb) are shown in Figs. 7 and 8 and Tables 1, 2. The extracted time courses are almost the same as those for oxy-Hb (Figs. 7 and 8). The amplitude power ratios of deoxy-Hb differ significantly between clusters 1 and 2 for deoxy-Hb but not for oxy-Hb (Table 1). The averaged MITCs for deoxy-Hb are similar to those for oxy-Hb (Table 2). The values of wLI show contralaterality for both LT and RT that is statistically significant in LT but not in RT . The mean-amplitude-power ratios of TR-ICs are and for oxy- and deoxy-Hb concentration changes, respectively, for NT (Table 1). These ratios are smaller than those for LT and RT. The numbers of TR-ICs found in all extracted ICs from all participants are also smaller than those in LT and RT. For oxy-Hb concentration changes, the numbers of the TR-ICs found are 55, 51, and 14, while the total number of ICs are 522, 503, and 476 for LT, RT, and NT, respectively. For deoxy-Hb concentration changes, the numbers of the TR-ICs found are 44, 42, and 8, while the total numbers of ICs are 540, 512, and 512 for LT, RT, and NT, respectively. Figure 9 shows the time courses of TR-ICs for oxy-Hb concentration changes for NT. 4.Discussion4.1.Assignment of Cluster 1Cluster 1, which is related to TR-AIC based on their waveforms, showed definite contralaterality in its spatial weight patterns. It has been wellknown that cortical activation maps show contralaterality for one-handed motor tasks 10, 11, 13, 15, 27, 31, 39. But the contralaterality found in cluster 1 is not self-evident from our analysis procedure because no spatial attribute was used in selecting ICs. This indicates that application of the ICA to OT signal analysis is valid. There was no time delay in the peak between oxy-Hb and deoxy-Hb. If oxy- and deoxy-Hb for cluster 1 are both pure TR-AICs, then it can be said that such peak time property agrees with the results reported by Boden 10 They reviewed latency differences between oxy- and deoxy-Hb measured in the visual and the motor cortex. The latency differences measured in the visual area , but those measured in the motor area were , according to other researchers’ reports. 11, 40, 41, 42, 43, 44, 45, 46, 47 In the study by Boden, however, they have shown that the latency difference was in motor area by using experimental tasks that retain subject’s autonomic load.10 It was considered that the discrepancy in latency differences between the visual and the motor cortex was caused from the difference of hemodynamic regulatory mechanism or neuronal activations between two areas.48, 49, 50 But the study by Boden provides another possible hypothesis that the systemic changes cause the latency differences between oxy- and deoxy-Hb in functional NIRS10. As described in Section 4.2, we can demonstrate that such systemic changes are closely related to the components in cluster 2. 4.2.Assignment of Cluster 2The waveforms of the ICs in cluster 2 are different from those of the TR-AICs. The waveforms are composed of a continuous linear change that appears a few seconds after the onset of the task and an opposite linear change that appears a few seconds after the task ended. The spatial pattern has little laterality. This spatial feature suggests that the ICs in cluster 2 represent systemic changes. Boden 10 reported that the systemic changes related to motor tasks tended to spread globally and caused short latency for oxy-Hb. The waveforms of the ICs in cluster 2 seem to have both of these features. Their study gives further support to this assignment. They reported that the waveforms for oxy- and deoxy-Hb are the same when they used an experimental paradigm with alternating contra- and ipsilateral motor tasks without interspersed rest periods. As seen in Figs. 4, 5, 7, 9, the waveforms of oxy- and deoxy-Hb in cluster 1 are also the same even though our experiment consisted of alternating task and rest periods where the systemic changes were not intentionally eliminated. Therefore, cluster 2 must contain the ICs related to systemic changes occurring in our experiment. We conclude that cluster 2 corresponds to the TR-NIC of systemic changes. There are several possible causes of the systemic hemodynamic changes (e.g., changes in heart rate, blood pressure, and respiration). Heart rates increase during motor tasks, including finger tapping.11, 13 Also in our experiment, the heart rates increased from to on average for all participants for LT (these heart rates were derived from pulsations observed in OT signals). Such systemic changes can disturb OT signals more than fMRI signals because OT signals are affected by all the tissues through which the near-infrared light travels. The hemodynamic changes in the extracerebral compartment are mainly systemic changes. Further discussion on TR-NIC would require simultaneous measurements of various physiological parameters with OT. 4.3.Effect of Use of Dominant or Nondominant HandThere is little difference between the waveforms of the ICs in clusters 1 and 2 for oxy- and deoxy-Hb for both LT (nondominant hand) and RT (dominant hand) tasks. The amplitude power ratios for deoxy-Hb for LT are approximately equal to those for RT. However, there are differences between the amplitude power ratios for oxy-Hb for LT and RT (Fig. 6). For oxy-Hb, the power ratio in LT-cluster 1 is significantly larger than that in RT-cluster 1 and that in LT-cluster 2; however, there are no differences between those for RT-cluster 1 and RT-cluster 2. Jäncke 39 focused on the differences in cortical activation caused by finger tapping with the dominant and the nondominant hand in right-handed subjects. They found that left-handed (nondominant) tapping tasks activated a larger area of the motor cortex compared to right-handed (dominant) tapping tasks. These differences found in our results may be related to handedness. 4.4.No-Task ConditionThere were few TR-ICs for NT. This is because participants were instructed not to voluntarily move. A learning effect is a possible reason that TR-ICs were detected for NT because the experiments for NT were performed after the experiments for LT and RT. The results for NT prove that the results for LT and RT are not artifacts caused by the analysis. 5.ConclusionWe proposed an analysis procedure for extracting ICs related to neuronal activation separated from OT signals without using any model functions. We used a TDD for signal separation, a MITC as a criterion for selecting TR-ICs, and a clustering method for classifying TR-ICs into TR-AICs and TR-NICs, such as physiological changes. The data set we used was obtained from one-handed finger-tapping experiments. We found that a cluster of TR-AICs showed distinct contralaterality, whereas another cluster, thought to be of TR-NICs, did not. We obtained TR-AICs without using model-based analysis. We conclude that the analysis procedure we proposed in this study is useful for analyzing OT data. ReferencesS. Amari,
“Estimating functions of independent component analysis for temporally correlated signals,”
Neural Comput., 12
(9), 2083
–2107
(2000). https://doi.org/10.1162/089976600300015079 0899-7667 Google Scholar
J. F. Cardoso,
“Blind signal separation: Statistical principles,”
Proc. IEEE, 86
(10), 2009
–2025
(1998). https://doi.org/10.1109/5.720250 0018-9219 Google Scholar
M. Girolami, Advances in Independent Component Analysis, Springer-Verlag, London
(2000). Google Scholar
A. Hyvärinen.,
J. Karhunen, and
E. Oja, Independent Component Analysis, Wiley, Hoboken, NJ
(2001). Google Scholar
T. W. Lee, Independent Component Analysis Theory and Applications, Kluwer, Boston
(1998). Google Scholar
H. Koizumi,
Y. Yamashita,
A. Maki,
T. Yamamoto,
Y. Ito,
H. Itagaki, and
R. Kennan,
“Higher-order brain function analysis by trans-cranial dynamic near-infrared spectroscopy imaging,”
J. Biomed. Opt., 4
(4), 403
–413
(1999). https://doi.org/10.1117/1.429959 1083-3668 Google Scholar
A. Maki,
Y. Yamashita,
Y. Ito,
E. Watanabe,
Y. Mayanagi, and
H. Koizumi,
“Spatial and temporal analysis of human motor activity using noninvasive NIR topography,”
Med. Phys., 22
(12), 1997
–2005
(1995). https://doi.org/10.1118/1.597496 0094-2405 Google Scholar
A. Maki,
Y. Yamashita,
E. Watanabe,
T. Yamamoto,
K. Kogure,
F. Kawaguchi, and
H. Koizumi,
“Optical topography,”
Optical Tomography and Spectroscopy of Tissue III, 202 SPIE, Bellingham, WA
(1999). Google Scholar
R. M. Birn,
J. B. Diamond,
M. A. Smith, and
P. A. Bandettini,
“Separating respiratory-variation-related fluctuations from neuronal-activity-related fluctuations in fMRI,”
Neuroimage, 31
(4), 1536
–1548
(2006). 1053-8119 Google Scholar
S. Boden,
H. Obrig,
C. Kohncke,
H. Benav,
S. P. Koch, and
J. Steinbrink,
“The oxygenation response to functional stimulation: Is there a physiological meaning to the lag between parameters?,”
Neuroimage, 36
(1), 100
–107
(2007). 1053-8119 Google Scholar
M. A. Franceschini,
S. Fantini,
J. H. Thompson,
J. P. Culver, and
D. A. Boas,
“Hemodynamic evoked response of the sensorimotor cortex measured noninvasively with near-infrared optical imaging,”
Psychophysiology, 40
(4), 548
–560
(2003). https://doi.org/10.1111/1469-8986.00057 0048-5772 Google Scholar
T. Katura,
N. Tanaka,
A. Obata,
H. Sato, and
A. Maki,
“Quantitative evaluation of interrelations between spontaneous low-frequency oscillations in cerebral hemodynamics and systemic cardiovascular dynamics,”
Neuroimage, 31
(4), 1592
–1600
(2006). 1053-8119 Google Scholar
M. Moody,
R. B. Panerai,
P. J. Eames, and
J. F. Potter,
“Cerebral and systemic hemodynamic changes during cognitive and motor activation paradigms,”
Am. J. Physiol. Regulatory Integrative Comp. Physiol., 288
(6), R1581
–1588
(2005). 0363-6119 Google Scholar
H. Obrig,
M. Neufang,
R. Wenzel,
M. Kohl,
J. Steinbrink,
K. Einhaupl, and
A. Villringer,
“Spontaneous low frequency oscillations of cerebral hemodynamics and metabolism in human adults,”
Neuroimage, 12
(6), 623
–639
(2000). 1053-8119 Google Scholar
Y. Zhang,
D. H. Brooks,
M. A. Franceschini, and
D. A. Boas,
“Eigenvector-based spatial filtering for reduction of physiological interference in diffuse optical imaging,”
J. Biomed. Opt., 10
(1), 11014
(2005). 1083-3668 Google Scholar
A. Bartels and
S. Zeki,
“The chronoarchitecture of the human brain--natural viewing conditions reveal a time-based anatomy of the brain,”
Neuroimage, 22
(1), 419
–433
(2004). 1053-8119 Google Scholar
V. D. Calhoun,
T. Adali,
G. D. Pearlson, and
J. J. Pekar,
“A method for making group inferences from functional MRI data using independent component analysis,”
Hum. Brain Mapp, 14
(3), 140
–151
(2001). 1065-9471 Google Scholar
J. R. Duann,
T. P. Jung,
W. J. Kuo,
T. C. Yeh,
S. Makeig,
J. C. Hsieh, and
T. J. Sejnowski,
“Single-trial variability in event-related BOLD signals,”
Neuroimage, 15
(4), 823
–835
(2002). 1053-8119 Google Scholar
L. K. Hansen,
J. Larsen,
F. A. Nielsen,
S. C. Strother,
E. Rostrup,
R. Savoy,
N. Lange,
J. Sidtis,
C. Svarer, and
O. B. Paulson,
“Generalizable patterns in neuroimaging: How many principal components?,”
Neuroimage, 9
(5), 534
–544
(1999). 1053-8119 Google Scholar
M. J. McKeown,
“Detection of consistently task-related activations in fMRI data with hybrid independent component analysis,”
Neuroimage, 11
(1), 24
–35
(2000). 1053-8119 Google Scholar
M. J. McKeown,
L. K. Hansen, and
T. J. Sejnowsk,
“Independent component analysis of functional MRI: What is signal and what is noise?,”
Curr. Opin. Neurobiol., 13
(5), 620
–629
(2003). 0959-4388 Google Scholar
M. A. Quigley,
V. M. Haughton,
J. Carew,
D. Cordes,
C. H. Moritz, and
M. E. Meyerand,
“Comparison of independent component analysis and conventional hypothesis-driven analysis for clinical functional MR image processing,”
AJNR Am. J. Neuroradiol., 23
(1), 49
–58
(2002). 0195-6108 Google Scholar
J. V. Stone,
J. Porrill,
N. R. Porter, and
I. D. Wilkinson,
“Spatiotemporal independent component analysis of event-related fMRI data using skewed probability density functions,”
Neuroimage, 15
(2), 407
–421
(2002). 1053-8119 Google Scholar
M. Svensen,
F. Kruggel, and
H. Benali,
“ICA of fMRI group study data,”
Neuroimage, 16
(3 Pt 1), 551
–563
(2002). 1053-8119 Google Scholar
C. G. Thomas,
R. A. Harshman, and
R. S. Menon,
“Noise reduction in BOLD-based fMRI using component analysis,”
Neuroimage, 17
(3), 1521
–1537
(2002). 1053-8119 Google Scholar
C. B. Akgul,
A. Akin, and
B. Sankur,
“Extraction of cognitive activity-related waveforms from functional near-infrared spectroscopy signals,”
Med. Biol. Eng. Comput., 44
(11), 945
–958
(2006). https://doi.org/10.1007/s11517-006-0116-3 0140-0118 Google Scholar
G. Morren,
U. Wolf,
P. Lemmerling,
M. Wolf,
J. H. Choi,
E. Gratton,
L. De Lathauwer, and
S. Van Huffel,
“Detection of fast neuronal signals in the motor cortex from functional near infrared spectroscopy measurements using independent component analysis,”
Med. Biol. Eng. Comput., 42
(1), 92
–99
(2004). https://doi.org/10.1007/BF02351016 0140-0118 Google Scholar
M. M. Plichta,
S. Heinzel,
A. C. Ehlis,
P. Pauli, and
A. J. Fallgatter,
“Model-based analysis of rapid event-related functional near-infrared spectroscopy (NIRS) data: A parametric validation study,”
Neuroimage, 35
(2), 625
–634
(2007). 1053-8119 Google Scholar
M. L. Schroeter,
M. M. Bucheler,
K. Muller,
K. Uludag,
H. Obrig,
G. Lohmann,
M. Tittgemeyer,
A. Villringer, and
D. Y. von Cramon,
“Towards a standard analysis for functional near-infrared imaging,”
Neuroimage, 21
(1), 283
–290
(2004). 1053-8119 Google Scholar
A. Hyvärinen and
E. Oja,
“A fast fixed-point algorithm for independent component analysis,”
Neural Comput., 9
(7), 1483
–1492
(1997). https://doi.org/10.1162/neco.1997.9.7.1483 0899-7667 Google Scholar
H. Sato,
Y. Fuchino,
M. Kiguchi,
T. Katura,
A. Maki,
T. Yoro, and
H. Koizumi,
“Intersubject variability of near-infrared spectroscopy signals during sensorimotor cortex activation,”
J. Biomed. Opt., 10
(4), 44001
(2005). 1083-3668 Google Scholar
G. H. Klem,
H. O. Luders,
H. H. Jasper, and
C. Elger,
“The ten-twenty electrode system of the International Federation. The International Federation of Clinical Neurophysiology,”
Electroencephalogr Clin. Neurophysiol. Suppl., 52 3
–6
(1999). 0424-8155 Google Scholar
J.-F. Cardoso and
A. Souloumiac,
“Jacobi angles for simultaneous diagonalization,”
SIAM J. Matrix Anal. Appl., 17
(1), 161
–164
(1996). https://doi.org/10.1137/S0895479893259546 0895-4798 Google Scholar
R. Hirosaka,
T. Katura,
H. Kawaguchi,
N. Tanaka, and
M. Iwamoto,
“Noisy time-delayed decorrelation and its application to extraction of neural activity from single optical recordings in guinea pigs,”
Physica D, 194
(3–4), 320
–332
(2004). 0167-2789 Google Scholar
L. Molgedey and
H. G. Schuster,
“Separation of a mixture of independent signals using time delayed correlations,”
Phys. Rev. Lett., 72
(23), 3634
–3637
(1994). https://doi.org/10.1103/PhysRevLett.72.3634 0031-9007 Google Scholar
A. Ziehe and
K.-R. Müller,
“TDSEP an efficient algorithm for blind separation using time structure,”
675
–680
(1998). Google Scholar
C. Calautti,
M. Naccarato,
P. S. Jones,
N. Sharma,
D. D. Day,
A. T. Carpenter,
E. T. Bullmore,
E. A. Warburton, and
J. C. Baron,
“The relationship between motor deficit and hemisphere activation balance after stroke: A 3T fMRI study,”
Neuroimage, 34
(1), 322
–331
(2007). 1053-8119 Google Scholar
G. Fernandez,
A. de Greiff,
J. von Oertzen,
M. Reuber,
S. Lun,
P. Klaver,
J. Ruhlmann,
J. Reul, and
C. E. Elger,
“Language mapping in less than : Real-time functional MRI during routine clinical investigation,”
Neuroimage, 14
(3), 585
–594
(2001). 1053-8119 Google Scholar
L. Jäncke,
M. Peters,
G. Schlaug,
S. Posse,
H. Steinmetz, and
H. Muller-Gartner,
“Differential magnetic resonance signal change in human sensorimotor cortex to finger movements of different rate of the dominant and subdominant hand,”
Brain Res. Cognit. Brain Res., 6
(4), 279
–284
(1998). 0926-6410 Google Scholar
W. N. J. M. Colier,
V. Quaresima,
R. Wenzel,
M. C. van der Sluijs,
B. Oeseburg,
M. Ferrari, and
A. Villringer,
“Simultaneous near-infrared spectroscopy monitoring of left and right occipital areas reveals contra-lateral hemodynamic changes upon hemi-field paradigm,”
Vision Res., 41
(1), 97
–102
(2001). 0042-6989 Google Scholar
R. D. Hoge,
M. A. Franceschini,
R. J. M. Covolan,
T. Huppert,
J. B. Mandeville, and
D. A. Boas,
“Simultaneous recording of task-induced changes in blood oxygenation, volume, and flow using diffuse optical imaging and arterial spin-labeling MRI,”
Neuroimage, 25
(3), 701
–707
(2005). 1053-8119 Google Scholar
T. J. Huppert,
R. D. Hoge,
S. G. Diamond,
M. A. Franceschini, and
D. A. Boas,
“A temporal comparison of BOLD, ASL, and NIRS hemodynamic responses to motor stimuli in adult humans,”
Neuroimage, 29
(2), 368
–382
(2006). 1053-8119 Google Scholar
G. Jasdzewski,
G. Strangman,
J. Wagner,
K. K. Kwong,
R. A. Poldrack, and
D. A. Boas,
“Differences in the hemodynamic response to event-related motor and visual paradigms as measured by near-infrared spectroscopy,”
Neuroimage, 20
(1), 479
–488
(2003). 1053-8119 Google Scholar
A. Kleinschmidt,
H. Obrig,
M. Requardt,
K.-D. Merboldt,
U. Dirnagl,
A. Villringer, and
J. Frahm,
“Simultaneous recording of cerebral blood oxygenation changes during human brain activation by magnetic resonance imaging and near-infrared spectroscopy,”
J. Cereb. Blood Flow Metab., 16
(5), 817
–826
(1996). https://doi.org/10.1097/00004647-199609000-00006 0271-678X Google Scholar
H. Obrig,
C. Hirth,
J. G. Junge-Hulsing,
C. Doge,
T. Wolf,
U. Dirnagl, and
A. Villringer,
“Cerebral oxygenation changes in response to motor stimulation,”
J. Appl. Physiol., 81
(3), 1174
–1183
(1996). 8750-7587 Google Scholar
P. Wobst,
R. Wenzel,
M. Kohl,
H. Obrig, and
A. Villringer,
“Linear aspects of changes in deoxygenated hemoglobin concentration and cytochrome oxidase oxidation during brain activation,”
Neuroimage, 13
(3), 520
–530
(2001). 1053-8119 Google Scholar
M. Wolf,
U. Wolf,
V. Toronov,
A. Michalos,
L. A. Paunescu,
J. H. Choi, and
E. Gratton,
“Different time evolution of oxyhemoglobin and deoxyhemoglobin concentration changes in the visual and motor cortices during functional stimulation: A near-infrared spectroscopy study,”
Neuroimage, 16 704
–712
(2002). 1053-8119 Google Scholar
R. B. Buxton and
L. R. Frank,
“A model for the coupling between cerebral blood flow and oxygen metabolism during neural stimulation,”
J. Cereb. Blood Flow Metab., 17
(1), 64
–72
(1997). https://doi.org/10.1097/00004647-199701000-00009 0271-678X Google Scholar
R. B. Buxton,
K. Uludag,
D. J. Dubowitz, and
T. T. Liu,
“Modeling the hemodynamic response to brain activation,”
Neuroimage, 23 S220
–S233
(2004). 1053-8119 Google Scholar
R. B. Buxton,
E. C. Wong, and
L. R. Frank,
“Dynamics of blood flow and oxygenation changes during brain activation: The balloon model,”
Magn. Reson. Med., 39
(6), 855
–864
(1998). https://doi.org/10.1002/mrm.1910390602 0740-3194 Google Scholar
|
|||||||||||||||||||||||||||||||||||||||||||||||||||||||||||||||||||||||||||||||||||||||||||||||||||||||||||||||||||||||||||||||||||||||||||||||||||||||||||||||||||||||||||||||||||||||||||||||||||||||||||||||||||||||||||||||||||||||||||||||||||||||||||||||||||||||||||||||||||||||||||||||||||||||||||||||||||||||||||||||||||||||||||||||||||||||||||||||||||||||||||||||||||||||||||||||||||||||||||||||||||||||||||||||||||||||||||||||||||||||||||||||||||||||||