|
|
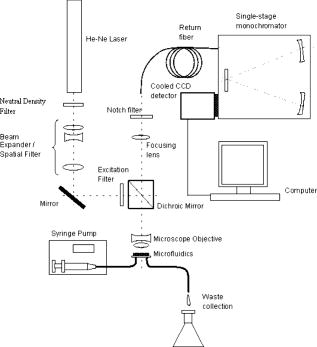
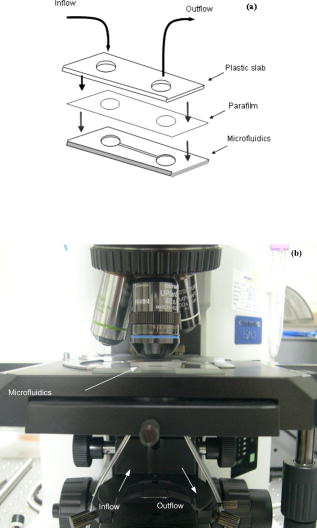
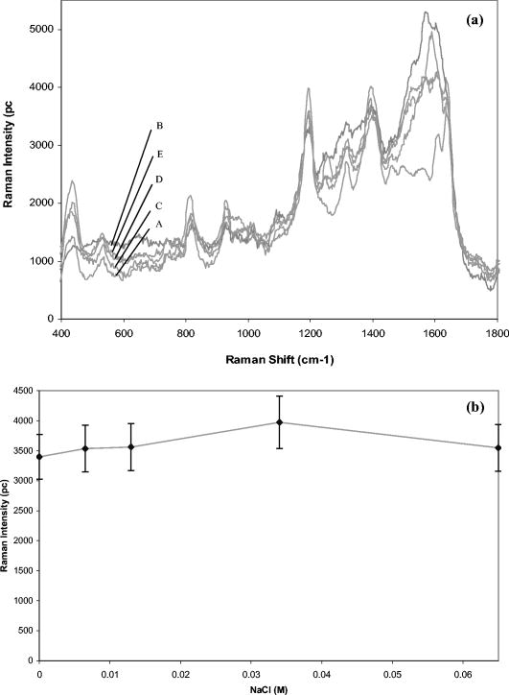
1.IntroductionBiofluids contain vital medical information that is often used for patient diagnosis when symptomatic information is ambiguous.1, 2, 3, 4 Generally, a biofluid analysis would involve detection of a specific molecule of interest within a complex sample, which conventionally entails the use of such separation techniques as high-performance liquid chromatography or high-performance capillary electrophoresis, which are time-consuming procedures.5, 6 The isolated molecule can then be quantitated by some optical means, which is a preferred choice for reason of economic. However, the amount of starting materials needed by these approaches is often considerable, which can be a practical issue especially in a clinical setting.7 A microfluidic device, consisting of miniaturized fluidic networks fabricated on a polymer platform, represents an effective way of handling a minute amount of biofluid samples for chemical and biochemical analysis.8, 9, 10, 11, 12 A sample volume of or less would be sufficient in any microfluidic experiment. Furthermore, both mixing and chemical reaction of the sample with reagents can be performed in one single microfluidic chip. It is also possible to monitor the reaction near realtime, owing to the small size of the device, thereby reducing the analysis time and providing a point-of-care capability.13 In addition to these, microfluidics also offers a means for mass-produced, low-cost, single-use devices for disease screening and diagnosis.14, 15 In order to serve as a self-contained platform, microfluidics must be able to provide a means for molecular identification. As such, an in-chip purification system has been developed that allows a molecule of interest to be separated out from the sample or mixture of products generated from the biochemical reaction.13, 16, 17 Unfortunately, microfluidic separation suffers from the same problems of irreproducible migration times as in capillary electrophoresis (CE) due to the channel wall characteristic. In another example, a specific fluorescent labeler is introduced into the microchannel that tags itself to the target molecules, thereby allowing them to be separated optically,18 or alternatively a mass spectrometer may be used, at the expense of an increased system cost.19 Raman spectroscopy, on the other hand, can identify a specific chemical within a sample without the need of molecule separation.20, 21, 22 It is a cheap alternative as a read-out system ($6,000 to $150,000) compared to a mass spectroscopy and, thus, a more favorable choice for lab-in-the-office applications. Furthermore, simultaneous detection of multiple analytes via Raman is possible owing to the narrow peaks in a Raman spectrum, which minimizes spectral overlap. The combination of Raman with microfluidics may thus lead to a much simpler design and hence affordable commercial price per chip. Raman spectroscopy works by measuring the vibrational frequency of the structure of a molecule using a laser beam. Depending on the constituent atomic masses and the molecular bond strengths, each molecule gives a unique set of vibrational frequencies (or sometimes termed Raman peaks). The distinct Raman signature of an analyte molecule renders its identification possible even from a complex background consisting of other different molecular species. For example, previous published data have shown the potential of Raman in analyzing such human samples as urine, saliva, and serum,23, 24, 25 and even a relatively more complex sample such as cancerous lesion tissue26 Unfortunately, Raman scattering is an inefficienct process whereby only a millionth of the incident photons is converted into Raman photons. When such a problem becomes critical, surface-enhanced Raman scattering (SERS) can be utilized. In SERS, the analyte molecule of interest is first absorbed onto metallic (e.g., Au or Ag) nanostructures and then illuminated with a laser of appropriate wavelength. If the laser wavelength matches the natural oscillating frequency of the free electrons in the nanostructures, a strong coupling will occur between the oscillating electric fields and the electrons. This results in a region of intense light energy near the edge of or in-between nanostructures (the so-called hot spot), where the absorbed molecules are strongly excited bringing about an amplified Raman scattering. In previous SERS experiments, analyte solutions used were normally applied, in macroquantity, onto a surface bearing a properly roughened metallic structure. However, one can easily envision a commercializable SERS-based analytical device to be a hybrid of the microfluidic platform and SERS-active nanostructures. This can not only reduce the amount of materials needed in one experiment, as was discussed earlier, but at the same time offer the benefits of SERS, such as low detection limit, good chemical sensitivity and photostability (i.e., nonphotobleaching), and label-free detection, which will significantly reduce the analysis time because the incubation step is not required. The idea of SERS-based microfluidics is not new, however, and has been published previously.15, 20, 27, 28, 29 In most cases, metallic colloid was used as the enhancing substrates, which were introduced into the microfluidic device via one of the input ports and then directed to a mixing chamber where it interacts with the analyte of interest that was injected into the system from another port. The colloid-analyte mixture was subsequently directed into a microchannel and traverses through a focused laser beam. As the colloid-analyte flowed through the laser probe volume, SERS signals were collected. However, such a colloid-based system, unfortunately, has a disadvantage because the SERS intensities are generally dependent on the degree of aggregation of the colloid used,27, 30, 31 which is influenced by the ionic strength of the sample and can adversely affect signal reproducibility whenever there is a large variation in the salt content between samples. In contrast to a colloid-based system, SERS microfluidics with immobilized metallic nanostructures incorporated directly into the microchannel does not suffer from issues associated with particle agglomeration and should, in principle, exhibit better signal reproducibility. In a previous report, Liu and Lee demonstrated the use of soft lithography to fabricate immobilized nanowell SERS arrays in a SERS microfluidic biochip.14 However, no mention was made in this particular study on the stability of the nanowell arrays toward ionic-strength variations in the sample nor was the performance of the reported device compared to that of a colloid-based system. It is therefore the primary objective of the current study to perform such a study. Specifically, we have fabricated a periodic SERS-active nanoarray in the microchannel of a SERS microfluidic and subsequently compared its performance to that of a colloid-based system by using artificial samples of different ionic strengths. Finally, as a real-world test, both systems (immobilized and colloid based) were tested and compared on human urine samples. Results are reported and discussed. 2.Experiment2.1.MaterialsA SU-8 50 photoresist, developer, and SU-8 thinner were purchased from MicroChem Inc. and used as received. Crystal Violet (CV) was purchased from Sigma Aldrich. Polystyrene nanosphere (PNS) was obtained from Corpuscular Inc. Sodium dodecyl sulphate (SDS), sodium citrate dihydrate, and hydrogen tetrachloroaurate (III) hydrate were purchased from Sigma Aldrich Inc. 2.2.Experiment SetupThe schematic for the experiment setup is shown in Fig. 1 . Briefly, a He–Ne laser (Thorlab) was attenuated to using a neutral density filter (Edmund Inc.). A set of lenses, which acts as both a beam expander and spatial filter, was used to produce a (Ø) beam of uniform profile. The so-obtained beam was then focused onto the microchannel in the microfluidics via a dichroic mirror and through an Olympus , microscope objective. The laser power at the sample was measured to be . Raman signals generated from the microfluidics were collected by the same objective and focused into a optical fiber (Ocean Optics, Inc.), which delivered the signals to a single-stage monochromator (DoongWo, Inc.). Grating used in this study was , and the CCD detector (ANDOR Inc.) operating temperature was set at . A syringe pump (BARUN Inc.) was used to allow for delivering the fluidic sample into the microfluidics at a constant flow rate of . Waste materials from the microfluidics were collected in a beaker. An ANDOR software was used to acquire the Raman spectra as well as to control the spectrometer. Microsoft Excel was used to process the acquired spectra. 2.3.Fabrication of SU-8 MicrofluidicsThe procedure employed in the current study for fabricating SU-8 microfluidics was similar to those published previously but with slight modifications.32, 33 Briefly, the SU-8 50 photoresist was first mixed well with the SU-8 thinner (MicroChem) at a ratio of 45:1. The mixture was then centrifuged at for to remove air bubbles. The addition of SU-8 thinner is necessary in order to reduce the viscosity and to aid in uniform spreading of the SU-8 50 photoresist during spinning. To produce a thin SU-8 layer, the prepared mixture was pipetted onto a cleaned coverslip and made to spread out over the glass surface with a pipette tip. The sample was then subjected to spinning at for to produce a SU-8 layer of uniform thickness. Prior to the UV-exposure, the sample was baked for at . Microchannel pattern to be fabricated on the SU-8 layer was printed in black using a laser printer (HP Colourjet) on a transparency, and transferred to the photoresist layer by placing the transparency between a UV-light source and the baked SU-8 layer. Upon UV exposure for , regions outside the shadow of the printed pattern polymerized, while areas defined by the image of the pattern did not and could be dissolved out with the SU-8 developer (MicroChem). The resultant microfluidics is shown in Fig. 2a . Microchannels derived in this manner were in depth and wide as indicated by the profile plot shown in Fig. 2b. The same pattern was used throughout the experiment. Fig. 2(a) SU-8 50 microfluidics, (b) line profile cutting across the microchannel [along the blue line shown in Fig. 2a], showing a channel, and (c) FE-SEM image of the in-channel Au-coated periodic nanostructures. (Color online only.) 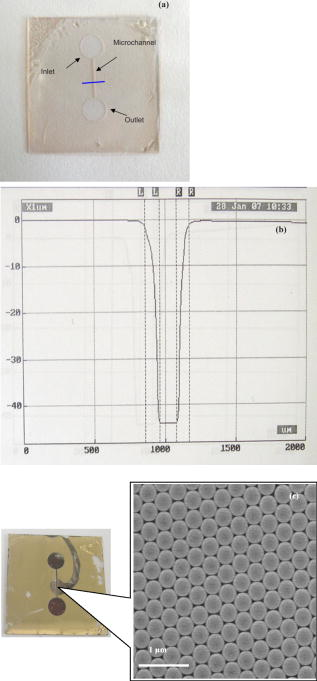 2.4.Deposition of Polystyrene NanospheresA periodic monolayer of carboxylated polystryene nanospheres of in diameter was deposited in the microchannel via the technique of spin-coating. The choice of the particle size was such that the dimension of the final nanostructures would be suitable for SERS at , which was the wavelength of the laser currently used in the experiment. Prior to spin-coating, the stock PNS solution was diluted to 2.5%, after which 0.16% of sodium dodecyl sulfate was added to minimize surface tension. SDS was used to assist uniform spreading of the nanospheres in the channel during spinning. About of the PNS solution was applied onto the microchannel each time. Different spin conditions have been tried, and the resultant distributions of the particles in the channel were examined under a field-emission scanning electron microscope (FE-SEM). It was found that the formation of PNS monolayers was significantly impeded by the 3-D structure of the microchannel, with no close-packed monolayer formed in most cases. Anyhow, an optimal spin condition under which a monolayer of hexagonally packed particles formed was eventually obtained: Spin , spin . 2.5.Development of Metal NanostructuresThe monolayer of polystyrene spheres was overcoated with Au layer by sputtering under a pressure of . The finished product is checked under FE-SEM [see Fig. 2c] and then stored in a dry environment until needed. 2.6.Encapsulation of SU-8 MicrofluidicsPrior to a SERS experiment, the SU-8 microfluidics bearing the SERS-active metal nanostructures was encapsulated, as depicted in Fig. 3a , using a piece of parafilm as the sealer. Two holes matching, in position, the input and output port of the microfluidic pattern were made in the top plastic slab to allow access of liquid into the channel. The encapsulated SERS microfluidics was then placed under the microscope objective as shown in Fig. 3b for SERS measurements. Silicon tubing of diam was used to deliver the sample into and out of the microfluidics. 2.7.Preparation of Au ColloidA Au colloid was synthesized by following procedures described by Grabar .34 Briefly, of hydrogen tetrachloroaurate (III) hydrate powder was added to of distilled water and the mixture was brought to rolling boil on a hot plate with vigorous stirring. After which, of sodium citrate dihydrate powder dissolved in of distilled water was rapidly added to the vortex of the stirring tetrachloroaurate solution. Boiling continued for , during which the solution exhibited several color changes starting with yellowish then purplish and, finally, ruby-red. The final solution was stored in until needed. 3.Results and Discussion3.1.Stability TestAs mentioned above, metal (Au or Ag) colloids were normally used as the Raman-enhancing substrates in the majority of previous SERS microfluidics.15, 20 The colloid can be prepared outside the system or alternatively by pumping metal salt into the system and reducing it in situ.15, 35 Analyte would then be introduced via a different input port and allowed to mix with the colloid inside the system. For a maximum Raman enhancement, aggregating agents were often added to induce agglomeration.36 This unfortunately could bring about such issue as difficulties in maintaining a good control over the aggregation process. As will be shown later, indeed there exists an optimal aggregate size at which a maximum Raman enhancement can be obtained. This is mainly due to the fact that the plasmon peak of an aggregate correlates strongly with its overall size, and only those that can resonate at the excitation laser energy would give rise to strong Raman signals.22 Thus, it is crucial that the state of aggregation of the colloid at the point of signal accumulation be reproducibly controllable.20 This can be achieved by acquiring the Raman signals in a continuous-flow condition with a flow rate precisely adjusted in such a way the agglomerating colloid forms an optimal cluster as it passes through the laser-probe volume.20 Though it has been demonstrated that such an approach increases the analytical precision and improves quantitation, the volume of the required materials substantiates if a long signal accumulation time is needed [e.g., to improve the signal to noise ratio (S/N)]. Additionally, any variation in the salt content of the samples would affect the aggregation process, and the flow rate must be readjusted to maintain a maximum enhancement. This would surely complicate the analysis as the ionic strength of each sample would have to be known a priori—an inconvenient practice especially in a large-scale clinical study. To demonstrate the adverse effect the ionic strength of a sample has on a colloidal-based SERS, a model sample consisting of CV dissolved in Au colloid was used and injected into a microfludic system bearing no SERS nanostructures. The reason for choosing CV as the test analyte is its well-established SERS characteristic.22 About of the solution was used each time and pumped into the system at a constant flow rate of using the BARUN syringe pump. To simulate the effect of ionic strength, sodium chloride (NaCl) was added to the sample. There were five measurements in total, each time with a solution containing a different amount of NaCl. The NaCl concentrations used in the current study were 0, 6.5, 10.3, 34, and . Every sample was prepared immediately before use and introduced into the microchannel within . A new microfluidic device was used each time to avoid cross-contamination. Three spectra were taken under continuous flow with a integration time for each experiment condition. Typical CV SERS spectra are shown in Fig. 4a showing the effect of the NaCl concentrations on the SERS intensities. All spectra were agreeable with those published previously for CV.35 A curve of the average peak intensity at against NaCl concentrations is plotted in Fig. 4b. It can be clearly seen that signal strengths vary by as much as six times over the concentration range considered here. Furthermore, there also exists an optimal concentration for which a maximum enhancement occurs. This corresponds to a specific aggregate size (see insets for transmission electron microscopy (TEM) images of the aggregates) that exhibits a plasmon peak matching the laser wavelength, thereby giving a maximum Raman-enhancing electromagnetic field between aggregated particles. Fig. 4(a) CV SERS spectra taken with different amount of NaCl added to the colloid solution: , , , , and . All spectra are background subtracted. Integration . (b) Plot of the peak intensity at vs different NaCl concentrations. Inset: TEM images of Au aggregates at different NaCl concentrations. 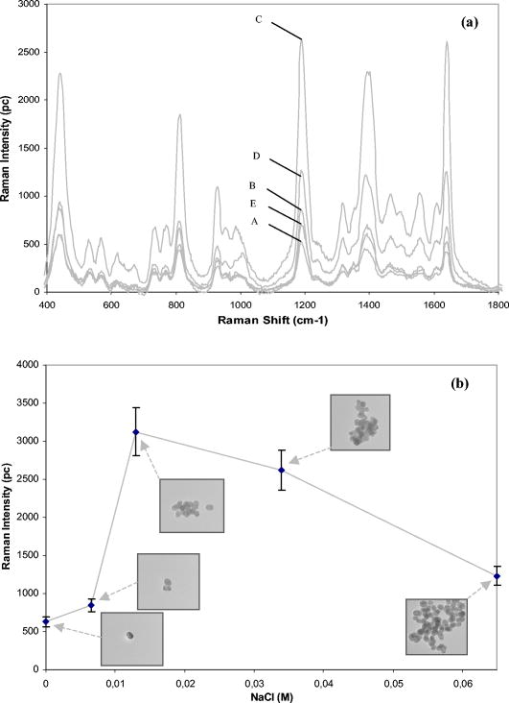 Next, the stability of the in-channel SERS nanostructures toward variations in the sample’s ionic strength was examined. The experiment procedure described above was again used, except that no colloid was mixed in the 1 μM CV solution. Typical SERS spectra obtained with this setup is shown in Fig. 5a and the plot of the average peak intensity in Fig. 5b. As expected, the immobilized nanostructures provide a much better reproducibility with a signal variation of over the entire concentration range compared to 137% in the colloid-based system. Furthermore, the SERS signal derived from the nanostructure bearing microfluidics remains virtually unchanged over a very long period of time . By virtue of triplicate measurements, it was estimated that signals obtained from the nanostructures can be reproduced to within 11% at a given NaCl concentration, in agreement with those previously published for a periodic SERS-active substrate.37, 38 Last, mention should be made about the huge errors seen in a stop-flow microfluidic system as reported previously,20 which is a result of inhomogeneous hot-spot distribution within the solution. The smaller error seen in the current system thus implies a uniform hot-spot distribution within the periodic substrate. 3.2.SERS Study of UrineFor a real-world test, one author donates his urine sample for SERS-microfluidic analysis. The choice of a urinal fluid is twofold. First, a Raman study of urine offers a convenient tool for disease diagnosis.23, 39, 40 For example, detection of urinal creatinine using Raman can provide information about muscular dystrophy, hyperthyroidism, and poliomyelitis.6 Second, the high salt content as well as the large fluctuations in the ionic strength of urine offers a perfect challenge for biofluid analysis using a SERS microfluidics.41 First, a colloid-based system was used. Initially, mixing the urine sample with the Au colloid in a 1:5 ratio results in rapid aggregation and no signal can be obtained. A second trial employing a lower urine-to-Au ratio (1:10) produces a lower aggregation rate, allowing the temporal changes of the urine SERS spectrum to be monitored. Shown in Fig. 6a are urine SERS spectra acquired at different time points over a period of . The S/N of the spectra is somewhat poor due to the dilution of the urine sample. Nonetheless, Raman peaks corresponding to urea , uric acid , Creatinine (690, 730, and ) based on previous study,42 can be identified in the 560- and spectra. At , however, the spectrum diminishes due to the formation of very large aggregates, which have a plasmon peak longer than the laser line. The fact that the signal undergoes a continuous change—peaks at 560s followed by a decay—suggests the instability of the colloid-based system toward the high ionic strength in the urine. Fig. 6(a) Temporal changes in the urine SERS spectra obtained using a colloid-based microfluidics system. Integration for each spectrum. (b) Urine SERS spectrum (upper curve) obtained using microfluidics bearing periodic nanostructures, and unenhanced Raman (lower curve) of the urine sample. Integration time for the urine SERS spectrum is , and for the unenhanced Raman . Note the intensity of the unenhanced Raman spectrum has been reduced by five times from the original data in order to reduce the large background arising from the long integration time used to obtain the spectrum. 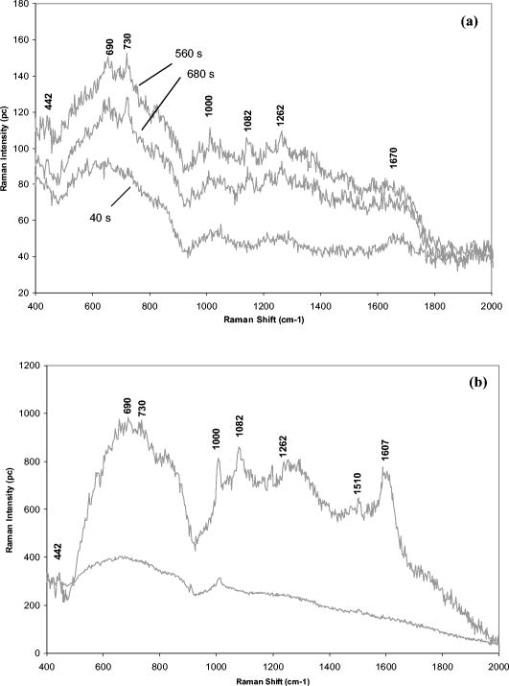 Next, microfluidics bearing the periodic nanostructures was used to study the urine sample. About of urine was loaded into the syringe and injected into the microchannel using the syringe pump at . The SERS spectrum derived from this particular system is shown in Fig. 6b (upper curve). No appreciable signal change was observed over the interval. This suggests the stability and robustness of the nanostructures in urine analysis. Note also the better S/N in comparison to that attainable with the colloid-based system. The Raman peak corresponding to urea is more profound in this case. A prominent peak at is not known previously in urine; thus, band assignment for this particular peak is not possible at this moment. Although one may be tempted to attribute this particular band to the SU-8 polymer, such an assumption might not be true for the following reasons: (i) no such band was observed in the Raman spectrum of the SU-8 photoresist; (ii) the SERS signals were originated mainly from the Au-coated polystyrene spheres layer; and (iii) the laser focal spot was positioned on the Au-coated spheres layer near the center of the microchannel at some distance from the SU-8 channel wall. Further investigation is thus needed with regard to the source of the band. For comparison, an unenhanced Raman spectrum of urine is also shown in Fig. 6b (lower curve). The urine Raman spectrum was obtained from an undiluted urine sample using an integration time of . Note that in comparison to the SERS spectrum, very few peaks are present in the unenhanced spectrum, suggesting the sensitivity of our in-channel SERS nanostructures. Also under development is an in-channel Ag-overcoated PNS nanostructure, which should, in principle, give a better enhancement than the Au counterpart, albeit some work would need to be done to improve the shelflife of Ag-coated microfluidics. 4.ConclusionThe SERS performance of colloid-based microfluidics was compared to that of microfluidics bearing periodic SERS-active nanostructures. The instability of colloid-based SERS toward variations in the ionic strength was clearly demonstrated. All in all, microfluidics with immobilized nanostructures is more stable and may be more apt for the SERS study of urine. AcknowledgmentThe author thanks Prof. Kon Oi Lian for loaning the syringe pump. This project is supported by the BioMedical Research Council (BMRC No. 05/1/31/19/397). The author also thanks the Singapore Millennium Foundation for a postgraduate scholarship. ReferencesJ. W. McMurdy and
A. J. Berger,
“Raman spectroscopy-based creatinine measurement in urine samples from a multipatient population,”
Appl. Spectrosc., 57
(5), 522
–525
(2003). https://doi.org/10.1366/000370203321666533 0003-7028 Google Scholar
D. L. Ross and
A. E. Neely, Textbook of Urinalysis and Body Fluids, 11
–57 Appleton-Century-CroftsPrentice-Hall, New YorkEnglewood cliffs, NJ
(1983). Google Scholar
H. M. Heise,
G. Voigt,
P. Lampen,
L. Kupper,
S. Rudoff, and
G. Werner,
“Multivariate calibration for the determination of analytes in urine using mid-infrared attenuated total reflection spectroscopy,”
Appl. Spectrosc., 55 434
–443
(2001). 0003-7028 Google Scholar
N. A. Brunzel, Fundamentals of Urine and Body Fluid Analysis, 1994). Google Scholar
R. T. Ambrose,
D. F. Ketchum, and
J. W. Smith,
“Creatinine determined by high-performance liquid chromatography,”
Clin. Chem., 29 256
–259
(1983). 0009-9147 Google Scholar
H. Shi,
Y. Ma, and
Y. Ma,
“A simple and fast method to determine and quantify urinary creatinine,”
Anal. Chim. Acta, 312 79
–83
(1995). 0003-2670 Google Scholar
Y. N. Shi,
P. C. Simpson,
J. R. Scherer,
D. Wexler,
C. Skibola,
M. T. Smith, and
R. A. Mathies,
“Radial capillary array electrophoresis microplate and scanner for high-performance nucleic acid analysis,”
Anal. Chem., 71 5354
–5361
(1999). 0003-2700 Google Scholar
D. R. Reyes,
D. Lossitidis,
P. Auroux, and
A. Manz,
“Micro total analysis systems. 1. Introduction, theory, and technology,”
Anal. Chem., 74 2623
–2636
(2002). https://doi.org/10.1021/ac0202435 0003-2700 Google Scholar
P. A. Auroux,
D. Lossifidis,
D. R. Reyes, and
A. Manz,
“Micro total analysis systems. 2. Analytical standard operations and applications,”
Anal. Chem., 74 2637
–2652
(2002). https://doi.org/10.1021/ac020239t 0003-2700 Google Scholar
D. Flgeys and
D. Pinto, Anal. Chem., 72 330A
–335A
(2002). 0003-2700 Google Scholar
D. J. Beebe,
G. A. Mensing, and
G. M. Walker,
“Physics and applications of microfluidics in biology,”
Annu. Rev. Biomed. Eng., 4 261
–286
(2002). https://doi.org/10.1146/annurev.bioeng.4.112601.125916 1523-9829 Google Scholar
T. Thorsen,
S. J. Maerkel, and
S. R. Quake,
“Microfluidic large-scale integration,”
Science, 298 580
–584
(2002). https://doi.org/10.1126/science.1076996 0036-8075 Google Scholar
A. De Mello, Lab Chip, 2 48N
–54N
(2002). 1473-0197 Google Scholar
G. L. L Liu and
L. P. Lee.,
“Nanowell surface enhanced Raman scattering arrays fabricated by soft-lithography for label-free biomolecular detections in integrated microfluidics,”
Appl. Phys. Lett., 87 074101
–074103
(2005). https://doi.org/10.1063/1.2031935 0003-6951 Google Scholar
K. R. Strehie,
D. Cialla,
P. Rosch,
T. Henkel,
M. Kohler, and
J. Popp,
“A reproducible surface-enhanced Raman spectroscopy approach. Online SERS measurements in a segmented microfluidic system,”
Anal. Chem., 79 1542
–1547
(2007). https://doi.org/10.1021/ac0615246 0003-2700 Google Scholar
R. M. Connatser,
L. A. Riddle, and
M. J. Sepaniak,
“Metal-polymer nanocomposites for integrated microfluidic separations and surface enhanced Raman spectroscopic detection,”
J. Sep. Sci., 27 1545
–1550
(2004). 1615-9306 Google Scholar
C. H. Tsai,
M. F. Hung,
C. L. Chang,
L. W. Chen, and
L. M. Fu,
“Optimal configuration of capillary electrophoresis microchip with expansion chamber in separation channel,”
J. Chromatogr. A, 1121 120
–128
(2006). Google Scholar
T. Park,
S. Y. Lee,
G. I. H. Seong,
J. Choo,
E. K. Lee,
Y. S. Kim,
W. H. Ji,
S. Y. Hwang,
D. G. Gweon, and
S. Lee,
“Highly sensitive signal detection of duplex dye-labelled DNA oligonucleotides in a PDMS microfluidic chip: confocal surface enhanced Raman spectroscopic study,”
Lab Chip, 5 437
–442
(2005). 1473-0197 Google Scholar
M. Brivio,
R. H. Fokkens,
W. Verboom,
D. N. Reinhoudt,
N. R. Tas,
M. Goedbloed, and
A. van den Berg,
“Integrated microfluidic system enabling (bio)chemical reactions with on-line MALDI-TOF mass spectrometry,”
Anal. Chem., 174
(16), 3972
–3976
(2002). 0003-2700 Google Scholar
R. Keir,
E. Igata,
M. Arundell,
W. E. Smith,
D. Graham,
C. McHugh, and
J. M. Cooper,
“SERRS. In situ substrate formation and improved detection using microfluidics,”
Anal. Chem., 74 1503
–1508
(2002). 0003-2700 Google Scholar
P. Hildebrandt and
M. Stockburger,
“Surface enhanced resonance Raman spectroscopy of Rhodamine 6G on colloidal silver,”
J. Phys. Chem., 88 5935
–5944
(1984). https://doi.org/10.1021/j150668a038 0022-3654 Google Scholar
K. W. Kho,
Z. X. Shen,
H. C. Zeng,
K. C. Soo, and
M. Olivo,
“Deposition method for preparing SERS-active gold nanoparticle substrates,”
Anal. Chem., 77 7462
–7471
(2005). 0003-2700 Google Scholar
W. R. Premasiri,
R. H. Clarke, and
M. E. Womble,
“Urine analysis by laser Raman spectroscopy,”
Lasers Surg. Med., 28 330
–334
(2001). https://doi.org/10.1002/lsm.1058 0196-8092 Google Scholar
S. Farquharson,
C. Shende,
F. E. Inscore,
P. Maksymiuk, and
A. Gift,
“Vibrational relaxation processes in isotropic molecular liquids: A critical comparison,”
J. Raman Spectrosc., 26 208
–212
(2005). 0377-0486 Google Scholar
A. J. Berger,
T. W. Koo,
I. Itzkan,
G. Horowitz, and
M. S. Field,
“Multicomponent blood analysis by near-infrared Raman spectroscopy,”
Appl. Opt., 38 2916
–2929
(1999). 0003-6935 Google Scholar
T. C. Bakker,
G. J. Schut Puppels,
Y. M. Kraan,
J. Greve,
L. L. van der Maas, and
C. G. Figdor,
“Intercellular carotenoid levels measured by Raman microspectroscopy: Comparison of lymphocytes from lung cancer patients and healthy individuals,”
Int. J. Cancer, 74 20
–25
(1997). 0020-7136 Google Scholar
K. H. Yea,
S. Lee,
J. B. Kyong,
J. Choo,
E. K. Lee,
S. W. Joo, and
S. Lee,
“Ultra-sensitive trace analysis of cyanide water pollutant in a PDMS microfluidic channel using surface-enhanced Raman spectroscopy,”
Analyst (Cambridge, U.K.), 130 1009
–1011
(2005). 0003-2654 Google Scholar
S. A. Leung,
R. F. Winkle,
R. C. R. Wootton, and
A. J. deMello,
“A method for rapid reaction optimisation in continuous-flow microfluidic reactors using online Raman spectroscopic detection,”
Analyst (Cambridge, U.K.), 130 46
–51
(2005). 0003-2654 Google Scholar
L. G. Olson,
Y. S. La,
T. P. Beebe, and
J. M. Harris,
“Characterization of silane-modified immobilized gold colloids as a substrate for surface-enhanced Raman spectroscopy,”
Anal. Chem., 73 4268
–4276
(2001). https://doi.org/10.1021/ac000873b 0003-2700 Google Scholar
M. Campbell,
S. Lecomite, and
W. E. Smith,
“Effect of different mechanisms of surface binding of dyes on the surface-enhanced resonance Raman scattering obtained from aggregated colloid,”
J. Raman Spectrosc., 30 37
–44
(1999). 0377-0486 Google Scholar
S. Sanchez-cortes,
J. V. Garciaramos,
G. Morcilllo, and
A. Tintl,
“Morphological study of silver colloids employed in surface-enhanced Raman spectroscopy: Activation when exciting in visible and near-infrared regions,”
J. Colloid Interface Sci., 175 358
–368
(1995). 0021-9797 Google Scholar
C.-H. Lin,
G.-B. Lee,
B. W. Chang, and
G. L. Chang,
“A new fabrication process for ultra-thick microfluidic microstructures utilizing SU-8 photoresist,”
J. Micromech. Microeng., 12 590
–597
(2002). 0960-1317 Google Scholar
J. Zhang,
K. L. Tan, and
H. Q. Gong,
“Characterization of the polymerization of SU-8 photoresist and its applications in micro-electro-mechanical systems (MEMS),”
Polym. Test., 20 693
–701
(2001). https://doi.org/10.1016/S0142-9418(01)00005-8 0142-9418 Google Scholar
K. C. Grabar,
R. G. Freeman,
M. B. Hommer, and
M. J. Natan,
“Preparation and Characterization of Au colloid monolayers,”
Anal. Chem., 67 735
–743
(1995). https://doi.org/10.1021/ac00100a008 0003-2700 Google Scholar
G. T. Taylor,
S. K Sharma, and
K. Mohanan,
“Optimization of a flow injection sampling system for quantitative analysis of dilute aqueous solutions using combined resonance and surface-enhanced Raman spectroscopy (SERRS),”
Appl. Spectrosc., 44 635
–640
(1990). 0003-7028 Google Scholar
J. C. Jones,
C. Mclaughlin,
D. LittleJohn,
D. A. Sadler,
D. Graham, and
W. E. Smith,
“Quantitative assessment of surface-enhanced resonance Raman scattering for the analysis of dyes on colloidal silver,”
Anal. Chem., 71 596
–601
(1999). 0003-2700 Google Scholar
L. A. Dick,
A. D. McFarland,
C. L. Haynes, and
R. P. Van Duyne,
“Metal film over nanosphere (MFON) electrodes for surface-enhanced Raman spectroscopy (SERS): Improvements in surface nanostructure stability and suppression of irreversible loss,”
J. Phys. Chem. B, 106 853
–860
(2002). https://doi.org/10.1021/jp013638l 1089-5647 Google Scholar
M. Litorja,
C. L. Haynes,
A. J. Haes,
T. R. Jensen, and
R. P. Van Duyne,
“Surface-enhanced Raman scattering detected temperature programmed desorption: Optical properties, nanostructure, and stability of silver film over nanosphere surfaces,”
J. Phys. Chem. B, 105 6907
–6915
(2001). https://doi.org/10.1021/jp010333y 1089-5647 Google Scholar
C. Park,
K. Kim,
J. M. Choi, and
K. S. Park,
“Classification of glucose concentration in diluted urine using the low-resolution Raman spectroscopy and kernel optimization methods,”
Physiol. Meas, 28 583
–593
(2007). 0967-3334 Google Scholar
D. Qi and
A. J. Berger,
“Quantitative concentration measurements of creatinine dissolved in water and urine using Raman spectroscopy and a liquid core optical fiber,”
J. Biomed. Opt., 10
(3), 031115
(2005). https://doi.org/10.1117/1.1917842 1083-3668 Google Scholar
C. Ricos,
C. V. Jimenez,
A. Hernandez,
M. Simon,
C. Perich,
V. Alvarez,
J. Minchineia, and
M. Macia,
“Biological variation in urine samples used for analyte measurements,”
Clin. Chem., 40
(3), 472
–477
(1994). 0009-9147 Google Scholar
R. Keuleers,
H. O. Desseyn,
B. Rousseau, and
C. V. Alsenoy,
“Vibrational analysis of urea,”
J. Phys. Chem., 103 4621
–4630
(1999). 0022-3654 Google Scholar
|

