
|
|
1.IntroductionOsteoarthritis (OA) affects millions of people and is one of the most frequent causes of physical disability of adults, making it a subject of extreme interest.1 The extracellular matrix of articular cartilage consists mainly of collagen fibrils and proteoglycans bathed in water. The architectural organization of the collagen fibrils has distinct differences in orientation at different tissue depths, which are commonly referred to as histological zones (superficial or tangential, middle or transitional, and deep or radial). The differences in the fibril orientation across the thickness of the tissue are the cause of the birefrigent phenomenon in cartilage, and have been verified quantitatively by polarized light microscopy experiments.2, 3, 4 Loss of proteoglycans and the breakdown of the collagen network in articular cartilage are typical of the degenerative processes that lead to OA. Consequently, the change in tissue birefringence due to disorganization of the collagen fibrils has been considered evidence of early OA.2 In recent years, a minimally invasive imaging technique, optical coherence tomography (OCT), that uses interference patterns of backscattered light to image tissue5, 6 has been used to image articular cartilage to depths of with resolutions on the order of . OCT has been used to measure articular cartilage thickness in the rabbit,7 assess articular cartilage repair following chondrocyte implantation,8 and to characterize and differentiate cartilage from normal and degenerative joint surfaces. 9, 10, 11, 12, 13, 14, 15, 16 These studies have shown the ability of OCT to demonstrate structural alterations of the articular cartilage matrix, including early ulcerations and delaminations of the superficial zone, detection and characterization of clefts, and alternations at the cartilage-bone interface. Polarization-sensitive optical coherence tomography (PS-OCT) is a form of OCT imaging that can reveal important information about tissue birefringence by detecting polarization changes in light reflected back from tissue.17, 18, 19 Several PS-OCT system configurations have been described and reviewed.19, 20, 21 A fiber-based PS-OCT configuration that uses several different polarization states of incident light to obtain a series of depth-resolved Stokes parameter images that can be integrated to generate a quantitative depth-resolved optical phase retardation image that is characteristic of the birefringence of the tissue along the axis of the imaging beam was used in this study and other studies of articular cartilage reported by us.16, 22 Tissue that demonstrates optical phase retardation in PS-OCT images is described as polarization sensitive. PS-OCT has been used to study the microstructure and birefringence properties of a variety of biological tissues, 23, 24, 25, 26, 27, 28, 29, 30, 31 including articular cartilage and intervertebral disk16, 22, 32, 33 and has been demonstrated to be a potentially valuable diagnostic tool for the assessment of collagen matrix changes in joint disease. In particular, a variation of this imaging technique that uses polarized light through a single channel OCT imaging device without quantification of optical phase retardation has been used to differentiate osteoarthritic cartilage from normal cartilage by detecting changes in phase retardation (banding) patterns in OCT images that are attributed to alterations in tissue birefringence.9, 10, 14 Some recent studies that have used a quantitative PS-OCT system to image articular cartilage seem to be in conflict with the studies that have reported phase retardation (banding) patterns in OCT images of specimens classified as being normal and the absence of phase retardation (banding) patterns in specimens classified as manifesting degeneration. In our laboratory we have demonstrated that otherwise normal articular cartilage shows little or no phase retardation along the vertical axis,16 and that both matrix compression and fibrocartilage replacement can demonstrate increased optical phase retardation.16 Additionally, PS-OCT has demonstrated that the optical phase retardation of normal articular cartilage along the vertical axis is much different than the phase retardation determined with the imaging beam directed along the horizontal axis, and that PS-OCT cannot be used to differentiate osteoarthritic cartilage from healthy cartilage without careful consideration of the complex relationship of the orientation of the incident angle of the imaging beam to the sample.19, 33 It is known that the optical phase retardation as determined by PS-OCT is influenced by the orientation of the axis of the imaging beam to the optical axis of the tissue,18 as well as by the organization and integrity of the collagen matrix.23, 28, 31 It is also known that the orientation of the collagen fibrils in articular cartilage may vary topographically over a joint surface, especially near the edge of a joint and in immature joints.3, 34 Other variations within a joint may include the thickness of the histological zones as well as the total thickness of the tissue, the content of major molecular components, the organization of the collagen fibrils, the mechanical properties of the tissue, and asymmetry in several physical and optical properties between the lateral half and the medial half of the joint.3, 34 We hypothesize that the optical phase retardation patterns in PS-OCT images of articular cartilage also will vary at different locations within a normal joint where the organization of collagen fibrils present at different angles of orientation to the imaging beam. This would present difficulties to the assessment of cartilage health if not clearly understood. To test our hypothesis, we incorporated polarized light microscopy (PLM) in the design of our PS-OCT studies. PS-OCT imaging was carried out at multiple locations on fresh intact bovine tibias. The tissue from these sites was then harvested, sectioned in vertical planes, and analyzed by PLM to quantify the orientation of collagen fibrils. The depth-resolved optical phase retardation at each site as quantitatively determined from changes in Stokes vectors by PS-OCT imaging was compared to the images of the collagen matrix orientation and organization obtained by PLM to determine the influence of normal topographical variations of the fibril orientation on the optical phase retardation patterns of PS-OCT images. 2.Materials and Methods2.1.Polarization-Sensitive Optical Coherence TomographyThe single-mode fiber-based PS-OCT system used in this study has been described and diagramed previously.16, 22 It uses unpolarized low coherence light from a superluminescent diode (SLD) source (AFC, Toronto, Canada) with an output power of , and a central wavelength of with a full-width-half-maximum (FWHM) spectral bandwidth of . The source light is coupled into a fiber optic nonpolarizing coupler that splits the light into reference and sample arms. The axial resolution is for this system, as determined by the coherence length of the light source . The lateral resolution of the system is approximately , as defined by the diameter of the scanning light beam. In the reference arm, a four-step driving function is applied to the polarization modulator (Newport Company, Irvine, California), and each step introduces a phase shift in the reference beam. Backscattered light from the sample is combined with the light of each of the four corresponding polarization states reflected from the reference arm. In the detector arm, the interfered beams are split into their horizontal and vertical components by a polarization beamsplitter and detected by two photodetectors (Laser Components, Incorporated, Santa Rosa, California), then high-pass filtered, amplified, digitalized, and further processed by a computer. The phase retardation is calculated from the Stokes vectors for the two polarization states obtained from the complex signals of the two orthogonal channels by comparing the Stokes vectors at the surface to those from deeper axial positions.16, 22 A single PS-OCT scan is obtained and the Stokes vector images displayed in , and an optical phase retardation image is displayed within another . 2.2.Quantitative Polarizatized Light MicroscopyThe quantitative PLM system has a thermoelectrically cooled charge-coupled device (CCD) camera (Photometrics, Tucson, Arizona) mounted on a Leica DM RXP polarized light microscope (Leica Microsystems, Wetzlar, Germany). Monochromatic light with a wavelength of is used for the illumination of the specimens. The output of the CCD camera is digitized and sent to a personal computer for analysis. Image acquisition and analysis are performed using commercial software (IPlab, Scanalytics, Fairfax, Virginia). Our PLM protocol uses circular polarized light and a liquid crystal compensator, which allows the calculation of images representing the optical retardance and the angular orientation of the fibers in the tissue on a pixel-by-pixel basis. At magnification, the pixel resolution in our PLM measurements is . Compared to PS-OCT that is used in a reflection mode on intact tissues, PLM is performed in a transmission mode to study histological sections of tissue with a thickness of . When the axis of the PS-OCT imaging beam is normal to the tissue surface, the A-scans of the PS-OCT image produce a depth profile of the tissue that can be correlated with the depth profiles of the PLM images using a vertically cut thin section in the transmitted mode.3 2.3.Specimen Collection and ImagingFresh bovine articular cartilage specimens were collected from the rear legs of adult ( old) Holstein dairy cows slaughtered within the prior . Femoral-tibial joints were isolated and dissected to expose the tibial plateau. Each prepared joint was wrapped in 0.9% saline-soaked gauze sponges until it was imaged under the PS-OCT system on the same day. The whole proximal tibia was positioned on a microstage, and marked areas of the tibial plateau were scanned with the focus beam guided by a superimposed aiming beam directed from the sample arm of the system. The microstage can be adjusted in three dimensions, and the angle of the stage was adjusted so that the axis of the scanning beam scanned by the normal to the surface of the marked area. After PS-OCT imaging, full thickness cartilage samples that included subchondral bone were obtained from the marked areas of the articular surface, which included subchondral bone of the proximal tibia by cutting with a saw on either side of the image path and extracting with an osteotome and mallet, or were obtained by use of a -diam round metal punch and mallet. Following collection, a few tissue specimens were again imaged by PS-OCT with the imaging beam directed horizontally ( to the articular surface) and scanned along a vertical line from the articular surface to the subchondal bone. All harvested specimens were fixed in 10% buffered formalin. Following tissue fixation, each specimen was decalcified by the formic acid-sodium citrate method33 with the solution changed daily for a period of until decalcification was complete, as evidenced by radiographs of each specimen. The samples were then embedded in paraffin, cut in vertical planes in -thick serial sections, and mounted on glass slides, as shown in Fig. 1 . Some vertical sections were stained by hematoxylin (Sigma-Aldrich, Saint Louis, Missouri) and eosin-y (EM Sciences, Port Washington, Pensylvania) (H and E); a few vertical sections were stained by safranin-O and counter-stained with Fast Green FCF (Sigma-Aldrich, Saint Louis, Missouri) (SOFG); and the remaining unstained, mounted sections of each specimen were saved for evaluation by PLM. The stained sections were used to evaluate the specimen for evidence of matrix degeneration and proteoglycan content, and only specimens judged as being normal were used in the study. Fig. 1Experimental design for the comparison of PS-OCT images to PLM evaluation of tissue sections. The PS-OCT experiments were carried out on the intact joint at the selected locations with the beam directed to the articular surface and scanned along a line. Following harvest from the joint, the tissue at the PS-OCT imaging location was processed, serially sectioned in vertical planes cut parallel to the line of scan, and mounted. Sections were either stained with H and E, SFOG, or left unstained. Stained sections were evaluated for evidence of degenerative changes, and unstained sections were used for the PLM studies. 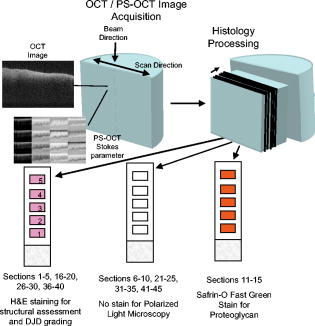 The unstained vertical sections of the selected specimens were used for evaluation of matrix orientation and tissue birefringence by PLM. Each PLM imaging experiment produced two 2-D images: one was a retardation map and the other an angle map. The retardation image illustrates the fibril organization within each pixel based on birefringence (0 means the fibers are random and a higher number means a higher order of organization). The angle image represents the pixel-averaged orientation of the collagen fibers in the tissue. We normally use the false color (blue to red) to represent the angle variation. The results are presented both as 2-D images and 1-D cross sectional profiles through the depth of the cartilage tissue. To enhance the signal-to-noise ratio of the 1-D profiles, 20 parallel neighboring columns of data from a rectangular region of interest in the 2-D images are averaged to obtain the 1-D cross sectional profiles. A 1-D profile PLM dataset was acquired on the right side, and the left side of a tissue section selected for each specimen and measurements was made from surface to base at each site. 3.ResultsIn this study a total of 59 locations on nine tibias were imaged by OCT and PS-OCT. Of these specimens, 30 were judged by histological evaluation as not demonstrating degenerative changes, of which 14 had not shown optical phase retardation and 16 had shown the banding pattern typical of optical phase retardation in PS-OCT images. Based on section quality and matching of specimen surface contour of tissue sections to OCT image surface contour to insure comparison of images of the same location, sections from three specimens demonstrating no PS-OCT banding and six specimens demonstrating PS-OCT banding were selected for PLM study. Unstained vertical sections of selected specimens were imaged by PLM to evaluate the orientation and organization of the collagen matrix. In total, we acquired 88 PLM images from vertical sections of nine specimens. 3.1.Topographical Optical Coherence Tomography and Polarization-Sensitive Optical Coherence Tomograpy ImagesFigure 2 shows the OCT images obtained from different sites, as indicated on one proximal tibial joint surface. Figure 3 shows the PS-OCT phase retardation images of the same sites shown in Fig. 2. The PS-OCT system uses a two-channel polarization detector and a cosine function algorithm to calculate the phase change of the incident light at specific depths from the tissue surface. The algorithm determines the accumulated phase change within intervals, so each interval of phase change is observed as a band in the accumulated phase retardation image. Multiple bands appearing within a specific region in a depth-resolved phase retardation image is an indication of strong phase retardation by the tissue of that region. Variations in the number and widths of banding observed in phase retardation images reveal differences in the polarization sensitivity within or between tissue specimens. Fig. 3PS-OCT optical phase retardation images at the same sites on the same bovine tibia as shown in Fig. 2. The bright vertical streaks in the phase retardation images are artifacts that result from either weak signal or detector saturation by signal reflection from the surface of the specimen. 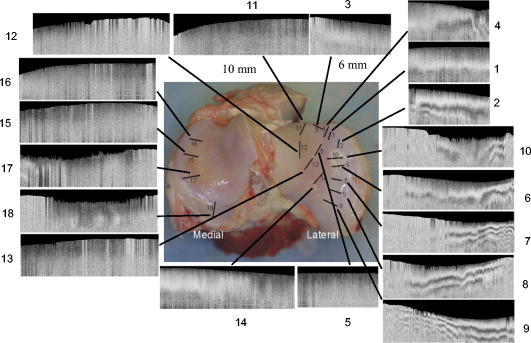 Clearly, the optical phase retardation images display strong banding patterns on the lateral side of the joint (specimens 2, 4, and 6 through 10). In contrast, the tissues on the central load-bearing area and the medial aspect of the joint demonstrate little banding in the optical phase retardation images (specimens 3, 5, and 11 through 18). Artifacts seen as vertical white streaks are observed in the phase retardation images of Fig. 3. These artifacts result from either weak signal or saturation of the detector by reflection from the specimen surface. The depth-resolved cumulative phase retardation of a specimen is calculated using the phase determined at the surface as the reference against which the phase change at any depth directly below that surface point is calculated. When the signal from the surface is either weak or saturated, the phase calculation for the surface gives a bias value for the reference, resulting in an artifact in the phase retardation image in the region directly below that surface point. 3.2.Specimens Not Polarization-Sensitive Optical Coherence Tomography Polarization SensitiveFigure 4 shows the images of a specimen from the central area of the lateral tibial condyle and is typical of each of the specimens that did not demonstrate polarization sensitivity. The H and E and SOFG stained histological sections of the specimen confirm that the tissue demonstrates no evidence of degenerative change [Figs. 4d and 4e]. The PS-OCT phase retardation image [Fig. 4c] shows no banding, and the accumulated optical phase retardation plot determined from PS-OCT data [Fig. 4f] reveals only mild phase retardation of light reflected back from within the specimen ( phase change in depth). Fig. 4Images of a specimen of normal articular cartilage demonstrating minimal polarization sensitivity on PS-OCT imaging. (a) An OCT image, (b) the individual Stokes parameter images obtained by PS-OCT, (c) the PS-OCT phase retardation image constructed from the Stokes vector data, (d) H and E stained tissue section, (e) SOFG stained tissue section, and (f) a 1-D accumulated optical phase retardation depth profile (degrees of phase retardation versus tissue depth) determined from PS-OCT data.  The tissue sections of this specimen were analyzed by PLM and the results are presented in Fig. 5 as the 2-D images of phase retardation [Fig. 5a] and fibril angle [Fig. 5b]. Along the horizontal axis, the 2-D retardation image [Fig. 5a] shows low birefringence within the first of tissue and a strong birefringence through the entire deep zone. In the 2-D angle image [Fig. 5b] and 1-D angle profile [Fig. 5c], the false colors of blue for the surface region and red for the deep tissue represent a angle difference between the collagen fibril orientations at the superficial zone and the deep zone, suggesting that this tissue has the classical three-zone fibril orientation across its depth. These results agree well with the histology and OCT/PS-OCT results in Fig. 4. Fig. 5(a) PLM retardation image, (b) angle image, and (c) 1-D cross sectional angle profile of the cartilage specimen shown in Fig. 4. The PLM images [(a) and (b)] are rotated counterclockwise to facilitate comparison with the plotted angle profile (c), and have the articular surface located on the left and the subchondral bone on the right . (b) The blue region at the articular surface demonstrates the region where the collagen fibril orientation is aligned parallel to the articular surface, and corresponds to the region within of the surface (c) as plotted on the angle profile. (b) The red area in the angle image and (c) the plotted angle profile demonstrate that most of the collagen fibrils in this specimen are aligned perpendicular to the articular surface. (Color online only.)  3.3.Polarization-Sensitive Optical Coherence Tomography Polarization-Sensitive SpecimensThe results of a specimen from the lateral region of the tibial plateau are shown in Fig. 6 , and are typical of all of the specimens that demonstrated polarization sensitivity in PS-OCT images. The histology images show that the specimen has no evidence of degenerative change. The PS-OCT phase retardation image of the specimen (Fig. 7 ), however, contains banding, demonstrating that this cartilage specimen is polarization sensitive along the vertical axis. The optical phase retardation is stronger in the region on the right side [Figs. 7a and 7c] than in the region on the left side of this specimen [Figs. 7a and 7b]. Fig. 6Images of a specimen of normal articular cartilage demonstrating polarization sensitivity on PS-OCT imaging. (a) An OCT image, (c) the individual Stokes parameter images obtained by PS-OCT, (b) H and E stained tissue section, and (d) a SOFG stained tissue section. The optical phase retardation image and 1-D accumulated optical phase retardation depth profiles of this specimen are illustrated in Fig. 7.  Fig. 7Images of the specimen of articular cartilage demonstrating polarization sensitivity on PS-OCT imaging presented in Fig. 6. (a) The phase retardation image and (b) 1-D accumulated optical phase retardation depth profiles from the left side of specimen and (c) the right side of the specimen are presented. The specimen demonstrates much more optical phase retardation than is observed in the normal tissue specimen presented in Fig. 4, and this is greater on the right side than on the left side of the specimen. 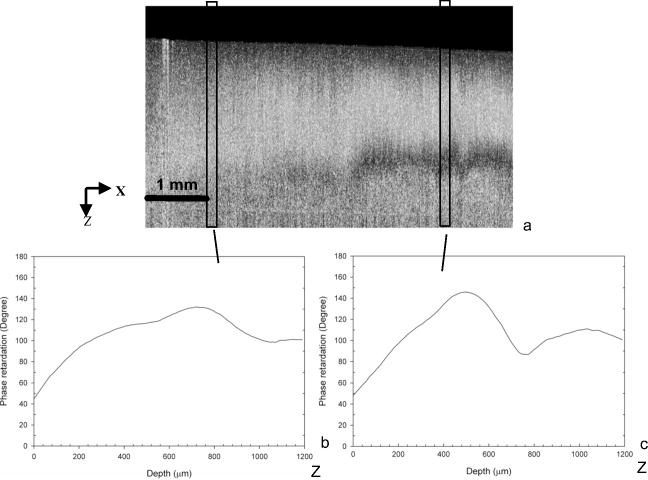 In comparison to the of phase shift within a tissue depth in the normal articular cartilage pictured in Fig. 4f, the specimen depicted in Figs. 6 and 7 has at least phase shift on the left [Fig. 7b] and phase shift on the right [Fig. 7c] within the same depth from the surface. As the phase rotation approaches 0 or , the signal from one detector of the two-channel detector system decreases to zero, and this can be masked by electronic noise in the detector. When this occurs, the 2-D accumulated phase retardation depth profile never fully reaches 0 or , as noted in Figs. 7b and 7c. The PLM 2-D angle images and 1-D cross sectional angle profiles of the left and right sides of the specimen in Fig. 6 are shown in Fig. 8 , and demonstrate that this specimen is composed of three layers of collagen fibrils orientated in alternating directions relative to the surface. The collagen fibril orientation changes from parallel to, then perpendicular to, then parallel to the surface, as shown in Figs. 8b, 8d, 8e. The total depth represented by horizontally directed bands of fibrils approximates on the right and on the left, corresponding to the greater degree of optical phase retardation observed on the right side of the specimen as compared to the left. The PLM retardation image in Figs. 8a and 8c demonstrates that the birefringence of this tissue section along the horizontal axis is very small, which means that the slow component of the optical axis of the tissue is close to or on the light incident direction of the trans-illumination, and is thereby perpendicular to the vertical axis of the PS-OCT imaging beam. Fig. 8The 2-D PLM retardation images (a) and (c) and angle images (b) and (d) obtained from the left and right sides of the section of the articular cartilage specimen shown in Fig. 7. The alternating blue and red regions on the angle image indicate alternating regions where the collagen fibrils run parallel to the articular surface (blue) or perpendicular to the surface (red). The angle of collagen fibril orientation through the depth of the specimen on the right and left aspects of the specimen is plotted (e). The angle images (b) and (d) and the sectioned angle profile (e) demonstrate the presence of alternating bands of horizontally orientated collagen fibrils in this specimen. The vertical thickness of the bands of horizontally orientated fibrils corresponds to the presence and differences in magnitude of the phase retardation on the left and right sides of the optical phase retardation image presented in Fig. 7. (Color online only.)  PS-OCT phase retardation images made with the imaging beam directed horizontally ( to the surface) and scanned along the lateral cut surface of the specimen in a vertical line from the articular surface toward the base of the specimen were compared to the PLM images of the same specimen. Figure 9 shows the horizontally directed PS-OCT phase retardation images of the specimen shown in Figs. 4 and 5, and the specimens of Figs. 6, 7, 8. Comparison of Fig. 9a to Fig. 5a shows strong optical phase retardation (multiple bands) along the horizontal axis, which is consistent with the PLM image of strong phase retardation. A similar comparison of Fig. 9b to Figs. 8a and 8c reveals little to no phase retardation along the horizontal axis of this specimen, which is a consistent observation in both the horizontal PS-OCT and the PLM images. A comparison of the optical phase retardation patterns demonstrated by both PS-OCT and PLM, with the imaging beam of each directed along the same axis in the same specimens, demonstrates a similar assessment of tissue birefringence for each specimen. Fig. 9Depth-resolved phase retardation profiles of specimens imaged by PS-OCT with the imaging beam directed onto the lateral cut edge of the specimen on a horizontal axis relative to the articular surface, and scanned along a line extending from the surface toward the base of the specimen. The specimen surface is on the left of each image, and the subchondral bone is to the right of each image. The grayscale represents the degree of phase change as detected through the depth of tissue imaged. (a) Image was obtained from the specimen shown in Figs. 4 and 5 and demonstrates strong optical phase retardation (multiple bands). (b) Image was obtained from the specimen shown in Figs. 6, 7, 8, and demonstrates very little optical phase retardation. These images demonstrate that the optical phase retardation demonstrated along the horizontal optical axis of the tissue by PS-OCT imaging is consistent with the phase retardation images of each specimen as viewed along the same optical axis by PLM [Fig. 5a and Figs. 8a and 8c]. 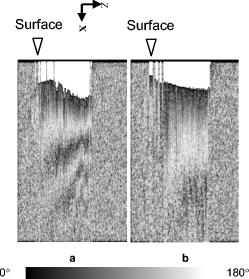 4.DiscussionHighly organized collagen fibers in a tissue matrix impart birefringence to the tissue that is isotropic to light traveling parallel to the fiber orientation and anisotropic to light directed across the fibers. While the birefringence of a tissue specimen is constant, the degree of phase retardation that it conveys to a beam of polarized light can be variable, and depends on the angle of incidence of the beam in relation to the orientation to the collagen fibers and thus to the optical axis of the tissue. The variable influence on phase retardation as detected by PS-OCT that results from varying the angle of incidence of the imaging beam to the orientation of the fibrils of the collagen matrix of articlar cartilage has been demonstrated by us.22 Similarly, where the imaging beam remains constant in its orientation to a tissue (such as perpendicular to an articular surface) but there is normal variation in the orientation of the fibrils within the collagen matrix in different regions of that tissue, different degrees of optical phase retardation should be observed for what is otherwise normal tissue. If the detection of phase retardation by PS-OCT is to be used as a tool to assess health or disease of a tissue, understanding the presence, location, and influence of normal variations in the orientation of the tissue’s optical axis is critical to being able to evaluate the use of PS-OCT as a diagnostic tool. In this study it was found that the polarization sensitivity of articular cartilage, as demonstrated by PS-OCT imaging, revealed different degrees of optical phase retardation in different locations of the same joint (Figs. 1 and 2), and that these differences were consistent for similar locations in each of the joint surfaces imaged. The articular cartilage was found to be polarization sensitive (optical phase retardation present) on the lateral margin of the lateral tibial condyle. The central portions of both tibial condyles and along the outside margin of the medial condyle were not polarization sensitive (minimal to no optical phase retardation present). Because these variations in apparent tissue birefringence could be related to either differences in the health status of the cartilage or variations in normal matrix orientation at different locations within a joint, specimens of tissue were harvested from the image sites and evaluated by both standard histology methods and PLM. It was found that tissue specimens demonstrating no evidence of degenerative change were present in both the regions that were and were not polarization sensitive. Similarly, both the presence and absence of polarization sensitivity was observed in PS-OCT images of specimens judged by histology to be normal, as well as in specimens manifesting early degenerative changes of the matrix. Clearly, the differences in polarization sensitivity demonstrated by PS-OCT imaging in these specimens are location specific and consistent between each of the tibias examined. Articular cartilage is an anisotropic material that exhibits different properties, depending on the directional axis in which it is observed. To visualize such depth-dependent anisotropy in cartilage, imaging at high resolution is a necessity. It has been shown that PLM is a powerful tool for the quantitative evaluation of the collagen ultrastructure of tissue sections,3, 4 while PS-OCT is capable of quantifying the accumulated optical phase retardation through a much greater depth of intact tissue.19 Although several technical factors prevent a quantitative comparison of the data measured by both techniques, as demonstrated by Figs. 5, 8, 9, PLM and PS-OCT provide a similar assessment of tissue birefringence when applied along the same optical axis. In this work, both PLM and PS-OCT have been used to describe the collagen ultrastructure and optical properties of articular cartilage. Although we can quantify optical phase retardation profiles from both PLM and PS-OCT, as generally applied, these technologies describe birefringent properties along two independent and different axes. PLM was used in this study to establish the orientation of the collagen fibrils of the cartilage matrix of each specimen examined. The matrix orientation in relation to the incident PS-OCT imaging beam was determined, and this was compared to the optical phase retardation of back-scattered light, as had been measured from the intact specimen by PS-OCT. It was found that in articular cartilage where no histological evidence of matrix degeneration could be observed, the optical phase retardation detected by PS-OCT increased only mildly with depth along the vertical axis where the collagen fibrils are mostly to the articular surface, and thus parallel to the incident PS-OCT imaging beam (Figs. 4 and 5). It was also found that the optical phase retardation detected by PS-OCT was greatly increased where there were variations in the organization and orientation of the normal collagen matrix that presented collagen fibrils tangent to the axis of the imaging beam (Figs. 6, 7, 8). These observations support our hypothesis that polarization sensitivity of articular cartilage as evidenced by optical phase retardation (banding) patterns of PS-OCT imaging varies within a normal joint where the collagen fibrils are presented at different orientations to the PS-OCT imaging beam. As demonstrated by this study using articular cartilage of the tibial plateau, and as previously reported for other joints,3, 34 the collagen matrix in some regions of the periphery of a joint may demonstrate normal variations in matrix organization and orientation from the classical model of articular cartilage. This study further demonstrates that PS-OCT imaging is sensitive and can demonstrate differences in the optical phase retardation properties of articular cartilage associated with these normal variations in the collagen fibril orientation and organization. This is consistent with our previous studies that demonstrated differences in optical phase retardation patterns in PS-OCT images when the incident angle of the imaging beam was directed at different angles to the surface of specimens of normal articular cartilage, and thus at different angles to the collagen fibril orientation.22 It is of interest that there appears to be little to no influence of the superficial zone on the phase retardation measured by PS-OCT. While there is evidence that the superficial zone can manifest birefringence observed in PLM as phase retardation on the horizontal axis,2, 3, 4 we are not aware of any demonstration of, or comparison to, phase retardation of the superficial zone when measured along the vertical axis. While intuitively it might be reasonable to presume that phase retardation of the superficial zone would be similar along both the horizontal and vertical axes, it should be remembered that the collagen fibrils of the superficial zone lay in stacked lamellar planes as viewed along the horizontal axis, but when viewed along the vertical axis, the fibrils of individual and successively stacked lamella lay over each other and at angles of up to to each other.35, 36 This suggests that the optical properties of the superficial zone may not be the same along both axes. As none of the studies conducted by us have used articular cartilage specimens from young animal subjects, we cannot say whether or not bovine articular cartilage at an early stage of life does or does not manifest stronger birefringence in the superficial zone that might be detected by PS-OCT imaging and lost prior to the onset of classically described histological evidence of degenerative joint disease, as suggested by others.7, 8 If such birefringence properties were present in the superficial zone of young animals, and were manifest along the vertical axis, its influence on phase retardation in PS-OCT imaging should only occur within the first distance from the surface. We do know from our previous studies that articular cartilage pathology resulting in reorientation of the cartilage matrix by compression or replacement by fibrocartilage can result in increased optical phase retardation (banding) demonstrated in PS-OCT images.16 Similarly, we have demonstrated that the orientation of the incident imaging beam relative to the normal matrix may influence the presence or degree of phase retardation (banding) detected in PS-OCT images.22 In this study we have demonstrated that normal variations in the orientation and organization of the collagen fibrils in the matrix of normal articular cartilage will also influence the manifestation of optical phase retardation (banding) observed in PS-OCT images and determined from Stokes vector changes. 5.ConclusionThis study clearly demonstrates that normal variations in the orientation of the collagen matrix within a joint will manifest as different degrees of polarization sensitivity when imaged by PS-OCT. The presence or absence of optical phase retardation (banding) in PS-OCT images of articular cartilage cannot be relied on solely to determine the health or degenerative status of articular cartilage, as might be suggested by some work reported in the literature.9, 10, 14 Furthermore, this study indicates the importance of PS-OCT mapping of the normal articular cartilage optical phase retardation profile of specific joints prior to attempting to use PS-OCT as a diagnostic tool for assessing joint disease. AcknowledgmentsWe acknowledge the assistance of Paula Sweet, Hongrui Li, and Sharon Evander in acquisition of specimens and histological processing, Jun Zhang in calculation of phase retardation profiles, and Eric Viges and Aruna Bidthanapally in PLM imaging. This work was supported by the U.S. Air Force Office of Scientific Research, Medical Free-Electron Laser Program (FA9550-04-1-0101), the National Center for Research Resources of the National Institutes of Health (Laser Microbeam and Medical Program, RR-01192), the National Institutes of Health (NIH) (EB-00293, CA-91717), and the Arnold and Mabel Beckman Foundation. Xia is grateful for the support of NIH (R01 AR-45172) and NSF (REU DMR-0552779). The U.S. Government is authorized to reproduce and distribute reprints for Governmental purposes notwithstanding any copyright notation. The views and conclusions contained herein are those of the authors and should not be interpreted as necessarily representing the official policies or endorsements, either expressed or implied, of the Air Force Research Laboratory or the U.S. Government. References“Osteoarthritis,”
(2002) Google Scholar
J. P. Arokoski,
M. M. Hyttinen,
T. Lapveteläinen,
P. Takács,
B. Kosztáczky,
L. Módis,
V. Kovanen, and
H. Helminen,
“Decreased birefringence of the superficial zone collagen network in the canine knee (stifle) articular cartilage after long distance running training, detected by quantitative polarized light microscopy,”
Ann. Rheum. Dis., 55 253
–264
(1996). 0003-4967 Google Scholar
Y. Xia,
J. B. Moody,
H. A. Alhadlaq,
N. Burton-Wurstert, and
G. Lust,
“Characteristics of topographical heterogeneity of articular cartilage over the joint surface of a humeral head,”
Osteoarthritis Cartilage, 10 370
–380
(2002). 1063-4584 Google Scholar
Y. Xia,
J. B. Moody,
H. Alhadlaq, and
J. Hu,
“Imaging the physical and morphological properties of a multi-zone young articular cartilage at microscopic resolution,”
J. Magn. Reson Imaging, 17 365
–374
(2003). 1053-1807 Google Scholar
Handbook of Optical Coherence Tomography, 1
–741 Marcel Dekker Inc., New York
(2002). Google Scholar
A. G. Podoleanu,
“Optical coherence tomography,”
Br. J. Radiol., 78 976
–988
(2005). https://doi.org/10.1259/bjr/55735832 0007-1285 Google Scholar
J. Rogowska,
C. M. Bryant, and
M. E. Brezinski,
“Cartilage thickness measurements from optical coherence tomography,”
J. Opt. Soc. Am. A Opt. Image Sci. Vis, 20 357
–367
(2003). 1084-7529 Google Scholar
C. W. Han,
C. R. Chu,
N. Adachi,
A. Usas,
F. H. Fu,
J. Huard, and
Y. Pan,
“Analysis of rabbit articular cartilage repair after chondrocyte implantation using optical coherence tomography,”
Osteoarthritis Cartilage, 11 111
–121
(2003). 1063-4584 Google Scholar
J. M. Herrmann,
C. Pitris,
B. E. Bouma,
S. A. Boppart,
C. A. Jesser,
D. L. Stamper,
J. G. Fujimoto, and
M. E. Brezinski,
“High resolution imaging of normal and osteoarthritic cartilage with optical coherence tomography,”
J. Rheumatol., 26 627
–635
(1999). 0315-162X Google Scholar
W. Drexler,
D. Stamper,
C. Jesser,
X. Li,
C. Pitris,
K. Saunders,
S. Martin,
M. B. Lodge,
J. G. Fujimoto, and
M. E. Brezinski,
“Correlation of collagen organization with polarization sensitive imaging of in vitro cartilage implications for osteoarthritis,”
J. Rheumatol., 28 1311
–1318
(2001). 0315-162X Google Scholar
M. J. Roberts,
S. B. Adams,
N. A. Patel,
D. L. Stampler,
M. S. Westmore,
S. D. Martin,
J. G. Fujimoto, and
M. E. Brezinski,
“A new approach for assessing early osteoarthritis in the rat,”
Anal. Bioanal. Chem., 377 1003
–1006
(2003). 1618-2642 Google Scholar
Y. Pan,
Z. Li,
T. Xie, and
C. R. Chu,
“Hand-held arthroscopic optical coherence tomography for in-vivo high-resolution imaging of articular cartilage,”
J. Biomed. Opt., 8 648
–654
(2003). https://doi.org/10.1117/1.1609201 1083-3668 Google Scholar
C. R. Chu,
D. Lin,
J. L. Geisler,
C. T. Chu,
F. H. Fu, and
Y. Pan,
“Arthroscopic microscopy of articular cartilage using optical coherence tomography,”
Am. J. Sports Med., 32 699
–709
(2004). 0363-5465 Google Scholar
X. Li,
S. Martin,
C. Pitris,
R. Ghanta,
D. Stamper,
M. Harman,
J. G. Fujimoto, and
M. E. Brezinski,
“High-resolution optical coherence tomographic imaging of osteoarthritic cartilage during open knee surgery,”
Arthritis Res. Ther., 7 R318
–R323
(2005). https://doi.org/10.1186/ar1491 1478-6354 Google Scholar
S. B. Adams,
P. R. Herz,
D. L. Stamper,
M. J. Roberts,
S. Bourquin,
N. A. Patel,
K. Schneider,
S. D. Martin,
S. Shortkroff,
J. G. Fujimoto, and
M. E. Brezinski,
“High-resolution imaging of progressive articular cartilage degeneration,”
J. Orthop. Res., 24 708
–715
(2006). 0736-0266 Google Scholar
T. Xie,
S. Guo,
J. Zhang,
Z. Chen, and
G. M. Peavy,
“Determination of characteristic of degenerative joint disease using optical coherence tomography and polarization sensitive optical coherence tomography,”
Lasers Surg. Med., 38 852
–865
(2006). https://doi.org/10.1002/lsm.20394 0196-8092 Google Scholar
J. F. de Boer,
T. E. Milner, and
J. S. Nelson,
“Determination of the depth-resolved Stokes parameters of light backscattered from turbid media by use of polarization-sensitive optical coherence tomography,”
Opt. Lett., 24 300
–302
(1999). 0146-9592 Google Scholar
C. K. Hitzenberger,
E. Goetzinger,
M. Sticker,
M. Pircher, and
A. F. Fercher,
“Measurement and imaging of birefringence and optic axis orientation by phase resolved polarization sensitive optical coherence tomography,”
Opt. Express, 9 780
–790
(2001). 1094-4087 Google Scholar
J. F. de Boer and
T. E. Milner,
“Review of polarization sensitive optical coherence tomography and Stokes vector determination,”
J. Biomed. Opt., 7
(3), 359
–371
(2002). https://doi.org/10.1117/1.1483879 1083-3668 Google Scholar
A. F. Fercher,
W. Drexler,
C. K. Hitzenberger, and
T. Lasser,
“Optical coherence tomography-principles and applications,”
Rep. Prog. Phys., 66 239
–303
(2003). https://doi.org/10.1088/0034-4885/66/2/204 0034-4885 Google Scholar
S. Jiao,
M. Todorovic,
G. Stoica, and
L. V. Wang,
“Fiber-based polarization-sensitive Mueller matrix optical coherence tomography with continuous source polarization modulation,”
Appl. Opt., 44 5463
–5467
(2005). https://doi.org/10.1364/AO.44.005463 0003-6935 Google Scholar
T. Xie,
S. Guo,
J. Zhang,
Z. Chen, and
G. M. Peavy,
“Use of polarization sensitive optical coherence tomography to determine the directional polarization sensitivity of articular cartilage and meniscus,”
J. Biomed. Opt., 11 064001
(2006). https://doi.org/10.1117/1.2397574 1083-3668 Google Scholar
B. H. Park,
C. Saxer,
S. M. Srinivas,
J. S. Nelson, and
J. F. de Boer,
“In vivo burn depth determination by high-speed fiber-based polarization sensitive optical coherence tomography,”
J. Biomed. Opt., 6
(4), 474
–479
(2001). https://doi.org/10.1117/1.1413208 1083-3668 Google Scholar
D. Fried,
J. Xie,
S. Shafi,
J. Featherstone,
T. M. Breunig, and
C. Le,
“Imaging caries lesions and lesion progression with polarization sensitive optical coherence tomography,”
J. Biomed. Opt., 7
(4), 618
–627
(2002). https://doi.org/10.1117/1.1509752 1083-3668 Google Scholar
E. Gotzinger,
M. Pircher,
M. Sticker,
A. F. Fercher, and
C. K. Hitzenberger,
“Measurement and imaging of birefringent properties of the human cornea with phase-resolved, polarization-sensitive optical coherence tomography,”
J. Biomed. Opt., 9
(1), 94
–102
(2004). https://doi.org/10.1117/1.1629308 1083-3668 Google Scholar
B. Cense,
T. C. Chen,
B. H. Park,
M. C. Pierce, and
J. F. de Boer,
“In vivo birefringence and thickness measurements of the human retinal nerve fiber layer using polarization-sensitive optical coherence tomography,”
J. Biomed. Opt., 9
(1), 121
–125
(2004). https://doi.org/10.1117/1.1627774 1083-3668 Google Scholar
J. Stasswimmer,
M. C. Pierce,
B. H. Park,
V. Neel, and
J. F. de Boer,
“Polarization-sensitive optical coherence tomography of invasive basal cell carcinoma,”
J. Biomed. Opt., 9
(2), 292
–298
(2004). https://doi.org/10.1117/1.1644118 1083-3668 Google Scholar
S. M. Srinivas,
J. F. de Boer,
H. Park,
K. Keikhanzadeh,
H. L. Huang,
J. Zhang,
W. Q. Jung,
Z. Chen, and
J. S. Nelson,
“Determination of burn depth by polarization-sensitive optical coherence tomography,”
J. Biomed. Opt., 9
(1), 207
–212
(2004). https://doi.org/10.1117/1.1629680 1083-3668 Google Scholar
P. Ngaotheppitak,
C. L. Darling, and
D. Fried,
“Measurement of the severity of natural smooth surface (interproximal) caries lesions with polarization sensitive optical coherence tomography,”
Lasers Surg. Med., 37 78
–88
(2005). https://doi.org/10.1002/lsm.20169 0196-8092 Google Scholar
S. D. Giattina,
B. K. Courtney,
P. R. Herz,
M. Harman,
S. Shortkroff,
D. Stamper,
B. Liu,
J. G. Fujimoto, and
M. E. Brezinski,
“Assessment of coronary plaque collagen with polarization sensitive optical coherence tomography (PS-OCT),”
Int. J. Cardiol., 107 400
–409
(2006). https://doi.org/10.1016/j.ijcard.2005.11.036 0167-5273 Google Scholar
J. T. Oh,
S. W. Lee,
Y. S. Kim,
K. B. Suhr, and
B. M. Kim,
“Quantification of the wound healing using polarization-sensitive optical coherence tomography,”
J. Biomed. Opt., 11 041124
(2006). https://doi.org/10.1117/1.2338826 1083-3668 Google Scholar
S. J. Matcher,
C. P. Winlove, and
S. V. Gangnus,
“The collagen structure of bovine intervertebral disc studied using polarization-sensitive optical coherence tomography,”
Phys. Med. Biol., 49 1295
–1306
(2004). https://doi.org/10.1088/0031-9155/49/7/016 0031-9155 Google Scholar
N. Ugryumova,
D. P. Attenburrow,
C. P. Winlove, and
S. J. Matcher,
“The collagen structure of equine articular cartilage, characterized using polarization-sensitive optical coherence tomography,”
J. Phys. D, 38 2612
–2619
(2005). https://doi.org/10.1088/0022-3727/38/15/012 0022-3727 Google Scholar
J. M. Clark,
“Variation of collagen fiber alignment in a joint surface: a scanning electron microscope study of the tibial plateau in dog, rabbit, and man,”
J. Orthop. Res., 9 246
–257
(1991). https://doi.org/10.1002/jor.1100090213 0736-0266 Google Scholar
Manual of Histologic Staining Methods of the Armed Forces Institute of Pathology, 3rd ed.McGraw-Hill, New York
(1968). Google Scholar
J. M. Clark,
“The organization of collagen fibrils in the superficial zones of articular cartilage,”
J. Anat., 171 117
–130
(1990). 0021-8782 Google Scholar
|


