|
|
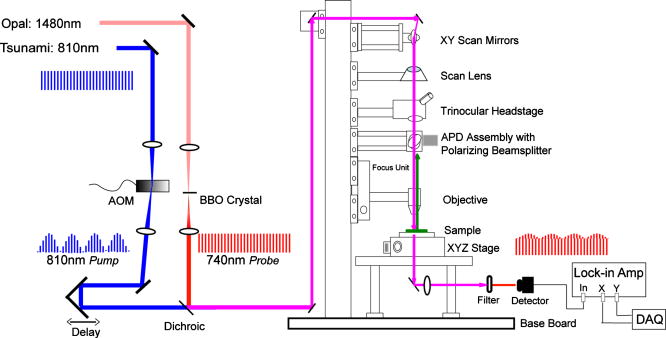
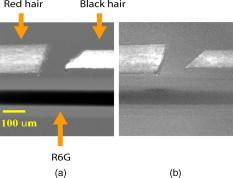
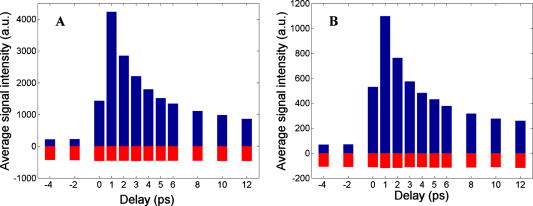
1.IntroductionEarly detection of melanoma is a long-standing challenge in clinical dermatology. The current diagnosis method based on histopathology results is lengthy and painful, and varies largely depending on the expertise of the pathologist. Over the last decade, noninvasive optical in vivo spectroscopy through linear absorption, Raman, and fluorescence has shown potential in the diagnosis and characterization of human skin diseases.1, 2, 3 These methods can provide a variety of biophysical properties of cutaneous molecular markers such as melanin, hemoglobin, collagen, and lipids, but they can only explore the surface, and give far worse spatial resolution than histopathology (except confocal-based methods, which are discussed later). Therefore, it is desirable to develop a noninvasive high-resolution deep tissue imaging method with improved sensitivity and diagnostic accuracy for melanocytic skin cancer. Currently the most developed and promising approach is reflectance mode confocal laser scanning microscopy (rCLSM). CLSM images the skin by exploiting microscopic biological variations in refractive indexes. Components of skin whose refractive indexes are higher than the average refractive index of epidermis, such as keratin in the stratum corneum, hydrated collagen, and melanin, provide molecular and structural contrast in backscattered light. In particular, melanin granules have a high refractive index (1.7) compared with the surrounding cytoplasm (1.35), providing a strong endogenous contrast for rCLSM imaging of melanocytes.4 The imaging depth with rCLSM is typically limited to less than .5 The morphological features indicated by melanocyte distribution as well as cell shape and cell size provide important diagnostic differentiation between benign and malignant melanocytic skin lesions.6, 7, 8 However, rCLSM also suffers from a few drawbacks. For example, the scattering measurement is not background free and is not specific to melanin. Langerhans cells may appear as melanocytes in the epidermis.9 Another important feature that is often missing from optical-imaging-based diagnostic methods is the molecular aspects of melanogenesis (the production of melanin in specialized organelles called melanosomes) in the malignant transformation of skin lesions. Two types of melanins are generally found in skin:10, 11 eumelanin, a black or dark brown insoluble material, and pheomelanin, a yellow or reddish-brown alkali-soluble material. Both types are synthesized within melanosomes belonging to melanocytes, and distributed through dendritic extensions of the melanocytes to surrounding epidermal cells (keratinocytes), resulting in pigmentation of the skin. One of the major functions of melanin pigmentation is generally believed to be shielding the skin from harmful ultraviolet radiation (UVR). However, there is considerable evidence suggesting that pheomelanin or its precursors play an important role in carcinogenesis/mutagenesis.12 This may arise because pheomelanin is more vulnerable than eumelanin to UVR, thus generating free radicals and leading to DNA damage and increased mutagenicity.13, 14 This implies that people with different pigments would be expected to have varying risk factors for developing skin cancer or melanoma, as supported by epidemiological studies.15 In addition, it has also been shown that the production of pheomelanin is increased significantly in melanoma and melanocytic nevi compared with normal skin.16, 17 Therefore, the differentiation of eumelanin and pheomelanin in skin tissue can provide information about changes in melanogenesis and potentially be useful for clinical diagnosis of the progression stage of melanoma.18 Previously we have demonstrated a pump-probe-type imaging method to specifically map the melanin distribution in cells with high sensitivity.19 This method has all the advantages of other multiphoton imaging techniques, such as inherent sectioning capabilities and high sensitivity. Moreover, it is much more specific to endogenous melanocytic features than rCLSM. Here we improve on our previous study with longer pump-probe wavelengths. More importantly, we studied the long-lived signal in detail and showed that both photothermal effects and long-lived excited states could contribute to this signal. Eumelanin and pheomelanin exhibited markedly different long-lived signals both in their lifetimes and in the ratio of short-lived to long-lived signal. We also demonstrated epimode imaging using human hair as the model system. Utilizing these differences in microscopic study, we should be able to determine the eumelanin and pheomelanin distribution in skin tissues with high resolution. This work could open a new window in the study of melanogenesis and transformation of melanocytes from normal to malignant. 2.Materials and Methods2.1.Sample PreparationSkin samplesDeidentified fixed human skin slides (unstained) were obtained from the Department of Dermatology at Duke University Medical Center. All the skin slides have corresponding histopathology results. Skin slice thickness is about . Hair samplesIndonesian, black human hair was purchased from R. Parrino Hair Goods (Northport, New York). Red human hair samples were obtained from a -old female locally (Durham, North Carolina), and the hair had never been permed or dyed. Chemical degradation analysis of melanosomes from those hair samples showed a dominant eumelanin content with undetectable pheomelanin in the black hair melanosomes, while the red hair melanosomes contained a mixed type melanin, predominantly pheomelanin, with a low eumelanin content.10, 11 Phantom sampleA simple phantom containing a capillary tube (inner diameter , outer diameter ) containing R6G solution, a red hair with a diameter of , and a dark hair with a diameter of was made. The three specimens were immersed in immersion oil (Cargille Laboratory, Cedar Grove, NJ) and placed in close proximity to allow imaging of all three in a single frame. Melanosome samplesMelanosome samples were isolated from black and red human hairs according to the literature.20 For melanosome imaging experiments, melanosomes were suspended in a drop of immersion oil and sandwiched between a precleaned microscope slide and coverslip. The application of immersion oil was necessary to prevent photodamage of the samples. 2.2.Two-Color Transient Absorption MeasurementsWe used a simple modified pump-probe method to study the transient absorption imaging of melanin samples. The experimental setup has been described previously.19, 21 Utilizing a high frequency modulation transfer technique, we are able to sensitively detect transient absorption changes in a transient absorption measurement, which is much better than typically measured with an amplified laser system, with the additional advantage of much lower power levels. This is extremely important for biological imaging applications due to both peak power and average power damage concerns.22 Here we made some modifications to the original setup. The apparatus of our two-color transient absorption measurement is shown in Fig. 1 . It resembles the traditional pump-probe experimental setup. A small fraction of the output of a mode-locked Ti: sapphire laser (Tsunami, , , from Spectra Physics, Mountain View, CA) was intensity modulated sinusoidally with an acousto-optical modulator (AOM, from Crystal Technology, Palo Alto, CA) at . It was used as the pump pulse with a center wavelength of and sent through a mechanical delay stage. The pulse train from a synchronously pumped optical parametric oscillator (Spectra Physics, Opal, , , output wavelength tunable from ) was frequency doubled by a -thick -barium borate crystal (BBO) outside the cavity. The second harmonic at was used as the probe. The pump and probe beams were then combined on a dichroic mirror (DCXR760, from Chroma, Rockingham, VT) and sent into a home-built laser scanning microscope (scanning mirror from Cambridge Technology, Olympus PlanApo objective with ). Before entering the objective, the two beams passed through a polarizing beamsplitter to allow only polarization to pass. The sample was placed on an aluminum plate attached to a motorized stage (Newport, Irvine CA). The detection setup was composed of a three-element lens system to refocus the probe beam, a bandpass filter (HQ710/130, Chroma) to remove the pump beam, and a large area amplified photodiode (PDA55 from Thorlabs, Newton, NJ) to detect the signal. For epidetection, backscattered light reflected by the polarizing beamsplitter was also refocused, filtered, and detected with an avalanche photodiode (APD, from Hamamatsu Bridgewater, NJ). The photodiode outputs were then sent to a rf lock-in amplifier. Since lock-in detection is phase-sensitive, both the amplitude and the phase of the modulation signal (represented by and channel signals at the output of the lock-in amplifier) can be obtained. We sent both and channel signals to a DAQ acquisition card (6115E DAQ board, from National Instruments, Austin, TX). All data acquisition and data analysis were done with home-built software written in Labwindows/CVI 7.1 (National Instruments) and Matlab 6.5 (Mathworks, Natick, Massachusetts). 3.Results and Discussion3.1.In Vitro Imaging of Melanin in Skin SamplesPreviously we have demonstrated imaging of melanin in B16 melanoma cells. Here with longer pump and probe wavelengths, we demonstrated imaging of fixed thin skin slices in transmission mode at a higher signal-to-noise ratio (SNR) with even less optical power than our previous study. Figure 2a shows the mosaic image of five bright field images of an invasive melanoma skin tissue sample (some artifacts are present at the sides of the images due to nonuniform illumination). The epidermis and dermis are on the lower side of the black line (edge of stratum corneum, which is marked with blue ink). Although not stained, the melanin granules still can be observed along the basal layer as yellow to brown particles in the image. Unlike normal skin, melanomas include an increased density of pleomorphic melanocytic cells. Figure 2b shows the corresponding mosaic image of five laser scanning images (only the channel signal is shown) based on our two-color transient absorption microcopy technique. The SNR of the image is around 50 at pump power and probe power. It reveals far more detail of the melanin granules’ distribution than the bright field image. We can clearly delineate the stratum corneum (seen as a bright line due to strong signal from the blue ink mark) and the basal cell layer separating the epidermis from the dermis, which is easily identified as a thick layer of bright melanin dots with the typical papillary ridges of the dermis. In the center and left side of the image, tumor cells are also present in the dermis. Figures 2c and 2d show higher resolution images obtained with a objective (Olympus UPlanFLN , ) at two different locations [marked with orange boxes in Fig. 2b]. The left image shows numerous cells that are irregular in size and shape, forming a large mesh in a melanin pigmentation network. The separation between epidermal and dermal compartments is very unclear. The right image shows much more uniformly oval-shaped cells primarly restricted to the epidermis; potentially melanoma cells at an earlier tumor stage. These nonuniform melanin features might be useful in the diagnosis of melanoma in vivo and may represent different growth stages. Fig. 2Mosiac of five images of an invasive melanoma skin slice in the (a) bright field taken with a DCM 130 camera, and (b) laser scanning mode acquired with two-color transient absorption microscopy. (c) and (d) show higher magnification two-color transient absorption images taken with a objective at the two locations indicated with the orange boxes. (Color online only.) 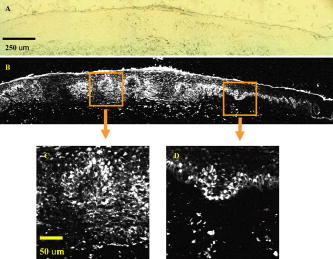 3.2.Epimode Imaging of MelaninTransmission mode imaging is not a viable solution in many cases. In principle, for thick tissue imaging, any probe photons backscattered after the focus carry exactly the same modulation information as transmitted photons, which are also scattered multiple times before reaching the detector. Therefore, epimode imaging for a thick sample is entirely possible and should provide identical information to transmission mode imaging. However, unlike fluorescence, the backscattered light is at the same wavelength as the excitation light. Therefore the dichroic mirror has to be replaced with a polarizing beamsplitter to separate the backscattered light. We set the polarization of the pump and probe beam to polarization so they can pass the polarizing beamsplitter completely. When the light enters tissue, some of the photons will be backscattered and depolarized. The polarization component of the backscattered light can then be reflected by the polarizing beamsplitter and detected with an APD. We imaged hair samples to demonstrate the viability of epimode imaging. Figure 3 shows transmission and epimode images of a phantom sample containing a R6G capillary tube, black hair, and red hair at zero interpulse delay. Image size is . We can see that epimode images can also be used for high resolution imaging, although with a deteriorated SNR of 9 compared to that of 110 in transmission mode. This is partly due to not enough scattering in the sample. With thicker samples, we expect to have larger SNR. The difference in contrast is because the amount of light that is scattered (or transmitted) and effectively detected is not uniform across the whole field of view. The R6G solution has the least amount of scattering (or reflection from glass), while the red hair with a larger diameter is the most scattering. With bulk tissue samples, this problem should be minimized within a small imaging area. From the phase of the signal at zero delay, we can infer that at these wavelengths, the signals from both red hair and black hair are due to bleaching because they are opposite in phase compared to the R6G’s known two-photon absorption signal. This is different from the previous study at shorter pump-probe wavelengths.19 3.3.Photothermal Effects and Long-Lived Excited StatesIn the previous study, we have seen that there is a signal preceding zero interpulse delay in the channel as well as a constant signal in the channel, independent of interpulse delay.19 This is commonly seen in all melanin samples. Since our laser repetition rate is , a negative delay is essentially the same as a very long delay of about . Therefore, we conclude that there is a long-lived component that gives rise to the amplitude and the phase of signals at negative delays. Several different mechanisms could contribute to this long-lived signal: 1. the excited state initially formed by the pump pulse went into another long-lived excited state through intersystem crossing; 2. the pump pulse heats up the sample and induces an absorption change of the probe pulse; 3. the pump pulse heats up the sample and forms a thermal lens, therefore changing the focusing of the probe pulse. The third mechanism does not change the total probe intensity but only changes its focusing. The signal arises from imperfect collection of the probe beam (equivalent to an aperture). For a thin sample, the phase of this signal should depend on whether the beam focus is before or after the sample, which can be easily measured with a scan.23 Figure 4 shows the scan results of a thin layer of black hair melanosomes on a microscope slide at zero delay. The optical power deposited on the sample is for the pump and for the probe. Owing to the change of sign in the channel signal in the scan, the thermal lensing effect must be present. However, this does not exclude other possible contributions. For a thick sample, the thermal lensing effect should disappear, because multiple scattering will disrupt the phase information of the transmitted probe and therefore eliminate most of the residual thermal lensing effect. Figure 5 shows the scan results of a black hair sample at zero delay. We can see that the phase of the channel signal does not change sign over the scan range, which suggests that the thermal lensing effect is mostly eliminated. Fig. 4(a) Transient absorption image of black hair melanosome sample. (b) and (c) show the average signals in the ROI [marked with black box in (a)] with respect to depth in the and channels, respectively.  Fig. 5(a) Transient absorption image of black hair sample. (b) and (c) show the average signals in the ROI [marked with black box in (a)] with respect to depth in the and channels respectively. 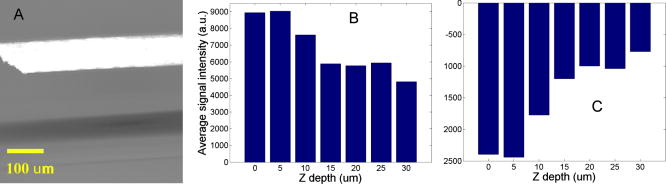 To further determine whether the origin of the long-lived signal is related to the second mechanism (heating effect), we did a ratio analysis by offsetting the pump-probe beam overlap. Unlike electronic excitation of the molecules, a heating effect is not localized at the focus because of heat diffusion, which typically occurs on a time scale of 0.25 to .24 If we assume the long-lived signal is caused by heating effects, because it is a steady-state effect, the amount of signal is not determined by the instantaneous heating but by the thermal gradient formed. If the pump-probe beam foci have a slight offset, the ratio of the signal at long delay time to the excitation-localized shorted-lived signal will increase. Figure 6 shows the signals of the red hair sample at various delays for both maximum overlap and slight offset of the pump probe beams (by changing the direction of probe beam slightly at the dichroic mirror). The ratio of long-lived signal to short-lived signal calculated for red hair at maximum overlap is 0.107, while the corresponding ratio for offsetted overlap is 0.105. The closeness of these two ratios suggests that the long-lived signal is not primarily from heating effects, but from real excited states, similar to the short-lived signal. 3.4.Differentiating Eumelanin and Pheomelanin in TissueIt has been a long-standing challenge in pigment cell research to quantify the distribution of melanins in skin tissue in vivo because of their complex nature. Extracted melanins have been extensively studied using a wide variety of techniques, such as high performance liquid chromatography (HPLC),25 electron microscopy,26 and spectrophotometric methods.27, 28 However, these methods require very complicated and lengthy preprocessing of the sample. They are also invasive and cannot provide in situ microscopic information. Two-photon fluorescence and two-photon absorption microscopy of melanins has previously been studied and utilized in microscopic imaging.29, 30 However, no attempt was made to differentiate eumelanin from pheomelanin. With our highly sensitive two-color transient absorption measurement, we are now able to distinguish them with different phase behaviors. It is interesting to compare the long-lived excited state lifetimes for different hair samples. With the same phantom sample used in the previous section, scanning images of black hair and red hair samples were acquired at various modulation frequencies. We can use the simple model to calculate the lifetime based on the change of phase in the signal, similar to frequency domain fluorescence lifetime measurements.31 For each image at a different modulation frequency, we can calculate the phase from the and channel signals. The absolute phase images are plotted in Fig. 7 , and we can clearly see that black hair and red hair have different phase images (for R6G, the phase is always zero because there is no long-lived signal). To calculate the lifetimes of the long-lived excited states, we used linear regression fitting of average in selected regions of interests (ROIs, marked with black boxes) against the modulation frequency . The resulting lifetime for red hair is 0.148 , while for black hair it is 0.293 . It should be mentioned that the lifetimes measured could also be dependent on the surrounding oxygen concentration (in this experiment, the samples were exposed to ambient air before immersed in the oil for imaging). This result also confirms our conclusions that the effect is not predominantly thermal, as a thermal contribution might have different magnitudes for the two different samples, but would surely have the same decay constant. Fig. 7(a) Phase images of the hair samples at different modulation frequency. (b) Linear fitting of the long-lived excited state lifetimes for red and black hair melanosomes. 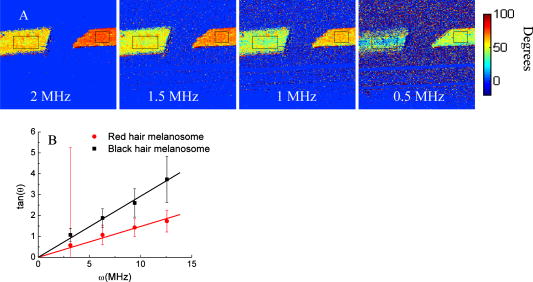 Another important difference for red and black hair samples is in the ratio of long-lived signal to short-lived signal, which is directly proportional to the efficiency of intersystem crossing. Figure 8 shows the averaged and channel signals for both red hair and black hair samples with respect to interpulse delay. The long-lived signal size can be calculated with both the and channel signal before zero delay, while the short-lived signal can be approximated as the maximum channel signal. The calculated ratio for red hair is around 0.1, while for black hair it is around 0.5. Fig. 8Comparison of the ratio of long-lived signal to short-lived signal for (a) pheomelanin (red hair) and (b) eumelanin (black hair).  As we can see, the long-lived excited state lifetime and ratio of long-lived to short-lived signal can be easily distinguished between the two types of melanosome. This opens up the possibility of doing differential imaging of eumelanin and pheomelanin in tissue. 4.ConclusionsThis work demonstrates the feasibility of utilizing two-color transient absorption microscopy to image melanins in tissue and differentiating eumelanin and pheomelanin. With as the pump beam and as the probe beam, we demonstrate high SNR imaging of melanin granules within the epidermis and dermis of an invasive melanoma skin sample. Submicrometer features can be well resolved and many important morphological features can be characterized based on the image. We implement epimode imaging and demonstrate its validity using hair samples. With the hair model system, we study in detail the long-lived signal in transient absorption imaging. It is discovered that photothermal effects contribute to the signal significantly when the sample is thin, but long-lived excited state effects are dominant with thick samples. Two important differences are found between eumelanin and pheomelanin: eumelanin (in black hair) has about a two times larger long-lived excited state lifetime compared to pheomelanin, and the ratio of long-lived signal to short-lived signal is about five times as large for pheomelanin as it is for eumelanin. With these differences, we can expect to use two-color transient absorption as a nonlinear signature in imaging not only melanin distribution changes, but also melanin production changes in human skin tissue with 3-D subcellular resolution in the future, which can be an invaluable diagnostic tool in noninvasive skin imaging for differentiating normal tissue, benign nevi, and melanomas. ReferencesG. N. Stamatas,
B. Z. Zmudzka,
N. Kollias, and
J. Z. Beer,
“Non-invasive measurements of skin pigmentation in situ,”
Pigment Cell Res., 17 618
–626
(2004). 0893-5785 Google Scholar
Z. Huang,
H. Lui,
X. K. Chen,
A. Alajlan,
D. I. McLean, and
H. Zeng,
“Raman spectroscopy of in vivo cutaneous melanin,”
J. Biomed. Opt., 9
(6), 1198
–1205
(2004). https://doi.org/10.1117/1.1805553 1083-3668 Google Scholar
Z. Huang,
H. Zeng,
I. Hamzavi,
A. Alajlan,
E. Tan,
D. I. McLean, and
H. Lui,
“Cutaneous melanin exhibiting fluorescence emission under near-infrared light excitation,”
J. Biomed. Opt., 11 034010
(2006). https://doi.org/10.1117/1.2204007 1083-3668 Google Scholar
M. Rajadhyaksha,
M. Grossman,
D. Esterowitz, and
R. H. Webb,
“In vivo confocal scanning laser microscopy of human skin—melanin provides strong contrast,”
J. Invest. Dermatol., 104 946
–952
(1995). https://doi.org/10.1111/1523-1747.ep12606215 0022-202X Google Scholar
M. Rajadhyaksha,
S. Gonzalez,
J. M. Zavislan,
R. R. Anderson, and
R. H. Webb,
“In vivo confocal scanning laser microscopy of human skin II: advances in instrumentation and comparison with histology,”
J. Invest. Dermatol., 113 293
–303
(1999). https://doi.org/10.1046/j.1523-1747.1999.00690.x 0022-202X Google Scholar
G. Pellacani,
A. M. Cesinaro,
C. Longo,
C. Grana, and
S. Seidenari,
“Microscopic in vivo description of cellular architecture of dermoscopic pigment network in Nevi and melanomas,”
Arch. Dermatol., 141 147
–154
(2005). 0003-987X Google Scholar
A. Gerger,
S. Koller,
T. Kern,
C. Massone,
K. Steiger,
E. Richtig,
H. Kerl, and
J. Smolle,
“Diagnostic applicability of in vivo confocal laser scanning microscopy in melanocytic skin tumors,”
J. Invest. Dermatol., 124 493
–498
(2005). https://doi.org/10.1111/j.0022-202X.2004.23569.x 0022-202X Google Scholar
D. S. Gareau,
G. Merlino,
C. Corless,
M. Kulesz-Martin, and
S. L. Jacques,
“Noninvasive imaging of melanoma with reflectance mode confocal scanning laser microscopy in a murine model,”
J. Invest. Dermatol., 127 2184
–2190
(2007). https://doi.org/10.1038/sj.jid.5700829 0022-202X Google Scholar
K. J. Busam,
A. A. Marghoob, and
A. Halpern,
“Melanoma diagnosis by confocal microscopy: promise and pitfalls,”
J. Invest. Dermatol., 125 7
–9
(2005). 0022-202X Google Scholar
Y. Liu,
L. Hong,
K. Wakamatsu,
S. Ito,
B. Adhyaru,
C. Y. Cheng,
C. R. Bowers, and
J. D. Simon,
“Comparison of structural and chemical properties of black and red human hair melanosomes,”
Photochem. Photobiol., 81 135
–144
(2005). 0031-8655 Google Scholar
S. Ito and
K. Wakamatsu,
“Quantitative analysis of eumelanin and pheomelanin in humans, mice, and other animals: a comparative review,”
Pigment Cell Res., 16 523
–531
(2003). 0893-5785 Google Scholar
S. Takeuchi,
W. G. Zhang,
K. Wakamatsu,
S. Ito,
V. J. Hearing,
K. H. Kraemer, and
D. E. Brash,
“Melanin acts as a cause an atypical potent UVB photosensitizer to mode of cell death in murine skin,”
Proc. Natl. Acad. Sci. U.S.A., 101 15076
–15081
(2004). 0027-8424 Google Scholar
M. R. Chedekel,
S. K. Smith,
P. W. Post,
A. Pokora, and
D. L. Vessell,
“Photodestruction of pheomelanin—role of oxygen,”
Proc. Natl. Acad. Sci. U.S.A., 75 5395
–5399
(1978). 0027-8424 Google Scholar
T. Ye,
L. Hong,
J. Garguilo,
A. Pawlak,
G. S. Edwards,
R. J. Nemanich,
T. Sarna, and
J. D. Simon,
“Photoionization thresholds of melanins obtained from free electron laser-photoelectron emission microscopy, femtosecond transient absorption spectroscopy and electron paramagnetic resonance measurements of oxygen photoconsumption,”
Photochem. Photobiol., 82 733
–737
(2006). 0031-8655 Google Scholar
M. R. Vincensi,
M. d’Ischia,
A. Napolitano,
E. M. Procaccini,
G. Riccio,
G. Monfrecola,
P. Santoianni, and
G. Prota,
“Phaeomelanin versus eumelanin as a chemical indicator of ultraviolet sensitivity in fair-skinned subjects at high risk for melanoma: a pilot study,”
Melanoma Res., 8 53
–58
(1998). 0960-8931 Google Scholar
T. G. Salopek,
K. Yamada,
S. Ito, and
K. Jimbow,
“Dysplastic melanocytic nevi contain high-levels of pheomelanin—quantitative comparison of pheomelanin eumelanin levels between normal skin, common nevi, and dysplastic nevi,”
Pigment Cell Res., 4 172
–179
(1991). 0893-5785 Google Scholar
K. Jimbow,
S. K. Lee,
M. G. King,
H. Hara,
H. Chen,
J. Dakour, and
H. Marusyk,
“Melanin pigments and melanosomal proteins as differentiation markers unique to normal and neoplastic melanocytes,”
J. Invest. Dermatol., 100 S259
–S268
(1993). 0022-202X Google Scholar
L. Chin,
“The genetics of malignant melanoma: lessons from mouse and man,”
Nat. Rev. Cancer, 3 559
–570
(2003). 1474-175X Google Scholar
D. Fu,
T. Ye,
T. E. Matthews,
G. Yurtsever, and
W. S. Warren,
“Two-color, two-photon, and excited-state absorption microscopy,”
J. Biomed. Opt., 12 054004
(2007). https://doi.org/10.1117/1.2780173 1083-3668 Google Scholar
Y. Liu,
V. R. Kempf,
J. B. Nofsinger,
E. E. Weinert,
M. Rudnicki,
K. Wakamatsu,
S. Ito, and
J. D. Simon,
“Comparison of the structural and physical properties of human hair eumelanin following enzymatic or acid/base extraction,”
Pigment Cell Res., 16 355
–365
(2003). 0893-5785 Google Scholar
D. Fu,
T. Ye,
T. E. Matthews,
G. Yurtsever,
L. Hong,
J. D. Simon, and
W. S. Warren,
“Two-color excited-state absorption imaging of melanins,”
Proc. SPIE, 6424 642402
(2007). 0277-786X Google Scholar
B. R. Masters,
P. T. C. So,
C. Buehler,
N. Barry,
J. D. Sutin,
W. W. Mantulin, and
E. Gratton,
“Mitigating thermal mechanical damage potential during two-photon dermal imaging,”
J. Biomed. Opt., 9 1265
–1270
(2004). https://doi.org/10.1117/1.1806135 1083-3668 Google Scholar
S. M. Mian,
S. B. McGee, and
N. Melikechi,
“Experimental and theoretical investigation of thermal lensing effects in mode-locked femtosecond Z-scan experiments,”
Opt. Commun., 207 339
–345
(2002). https://doi.org/10.1016/S0030-4018(02)01395-0 0030-4018 Google Scholar
B. Brazzini,
G. Hautmann,
I. Ghersetich,
J. Hercogova, and
T. Lotti,
“Laser tissue interaction in epidermal pigmented lesions,”
J. Eur. Acad. Dermatol. Venereol, 15 388
–391
(2001). 0926-9959 Google Scholar
B. Kongshoj,
A. Thorleifsson, and
H. C. Wulf,
“Pheomelanin and eumelanin in human skin determined by high-performance liquid chromatography and its relation to in vivo reflectance measurements,”
Photodermatol. Photoimmunol. Photomed., 22 141
–147
(2006). 0905-4383 Google Scholar
N. Nagai,
Y. J. Lee,
N. Nagaoka,
M. Gunduz,
K. Nakano,
T. Nojima,
H. Tsujigiwa,
E. Gunduz,
C. H. Siar, and
H. Nagatsuka,
“Elemental sulphur and alkali elutable melanin detected in oral melanosis and malignant melanoma by energy-filtering transmission electron microscopy,”
J. Oral Pathol. Med., 31 481
–487
(2002). 0904-2512 Google Scholar
N. Kollias,
“The spectroscopy of human melanin pigmentation,”
J. Invest. Dermatol., 102 268
–268
(1994). 0022-202X Google Scholar
H. Ozeki,
S. Ito,
K. Wakamatsu, and
A. J. Thody,
“Spectrophotometric characterization of eumelanin and pheomelanin in hair,”
Pigment Cell Res., 9 265
–270
(1996). 0893-5785 Google Scholar
T. Ye,
G. Yurtsever,
M. Fischer,
J. D. Simon, and
W. S. Warren,
“Imaging melanin by two-photon absorption microscopy,”
Proc. SPIE, 6089 60891X
(2006). 0277-786X Google Scholar
K. Teuchner,
J. Ehlert,
W. Freyer,
D. Leupold,
P. Altmeyer,
M. Stucker, and
K. Hoffmann,
“Fluorescence studies of melanin by stepwise two-photon femtosecond laser excitation,”
J. Fluoresc., 10 275
–281
(2000). https://doi.org/10.1023/A:1009453228102 1053-0509 Google Scholar
C. Y. Dong,
C. Buehler,
T. C. So,
T. French, and
E. Gratton,
“Implementation of intensity-modulated laser diodes in time-resolved, pump-probe fluorescence microscopy,”
Appl. Opt., 40 1109
–1115
(2001). https://doi.org/10.1364/AO.40.001109 0003-6935 Google Scholar
|