
|
|
1.IntroductionInflammation is one of the key factors associated with gingivitis.1 In clinical practice, this is evaluated by looking at the redness (erythema) and swelling (edema) of the investigated tissue and is scored using indices such as the gingival index (GI) and gingival bleeding index (GBI).2 However, these indices are subjective, and objective methods are needed to detect small changes in inflammation; this is especially the case when trying to assess the disease progression longitudinally. Functional parameters such as blood concentration, oxygenation, and blood flow in gingival tissues have been explored as methods to quantitatively evaluate the inflammation process. Previous studies have shown that gingival blood flow and blood concentration increase whereas tissue oxygen saturation reduces during gingival inflammation.2, 3, 4, 5 These measurements have been performed using laser Doppler flowmetry for the blood flow and tissue reflectance spectroscopy for the blood concentration and oxygenation. It is clear from these studies that measurements are site specific due to the spatial heterogeneity of the microcirculation vasculature; therefore, mapping these parameters in a 2-D image would provide additional information to single point measurements. Evaluation of blood concentration and oxygenation in tissues relies on the spectral absorption differences of oxygenated and deoxygenated blood.6 Approaches for extracting this information from single point spectral reflectance measurements have been proposed in the past, such as model fitting, accounting for the main chromophores and transport of light in tissue.7, 8, 9 In addition, spectral ratios at specific wavelengths have been used to extract relevant information as in the case of pulse oximetry.10, 11, 12 Oral cancer detection has been also reported using the diffuse reflectance ratio at two specific wavelengths based on the oxygenated hemoglobin absorption peaks.13 Imaging methods are challenged by the amount of data that has to be processed simultaneously. Analysis methods used to extract information on the distribution of chromophores in skin include spectral angle mapping,14 a method that employs a spectral space to map the similarities of every pixel spectral data in an image and a reference spectrum,15 and least-square fitting methods.16, 17 In fact, the latter method has been recently used to assess inflammation in skin.18 Most analyses, however, involve lengthy procedures and therefore are unsuitable for real-time measurements. To our knowledge, there are no reported studies describing the measurement of gingival blood content employing spectral imaging techniques. Here we explore the possibility of using this method to quantify gingival inflammation changes in vivo. In this study we have used multispectral imaging at eight different visible wavelength bands to inspect the diffuse reflectance of gingival tissues. Using the absorption coefficient of oxyHb and deoxyHb, we demonstrate that inflammation could be quantitatively imaged by calculating the spectral ratio . Our aim is to demonstrate that gingival disease progression can be evaluated using spectral imaging, and that results correlate to clinical gingival index (GI) scores. 2.Materials and Methods2.1.Clinical Protocol22 healthy volunteers (males and females) aged between 21 and old were recruited to take part in this study (Institutional Review Board approval number 171C, protocol number COL-MHT-DM, Concordia Research Laboratories, Incorporated). Volunteers with any previous medical history of cardiovascular problems were excluded from this study. Every volunteer was informed about the nature of the study and was asked to sign a consent form; they were all given the right to withdraw at any point of the study. Volunteers were randomly divided in two groups, namely the experimental group (11 patients) and the control group (11 patients). Volunteers within the experimental group wore a gingival shield covering the upper and lower teeth while brushing to create an induced gingivitis during part of the duration of the study. The control group was allowed to keep normal oral hygiene practices for the duration of the whole study. Figure 1 shows a patient flow chart with the number of patients in each group. The duration of the study was six weeks and included five clinical visits: screening, baseline, first week, second week, and rebound. Table 1 shows a description of the study across these visits. Table 1Clinical trial design.
Clinical gingival index (GI) scores19 and spectral images of the upper and lower front gingival papillae, from canine to canine (ten sites in total), were acquired for every subject on each visit. GI scores were taken by a single trained and calibrated examiner across the whole study. As a reference, the criteria used for the GI inflammation scores are shown in Table 2 . Table 2Gingival index (GI) criteria.19
Note that the initial groups shown in Fig. 1 refer to the number of patients allocated at the moment of recruitment, and these were updated for all groups at the end of the clinical trial, since two subjects withdrew from the study. In addition, the stopped group was created with patients from the initial experimental group who were allowed to resume oral hygiene after a week of no brushing (visit 3) due to rapid evidence of inflammation. Note that the rebound measurement (visit 5) for this group was taken two weeks after having resumed oral hygiene, i.e., week number 5. 2.2.InstrumentationA multispectral imaging system (MHT SpectroShade Micro, Zurich, Switzerland) was employed to capture the reflectance images for this study. The illumination consisted of eight different light emitting diode banks with wavelengths centered at 430, 460, 505, 530, 571, 589, 615, and according to the manufacturer. A black and white charge-coupled device (CCD) detector was used to capture the reflectance image and, by means of a beamsplitter, a second CCD detector was used to capture, simultaneously, an associated color image. Eight spectral images were obtained in total by multiplexing the light emitting diode banks. A polarizing filter was used to reduce the noise introduced by specular reflections. The system calibration process was performed using a green and white ceramic tile specific to the unit. Each data capture session for each patient was preceded by a calibration of the camera. The resulting reflectance image for each wavelength was calculated as follows: Here, represents the raw image of the object and represents the raw image of the white ceramic tile (reference measurement) as captured by the CCD at a given wavelength. is the reflectance spectrum of the white ceramic tile as specified by the manufacturer. Once calibrated, the reflectance measurement was composed of eight images, each with a resolution of , and a color image with a resolution of . All images were automatically aligned by the system. 2.3.Image ProcessingAn example of the images obtained at the wavelengths specified is shown in Fig. 2 . An example of a typical reflectance spectrum from the papillary tip is also shown. Note that the reflection is higher for longer wavelengths, which gives the gingiva its pink or red appearance. Fig. 2Example of multispectral images obtained from gingiva at the wavelengths indicated. The bottom plot shows an example of a typical reflectance spectra obtained from the papillary tip region (see Fig. 4); mean values shown with error bars representing the standard deviation. 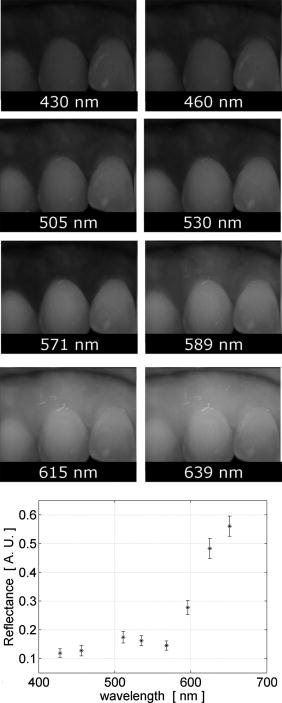 Fig. 4Regions of interest highlighted in white. Within every image, each papilla has its own reference (left and right papilla reference). The average of values of enclosed by the reference region is used as a normalization factor. Mean values of enclosed by the papillary tip and gingival margin regions are then calculated for every papilla and used for the analysis.  The spectral absorption coefficient of oxyHb and deoxyHb is shown in Fig. 3 . Two wavelength bands are illustrated, the first one from (band A) and the second one from (band B). An inversion crossover of the absorption coefficient values for oxyHb and deoxyHb is clearly observed within these bands, i.e., the absorption by oxyHb is greater than the one by deoxyHb within band A, and the opposite happens within band B. It is therefore accepted that a selection of one wavelength within each of these bands would maximize the difference between oxyHb and deoxyHb reflectance.10 From the multispectral imaging system described in the previous section, we have chosen 460 and as they fall within bands A and B, respectively. We expect that comparing reflectance at these wavelengths would provide an insight to the blood content in the tissue; this is done defining the spectral ratio as: Fig. 3Blood absorption coefficient for fully oxygenated (—), 50% oxygenated (--), and fully deoxygenated (:) blood.6 Absorption coefficient for the oxygenated blood is higher than deoxygenated blood within Band A and the opposite is true within Band B; hence an absorption crossover is defined. 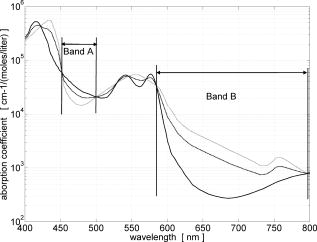 Here represents the reflectance at wavelength . As can be seen from the blood spectral absorption coefficient shown in Fig. 3, would increase as the blood oxygenation raises, since the reflectance at would increase (or the absorption reduce) and the reflectance at would reduce (or the absorption increase). However, scattering also plays an important role in characterizing the diffused reflection, in particular, scattering by erythrocytes will increase with blood concentration. Therefore, will include a combined effect of blood absorption and scattering. Note, however, that without an independent measure of the microvascular blood oxygenation or concentration, it is complicated to associate the variations observed to a specific blood parameter. Every image was processed using Matlab (Mathworks, Natick, Massachusetts), as described next. In the first step, we identified the gingival margin in the color image by using a least-square distance calculation algorithm.20 Briefly, for each color image, we have selected and obtained the RGB average values and covariance from a small section of the gingiva and from a small section of the tooth. These values were used to create two classes: gingiva and tooth. The mean square distance from each pixel to both classes was then calculated based on the following equation: Here is the distance to class from pixel , is the RGB pixel value, and contains the RGB values from the section defined as the class . Also, is the mean and is the covariance of the RGB values from the class . Every pixel in the image was attributed to the class they held the minimum distance to. In this case, the algorithm decided either the pixel in the color image belonged to the gingiva or not; this resulted in a binary image. Edge detection was applied to find the line contour corresponding to the gingival margin. An algorithm to extract the line contour coordinates was used to allow for a manual fine adjustment through a graphic interface. This adjustment was made by superimposing the calculated line to any of the data (spectral) images; however, the coordinate values were downscaled by a factor of 0.25 to fit this (lower resolution) image. The region of interest was selected by enclosing only the papilla region, as shown in Fig. 4 . Here the resolution of the color image was resized by a factor of 0.25 to ensure superimposing the inflammation maps to the correct gingival morphology. Note that both papillae shown in each image were considered for the analysis. The spectral ratio was calculated for each measurement by using Eq. 2. An automated computer algorithm was used to create subregions as the ones shown in Fig. 4 to interrogate different sites within the papilla region. Variations from patient to patient due to instrumental errors (e.g., camera angulation and illumination) and to differences in melanin absorption were accounted for by calculating the mean value of in the subregion labeled as “reference;” this value was used as a normalization factor for each papilla. This is a reasonable approach, assuming that the main inflammatory changes within the papilla will be happening at the gingival margin and at the papillary tip at early stages. The normalized spectral ratio is therefore defined as: Here, is the spectral ratio of the papilla and is the spectral ratio average from the papilla reference subregion. The resulting image would be obtained by superimposing the from both papillae onto the corresponding (rescaled) color image (see Fig. 4). Note that each papilla was shown in two images, e.g., the mesial papilla of the right central incisor (image 1) is also imaged as the mesial papilla of the left central incisor (image 2). In addition, every image was duplicated, and therefore four images from each papilla were available for analysis. The average of each region of interest in each image was calculated, and the mean of the four scores was used in statistical analysis. 3.Results3.1.Inflammation MapsIn this section, we present quantitative erythema maps based on calculations of , as discussed in the previous section. Results are shown for patients with induced gingivitis using the methodology described before. Figures 5 and 6 show examples of the inflammation maps obtained for the control and experimental groups, respectively. It can be seen that the control case undergoes little change during the course of the study compared to the experimental one. Note that the erythema can be clearly seen on the gingival margin and the papillary tip at the second week of no brushing for the latter case. In addition, the recovery process taking place at the rebound stage can also be seen in the experimental case; here values tend to return to their baselines. Fig. 5Example of inflammation maps obtained for a subject in the control group. Top to bottom: baseline, , and rebound stages. Left images show the superimposition of the maps over the original color image. Right images show the corresponding color image. The color scale represents the values obtained for . (Color online only.)  Fig. 6Example of inflammation maps obtained for a subject in the experimental group. Top to bottom: baseline, , and rebound stages. Left images show the superimposition of the maps over the original color image. Right images show the corresponding color image. The color scale represents the values obtained for . (Color online only.) 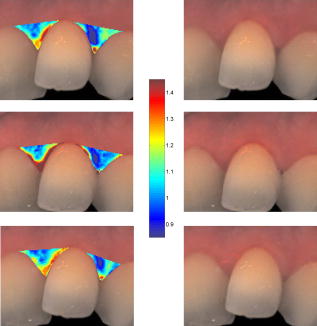 3.2.Statistical AnalysisAnalysis of the statistical changes observed in the papillary tip and gingival margin for all sites and all patients are presented in this section. These sites are selected since they represent the regions in which major changes are observed during the inflammation process. Comparison of these results with the gingival indices is also presented. Mean values of enclosed by the regions of interest (papilla tip and gingival margin) were obtained for each papilla. As discussed before, four images were available for each papilla, and the mean values obtained from them were averaged together. Three scores were therefore associated to each patient at each stage of the study; these were the overall average obtained from the ten papillae imaged for 1. for the papillary tip, 2. for the gingival margin, and 3. the gingival index (GI). The measurement comparisons are made at a subject level due to the lack of independence existing among the papillae from the same patient. The range of values obtained in our study for “GI, : papillary.tip and : gingival.margin” are shown for reference in Fig. 7 . Note, however, we are commonly interested in the change observed at two instances of time on the same patient in longitudinal studies. Fig. 7Histogram of the data obtained from our experiment for GI, : papillary.tip and : gingival.margin showing their corresponding range of values. Note that values are discrete for the GI but continuous for .  Figure 8 shows the time profile of the gingival index for all patients in the control, experimental, and stopped groups. Similar trends are presented for the from the papillary tip and the gingival margin in Figs. 9 and 10 , respectively. Note that values are shown as changes with respect to baseline, and (for papillary tip and ginvival margin). This allows a comparison of the changes observed in time within the three scores independently from their individual magnitudes. The score for week 2 therefore becomes coincident at zero value for all patients. Fig. 8Time progression of the gingival index (GI) score with respect to the baseline stage. is calculated as . The average is made for the ten sites imaged over all subjects within the control group (ten subjects), the experimental group (six subjects), and the stopped group (four subjects).  Fig. 9Time progression of the normalized spectral ratio , obtained for the papillary tip with respect to the baseline stage. is calculated as . The average is made for the ten sites imaged over all subjects within the control group (ten subjects), the experimental group (six subjects), and the stopped group (four subjects). 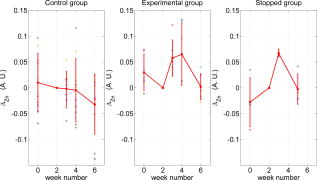 Fig. 10Time progression of the normalized spectral ratio obtained for the gingival margin with respect to the baseline stage. is calculated as . The average is made for the ten sites imaged over all subjects within the control group (ten subjects), the experimental group (six subjects), and the stopped group (four subjects).  Linear regression analysis has been employed as a statistical method to compare changes observed in the second week (visit 4) with respect to their corresponding baseline (visit 2). The group and the value at baseline were taken as the independent variables, whereas the value at the second week was taken as the dependent variable. Since the stage with maximum inflammation in the stopped group corresponds to the first week (visit 3), data were combined for this analysis with the one obtained in the second week (visit 4) in the experimental group. A significant difference between the control and the combined groups is observed for the three variables of interest. A paired-samples t-test was also performed for the second week (visit 4) and baseline (visit 2). As expected, the difference between baseline and second week in all three variables was nonsignificant for the control group. A significant difference of 0.51, 0.65, and 0.56 for GI, : papillary.tip and : gingival.margin, respectively, was found for the combined group. This indicates that the variables are able to statistically separate the healthy from the inflamed cases. Other methods for calculating an erythema index have been introduced in the past for single-point measurements. For instance, the method proposed by Dawson 21 employs five wavelengths in the range from , and in particular, the ones corresponding to the absorption peaks of oxyHb to estimate the area under the inverse logarithm of the reflectance spectrum curve. However, none of the wavelengths we have used in our experiments corresponded to an absorption peak of oxyHb, and we cannot therefore contrast the performance of with this method. Another algorithm was reported by Diffey, Oliver, and Farr22 using the ratio of the diffuse reflection intensity at a red and green wavelength as a method to quantify erythema. We have employed this last algorithm using the ratio for comparison with . Linear regression analysis revealed no statistically significant group separation using ; however, for the corresponding normalized spectral ratio calculated as in Eq. 4, a significant difference between control and combined groups for both papilla tip and gingival margin was found. Paired-samples t-test for the second week (visit 4) and baseline (visit 2) was also performed for these parameters. The difference between baseline and second week was nonsignificant for any group (control and combined) using . As expected, this was also the case for the control group using . A significant difference of 0.63 and 0.44 for : papillary.tip and : gingival.margin, respectively, was found for for the combined group. The ratios GI(second.week)/GI(baseline) and were defined for all patients within the three groups to compare the relationship between the average clinical score (GI) and the average value for from the gingival margin ( : gingival.margin). Note that values obtained for the stopped group at the first week (visit 3) were translated to the second week (visit 4) for this calculation. A significant Pearson correlation coefficient of 0.50 was found. Moreover, a significant Pearson correlation coefficient of 0.52 was also found using . Not surprisingly, a significant Pearson correlation of 0.95 was found between and showing their equivalent utility. Both methods appear to work equally well, but further validation would be needed to optimize the wavelength selection for a best performance. 4.Discussion and ConclusionsMicrovascular functional changes in terms of blood concentration, oxygenation, and flow during the inflammation process have been investigated in the past. A longitudinal study with dogs revealed that the main changes in blood concentration and oxygenation would appear within the first week of induced gingivitis.4 Relative total, oxygenated and deoxygenated hemoglobin concentrations raised while the oxygenation level reduced during inflammation. These same observations were later reported by the same group in a cross sectional study on humans looking at healthy and moderately inflamed cases.23 It was also observed that for healthy cases, the alveolar mucosa had a lower oxygenation but a higher total hemoglobin concentration than other gingival tissues (interdental papilla, attached and free gingival). Pre-and post-treatment observations of these parameters have been also reported,5 yielding similar trends when comparing initial inflammation and post-treated clinically healthy gingiva. It is important to clarify that the measurements are called “relative” oxyHb, since they are given in relative units and are only based on changes in light absorption; some authors refer to this type of measurement as “apparent” oxyHb.18 Gingival blood flow has also been investigated. A longitudinal study with dogs showed that blood flow increases slightly with inflammation, but there is no significant decrease of it with resolution of inflammation.24 Kervonbundit 2 recently reported a cross sectional study on humans showing significantly higher blood flow for cases with moderate gingivitis than for healthy ones. It has also been reported that the alveolar mucosa in healthy humans has a higher blood flow than other gingival tissues.2, 25 Previous studies have demonstrated that diffuse spectroscopy can be used in assessing the degree of erythema and edema when relating them to the light absorbed by particular skin chromophores. It has been found that erythema correlates well with the relative concentration of oxyHb,26 whereas edema has been found to correlate well with relative water concentration.18 Melanin, however, was not found to change with inflammation.18 In addition, it was shown that the relative deoxyHb concentration correlated well with blood stasis.27 Although these are findings obtained for skin, gingival tissue has a similar structure, consisting of an external layer, the epithelium with an underlying layer, and the connective tissue, where most of the microvasculature is embedded; moreover, melanocytes are situated in the basal layer of the epithelium and are responsible for the production of the melanin, which gives to the gingiva its natural pigmentation28 (see example in Fig. 11 ). Differences between the two tissues also exist: gingiva is keratonized at a lesser degree than skin, and has neither hair nor sweat glands but minor salivary glands. Fig. 11Natural gingival pigmentation. Two images shown for comparison; pigmentation is higher in the top case.  It is known that the redness observed in inflamed skin is caused by the blue-green absorption of hemoglobin.26 In this study, we propose and demonstrate a quantitative method based on diffuse spectral imaging to map the gingival erythema reaction resulting from the inflammatory processes. In agreement with previous observations,4, 21, 22, 23 the blood content described by the normalized spectral ratio described in Eq. 4 increases as the inflammation becomes moderate. This could explain the redness that is clinically observed in inflamed tissues. A statistically significant difference is found between patients subjected to an induced gingivitis and patients allowed to keep normal oral hygiene when comparing the baseline (healthy) and second week (moderately inflamed) stages. In fact, in agreement with reported findings, larger changes seem to occur within the first week (visit 3 of the study) of induced gingivitis for the experimental group and for the stopped group. This can be seen in Figs. 9 and 10. In addition, we find that there is no significant difference between groups when looking at the second week stage (visit 4) and the reboud stage (visit 5). This may suggest that the recovery is not fully accomplish within a two-week period. Similar views about recovery were also discussed in the past when evaluating the microcirculation and structural changes associated with inflammation.24, 29 The gingival index was used as a clinical indicator.19 Significant correlation suggests that the normalized spectral ratio could be used as a quantitative and objective indicator of clinical inflammation. We believe that the large variance observed in the data shown in Figs. 8, 9, 10 might be due to a lack of compliance by the volunteers during the clinical trial, e.g., some patients from the experimental group might have brushed their teeth during the two-week nonbrushing period. It is also possible that some patients have a greater resistance to bacterial invasion, and therefore their inflammation response can be less marked than other patients. This would have an effect in both the GI and scores. Our method utilizes the average values obtained from a neighboring reference area within the papilla as a normalization factor. A similar idea has been also reported by Stamatas, Southall, and Kollias,16 where they used the apparent concentration of oxyHb from the neighboring uninvolved skin to calibrate the measurement. Single-point measurements are highly site dependent due to the heterogeneity of the skin microcirculation. The probe size and its positioning can also influence the measurements, in particular when pressurizing the sensed tissue. A touch detector has been used in the past to capture the measurement before causing any expulsion of the blood upon pression.23 However, cross-contamination is also an issue when probes come into contact with the skin. Imaging techniques overcome these disadvantages and provide additional information with respect to the spatial distribution of the variables measured. The opportunity for noninvasive digital measurement in the assessment of gingival health is desirable, since it includes reproducibility of the datasets, analysis across more than one study of similar design, and elimination of bias from observers. In addition, the technique presented allows for near real-time data to be generated, and features portability, which allows the gathering of data from subjects in a rapid manner. Most of the spectral image analysis reported involves lengthy procedures by fitting curves pixel by pixel and therefore are unsuitable for real-time measurements. Kobayashi 30 used Monte Carlo simulations in combination with a mean free path length model of photons based on an initial set of spectral reference images to obtain a subject calibration matrix. This matrix was then employed to measure subsequent changes in the concentration of skin absorbers for the same subject in a faster manner. We present an alternative method based on a spectral ratio method where only two wavelengths are employed to perform the calculations. This results in a simpler and faster algorithm. The method proposed can only be employed for continual monitoring, since it requires a reference measurement (baseline) to be determined prior to any assessment of the gingival health. However, its ability to discriminate between groups possibly indicates that sensitive measurements can be obtained to evaluate when patients are improving, and can therefore serve to assess the response to treatment and, in particular, to discriminate the performance of different dental products during clinical trials. Moreover, it can also be used as a visual motivation tool for patients in dental practices to illustrate where they have to improve their dental hygiene. This method is objective, allows for permanent recording of changes in inflammation, maps the spatial distribution of the change, and therefore allows one to explore where the inflammation is taking place. We believe that these investigations could contribute to the development of functional imaging methods for periodontal disease screening and monitoring. AcknowledgmentsWe acknowledge Andrew Taylor for useful discussions on image processing methods and for sorting the data filing structure. We are also grateful to Peter Ellwood for helping with the manual fine adjustment of the gingival contour coordinates. Pretty is supported by a Clinician Scientist Award from the National Institute of Health Research, United Kingdom. Hamlin acknowledges support by Kathleen Phelan Williams, RDH, and the staff of CDE. The clinical study was funded by Colgate Palmolive Dental Health Unit, United Kingdom. ReferencesB. M. Eley and
S. W. Cox,
“Advances in periodontal diagnosis 1. traditional clinical methods of diagnosis,”
Br. Dent. J., 184 12
–16
(1998). 0007-0610 Google Scholar
V. Kerdvongbundit,
M. Sirirat,
A. Sirikulsathean,
J. Kasetsuwan, and
A. Hasegawa,
“Blood flow and human periodontal status,”
Odontol., 90 52
–56
(2002). Google Scholar
V. Kerdvongbundit,
N. Vongsavan,
A. Soo-Ampon, and
S. Hasegawa,
“Microcirculation and micromorphology of healthy and inflamed gingivae,”
Odontol., 91 19
–25
(2003). Google Scholar
T. Hanioka,
S. Shizukuishi,
A. Tsunemitsu,
S. Joh,
K. Sugiyama, and
N. Sato,
“Haemoglobin concentration and oxygen saturation in dog gingiva with experimentally induced periodontitis,”
Arch. Oral Biol., 34 657
–663
(1989). 0003-9969 Google Scholar
T. Hanioka,
S. Shizukuishi, and
A. Tsunemitsu,
“Changes in hemoglobin concentration and oxygen saturation in human gingiva with decreasing inflammation,”
J. Clin. Chem. Clin. Biochem., 62 366
–369
(1991). 0340-076X Google Scholar
S. Prahl,
“Optical absorption of hemoglobin (data compilation),”
http://omlc.ogi.edu/spectra/hemoglobin/index.html[1] Google Scholar
L. Douven and
G. Lucassen,
“Retrieval of optical properties of skin from measurement and modeling the diffuse reflectance,”
Proc. SPIE, 3914 312
–23
(2000). https://doi.org/10.1117/12.388058 0277-786X Google Scholar
G. Zonios and
A. Dimou,
“Modeling diffuse reflectance from semi-infinite turbid media: application to the study of skin optical properties,”
Opt. Express, 14
(19), 8661
–8674
(2006). https://doi.org/10.1364/OE.14.008661 1094-4087 Google Scholar
A. A. Stratonnikov and
V. B. Loschenov,
“Evaluation of blood oxygen saturation in vivo from diffuse reflectance spectra,”
J. Biomed. Opt., 6
(4), 457
–467
(2001). https://doi.org/10.1117/1.1411979 1083-3668 Google Scholar
P. Mannheimer,
J. Cascini,
M. Fein, and
S. Nierlich,
“Wavelength selection for low-saturation pulse oximetry,”
IEEE Trans. Biomed. Eng., 44 148
–58
(1997). https://doi.org/10.1109/10.554761 0018-9294 Google Scholar
J. E. Sinex,
“Pulse oximetry: principles and limitations,”
Am. J. Emerg. Med., 17 59
–67
(1999). 0735-6757 Google Scholar
P. Kyriacou,
“Pulse oximetry in the oesophagus,”
Physiol. Meas, 27 1
–35
(2006). 0967-3334 Google Scholar
N. Subhash,
J. Mallia,
S. Thomas,
A. Mathews,
P. Sebastian, and
J. Madhavan,
“Oral cancer detection using diffuse reflectance spectral ratio r540/r575 of oxygenated hemoglobin bands,”
J. Biomed. Opt., 11 14018
(2006). 1083-3668 Google Scholar
M. Attas,
M. Hewko,
J. Payette,
T. Posthumus,
M. Sowa, and
H. Mantsch,
“Visualization of cutaneous hemoglobin oxygenation and skin hydration using near-infrared spectroscopic imaging,”
Skin Res. Technol., 7 238
–245
(2001). 0909-752X Google Scholar
F. A. Kruse,
A. B. Lefkoff,
J. W. Boardman,
K. B. Heidebrecht,
A. T. Shapiro,
P. J. Barloon, and
A. F. H. Goetz,
“The spectral image processing system (sips)-interactive visualization and analysis of imaging spectrometer data,”
AIP Conf. Proc., 283 192
–201
(1993). 0094-243X Google Scholar
G. N. Stamatas,
M. Southall, and
N. Kollias,
“In vivo monitoring of cutaneous edema using spectral imaging in the visible and near infrared,”
J. Invest. Dermatol., 126 1753
–1760
(2006). https://doi.org/10.1038/sj.jid.5700329 0022-202X Google Scholar
G. Stamatas,
C. Balas, and
N. Kollias,
“Hyperspectral image acquisition and analysis of skin,”
Proc. SPIE, 4959 77
–82
(2003). https://doi.org/10.1117/12.479491 0277-786X Google Scholar
G. N. Stamatas and
N. Kollias,
“In vivo documentation of cutaneous inflammation using spectral imaging,”
J. Biomed. Opt., 12 051603
(2007). https://doi.org/10.1117/1.2798704 1083-3668 Google Scholar
H. Löe and
J. Silness,
“Periodontal disease in pregnancy i. prevalence and severity,”
Acta Odontol. Scand., 21 533
–551
(1963). 0001-6357 Google Scholar
P. A. Sagel,
P. G. Lapujade,
J. M. Miller, and
R. J. Sunberg,
“Objective quantification of plaque using digital image analysis,”
Monogr. Oral Sci., 17 130
–143
(2000). 0077-0892 Google Scholar
J. B. Dawson,
D. J. Barker,
D. J. Ellis,
J. A. Cotterill,
E. Grassam,
G. W. Fisher, and
J. W. Feather,
“A theoretical and experimental study of light absorption and scattering by in vivo skin,”
Phys. Med. Biol., 25
(4), 695
–709
(1980). https://doi.org/10.1088/0031-9155/25/4/008 0031-9155 Google Scholar
B. L. Diffey,
R. J. Oliver, and
P. M. Farr,
“A portable instrument for quantifying erythema induced by ultraviolet radiation.,”
Br. J. Dermatol., 111 663
–672
(1984). 0007-0963 Google Scholar
T. Hanioka,
S. Shizukuishi, and
A. Tsunemitsu,
“Hemoglobin concentration and oxygen saturation of clinically healthy and inflamed gingiva in human subjects,”
J. Periodontal Res., 25 93
–98
(1990). 0022-3484 Google Scholar
D. A. Baab and
P. A. Öberg,
“Laser doppler measurement of gingival blood flow in dogs with increasing and decreasing inflammation,”
Arch. Oral Biol., 32 551
–555
(1987). 0003-9969 Google Scholar
D. A. Baab,
A. P. Öberg, and
A. Holloway,
“Gingival blood flow measured with a laser doppler flowmeter,”
J. Periodontal Res., 21 73
–85
(1986). 0022-3484 Google Scholar
N. Kollias,
R. Gillies,
J. A. Muccini,
R. K. Uyeyama,
S. B. Phillips, and
L. A. Drake,
“A single parameter, oxygenated hemoglobin, can be used to quantify experimental irritant-induced inflammation,”
J. Invest. Dermatol., 104 421
–424
(1995). https://doi.org/10.1111/1523-1747.ep12666001 0022-202X Google Scholar
G. Stamatas and
N. Kollias,
“Blood stasis contributions to the perception of skin pigmentation,”
J. Biomed. Opt., 9
(2), 315
–322
(2004). https://doi.org/10.1117/1.1647545 1083-3668 Google Scholar
A. Nanci, Ten Cate’s Oral Histology: Development, Structure, and Function, 6th ed.Mosby, (2003). Google Scholar
J. Hock and
K. Niki,
“A vital microscopy study of the morphology of normal and inflamed gingiva,”
J. Periodontal Res., 6 81
–88
(1971). 0022-3484 Google Scholar
M. Kobayashi,
Y. Ito,
N. Sakauchi,
I. Oda,
I. Konishi, and
Y. Tsunazawa,
“Analysis of nonlinear relation for skin hemoglobin imaging,”
Opt. Express, 9
(13), 802
–812
(2001). 1094-4087 Google Scholar
|


