
|
|
1.IntroductionOptical coherence tomography (OCT) is a high-resolution tomographic imaging technique that uses interference of light from a low coherence source to select reflections from a specific depth inside the imaged object.1 The maximum OCT penetration depth depends on the absorption characteristics of the target object, while the depth resolution of an OCT system is determined by the coherent length of the light source used. Using broad bandwidth sources, such as superluminescent diodes, micrometer axial resolution at scanning depths of a few millimeters can be achieved. OCT imaging is common in the field of clinical ophthalmology, where it is used for noninvasive investigations of the eye. The anterior cornea surface is one of the major contributors to the refractive power of the eye, and the subject of most vision correction procedures. Because the effect of the cornea on vision is mostly determined by its shape, being able to precisely measure and characterize this shape is very important. As a result, different technologies were developed for measuring the cornea surface topography, including OCT.2 OCT can be used to visualize the cornea shape information, using either B-scans or C-scans.3 To obtain a complete three-dimensional (3-D) characterization of the cornea shape, multiple scans are required. Because the acquisition time of a C-scan is of the order of a second,4 this type of measurement is lengthy and therefore affected by saccades, involuntary movements of the eye during the measurement. Spectral domain OCT has been recently demonstrated at much higher scan rates; however, this type of imaging can only produce B-scan images.5 Several such B-scans6 are required to detect polar variations of the cornea shape. Saccadic eye movements during the in vivo measurement will also affect this type of measurement. We have been exploring the possibility of reducing the total amount of time required for measurement of the cornea shape by taking multiple transversal OCT scans at different depths at the same time. Multiple axial scanning depths are selected at the same time from the volume of any object by employing a reference path composed of multiple optical path lengths. This is achieved by introduction of a multiple delay element (MDE) in the OCT reference arm. An MDE constructed from stacked thin microscope glass slides was used in our research OCT setup. We will refer to an MDE-equipped OCT system as an MDE-OCT. An MDE-OCT C-scan image is obtained in the same amount of time normally required to obtain a single C-scan, yet it contains the information needed to determine the 3-D corneal shape. Because the measurement time is reduced in comparison to either scanning at multiple depths in case of a C-scan–based OCT system or at different polar orientation in case of a B-scan–based OCT system, the result is less affected by eye movement. Using this method, the axial position or the radius of a spherical object can be measured.7, 8 A novel cornea topography measurement method is proposed, obtaining 3-D coordinates of points on the anterior cornea surface, from which the complete surface can be evaluated. An MDE-OCT system can be numerically calibrated by analyzing images of a reflective sphere of known size. Once calibrated, the system can be used to acquire C-scan images and extract object shape information from these images. In this study, we specifically consider the method for measuring the in vivo anterior cornea surface. In this case, an acquired multiple contours C-scan is measured and analyzed by a computer program, identifying cornea surface locations at specific axial distances, which can be used to produce a 3-D cornea topography data set. 2.MDE En Face OCT SystemThe optical setup of an OCT system consists of an interferometer equipped with a low coherent light source, usually in the Michelson configuration. The source light beam is split into a reference and a sample arm. The sample arm contains the target object which generates a reflected beam, which is superposed to the reference arm beam to generate interference on a photodetector. Because of the short coherent length of the source, an interference pattern will be generated only when the optical path lengths of the reference and sample arms are matched within the coherence length of the optical source used. By changing the reference arm path length, reflections from a specific optical depth within the sample object can be selected, where the signal interference amplitude generates the image. As long as the sample material traversed by the beam is sufficiently transparent for the light wavelength used, the brightness of the interference pattern will be proportional to the square root of the reflectivity of the sample object at the selected depth and not be affected by the sample composition at any other depths. If the reference path beam is the sum of a number of discrete optical delays, multiple regions of coherence will be selected, each one corresponding to a different optical depth in the target object. The schematic diagram of the en face MDE-OCT setup used is shown in Fig. 1 . The system employs a two-coupler configuration, and the source is a superluminescent diode sending of optical power toward the cornea. The depth resolution of the system is in air. A low numerical aperture system is used by employing an achromat lens of focal length between the scanning block and the cornea. Fig. 1Diagram of the multiple delay OCT system. SLD: superluminescent diode; DC1, DC2: single-mode directional couplers; L: lenses; M: mirrors; MDE: multiple delay element with three layers, which introduces four reference paths; TS: translation stage; and O: object to be measured. 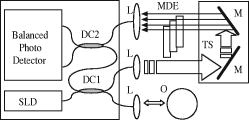 A galvanometric optical scanner pair is used to transversally scan the beam across the target in the transverse plane . The scanner was driven at and the scanner at . The axial position of the scan is controlled by moving the reference mirror, which is mounted on a precision translation stage TS. The reference beam intersects the MDE, which generates multiple optical path delays. A C-scan image obtained from such a system is the superposition of the C-scan OCT images, which could be obtained for each and every optical path in the reference arm. Because an en-face OCT setup can be used to produce B scans from a sequence of T scans,9 by keeping one of the or scanners fixed and sweeping the reference arm length, it is also possible to use an MDE-OCT to generate a multiple delay element B-scan image. Figure 2 illustrates this concept, showing the aspect of B and C scans obtained from the top of a reflective sphere with a four-delay MDE-OCT. A longer reference path will select a deeper region within the sphere, generating a higher copy of the circular profile in the B scan or a larger circle in the corresponding C scan. B scans are not used in our study because a they contain multiple representations of the same contour, in the same polar orientation. Our focus will be to employ a C-scan OCT image to generate the cornea topography. 3.MDEThe MDE used for this experiment is a stack of glass microscope slides of uniform thickness, . The introduction of a glass layer with an index of refraction and a known thickness in the reference arm of the OCT interferometer changes the reference optical path length. This layer is optically denser than the surrounding medium, which is characterized by an index of refraction , therefore, is larger than , and the increase in optical path distance (OPD) caused by the introduction of this object in the beam path can be expressed as An equivalent change in reference arm OPD can be expressed as a movement of the translation stage (TS) in Fig. 1 by the distance , in which caseEquations 1, 2 allow the calculation of the equivalent translation of the reference mirror, which has the same effect as the introduction of a denser, transparent object in the reference arm, assuming the object is traversed by the light beam only once. In this case, we obtainFor our experimental MDE, the glass refraction index is 1.5, while the medium in the reference arm is air, with a refraction index of 1. The manufacturing specification for the thickness of each glass slide is with a tolerance of . For each glass plate intersected by the reference beam, the change in OPD can be calculated as , with an error of .We assembled MDEs made from either three or seven glass plates, positioned as shown in Fig. 3 . Each successive slide intersected by the reference beam has the effect of introducing an incremental delay in the optical path length, resulting in an additional en-face C-scan image. The MDE is placed so that the collimated light beam in the OCT interferometer reference arm is centered on point P. This placement results in equal fractions of the beam being intersected by glass with a thickness equal to a multiple of a single glass plate, from zero to the total number of glass plates. For example, in the case of a three–glass plate MDE, the reference arm beam is split into four components, each one traversing none, one, two, or three glass plates. Fig. 3Glass plate MDE assembled in the lab, three and seven glass versions. The reference arm light beam represented by the gray area is perpendicular to the paper plane, and it is centered on point P. 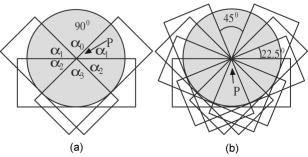 To obtain the same brightness in the final OCT image from each of the reference beam components, the areas of the reference beam that traverses a given number of glass layers have to be equal. For MDE constructed as shown in Fig. 3, assuming the beam profile at the intersection point is a disk centered in P, the area intersected by a region with a given number of glasses is proportional to the central angle of the respective region. For an MDE with glass layers, if represents the central angle for the region with overlapping glass layers, we can write Substituting for in Eqs. 4, 5, we find the central angle for the MDE with glass layers to be , which results in central angles of for the three-layer MDE and for a seven–glass layer MDE. The central angle for the region without any glass layers as well as for the one with glass layers is twice as large.4.Numerical CalibrationTo obtain numerical values from a C-scan MDE OCT images, a precise determination of the position of the circular contours is required, as well as an accurate transformation between pixel positions in the image and real length units in the object space. Images of a reflective sphere can be used to establish this correspondence. A four-delay MDE C scan of a sphere is shown in Fig. 2b. This contains circular contours of increasing radii for increasing axial scanning distance sampled by MDE from the top surface of the sphere. Considering a perfect sphere, the only parameter needed to describe it is its radius. This simplifies calculations and makes the placement of the sphere in the OCT field insensitive to any rotational alignment. A smooth, reflective metal sphere of radius was used for the calibration. To explore the mathematical basis for the numerical analysis of images of a sphere, a few notations are introduced, as shown in Fig. 4 . The circular contours in the MDE C-scan image are indexed starting from the largest diameter, which will be index zero. This contour corresponds to the reference OPD component most delayed by the MDE. The radius of the circle index in the C-scan MDE image will be denoted by . The OPD increase produced by a single glass plate in the reference arm is a constant ; the target sphere radius is . The distance between the center of the target sphere and the scanning depth of the undisturbed reference beam, controlled by the reference arm translation stage position will be denoted by . Fig. 4Geometrical relations on the calibration sphere, showing the geometrical relationships between , , and . 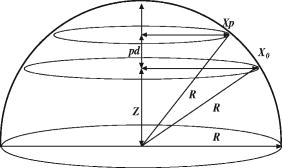 From Fig. 4, using the notations described above, the radius can be expressed as and the formula for radius isThis formula can be used to calculate the axial position from a given measured circle radius asor, equivalently, calculate the sphere radius , asThe existence of multiple circular contours in the same C-scan image allows a system of equations to be written and multiple parameters to be calculated from a single image. The axial reference position can be obtained from the measured radii of two circular contours. For any pair of distinct circles with indices and , where is the radius of the larger circle and is the radius of the smaller one, we can eliminate from the system of the two equations for written for each circle according to Eq. 8, obtaining a formula for the relative axial position of the spherical object of unknown radius,Equations 7 to 10 above use the values for in the object space. The MDE-OCT image can only be used to extract the values for the in the image space , in pixels, which can be expressed aswhere represents the C-scan image resolution in microns per pixel. Moreover, separate scanning and image acquisition mechanisms are used for each of the transversal axis, which can result in different image resolution for the horizontal and vertical axes. To allow for this, we introduced a scaling factor between the transversal resolution for the horizontal axis and for the vertical axis.As a first step in the calibration process, the accurate size and position of the circular contours in the C-scan image need to be determined. This can be performed by identifying the center of symmetry using the symmetry properties of the image, followed by identifying the peaks in the radial brightness profile measured from this center. Because the radial profile is calculated as the average brightness of all pixels equally distant from the center, the effect of the speckle noise is reduced, allowing for a high degree of accuracy. At this stage, we can also measure the scaling factor between the horizontal and vertical image resolution by optimizing the contrast in the radial brightness profile of the image for different values of . This contrast has the maximum value when the bright contours are perfect circles, which happens when the scaled vertical image resolution matches the horizontal one. For the OCT setup we used in this measurement, a scaling factor between the vertical and horizontal scale resulted in the best matches for the circular contours in our image set of a reflective sphere. With the contour radii values measured, a system of equations can be written using Eq. 7 with the substitution 11, one equation for every individual OPD. When using a known OPD step and a sphere of known radius , this system of equations can be used to determine the transversal OCT image resolution and the axial position . This algorithm was tested against simulated MDE-OCT images of a sphere like the one shown in Fig. 5a , and then used on real MDE-OCT images collected with the experimental setup, which produced the image shown in Fig 5b. Fig. 5(a) Simulated and (b) experimental C-scan OCT images of a metal sphere using a four-delay MDE.  On the basis of the real MDE-OCT images of the test sphere, we found that our OCT setup has a horizontal resolution of and, using the vertical scaling factor determined before, a vertical image resolution of . These results were consistent for a series of 10 images of the sphere taken at different axial positions as controlled by the TS, the standard deviation for the calculated axial positions of the sphere for a complete set of images being . 5.Cornea MeasurementThe setup described above, equipped with an MDE with seven glass layers was used to collect cornea images of a volunteer (AP). The intersection between the coherence gate surface and the cornea results in an en face section of the cornea, as thin as determined by the coherence length of the source. Such images show a closed contour, determined by the air-cornea interface with details of the tissue inside the cornea within the closed contour. Because of the MDE, several such en face OCT images are collected simultaneously, where the assembly of contours provides topography information and the information inside the contours is discarded. One such image is presented in Fig. 6a , in which the MDE OPD selects axial positions situated at the top of the subject cornea. As shown in Fig. 6b, only the contours index 4 to 8 can be identified accurately enough in this image and are used in the measurement, the lower index contours having significantly lower brightness due to the higher reflection angle. Fig. 6MDE OCT C-Scan image of the cornea of AP. From the analysis of the diameter and spacing of the circular contours in this image, the cornea cap radius is and the largest identified circular contour is located from the corneal apex. (a) Original image. (b) Four contours detected. 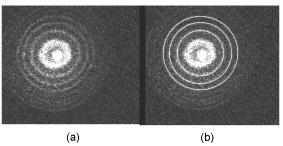 In this study, an MDE with a limited number of delays was used to sample the central part of the cornea only. Therefore, the axial sectioning does not reach the endothelium. In order to have a ring in the image due to the endothelium, the axial position of the MDE needs to cover more than from the cornea apex ( multiplied by the refraction index of the cornea). Such large values of axial positions are not necessary for the shape characterization of a central cornea region as large as in diameter. Endothelium contours will become visible only when contours are acquired from cornea periphery area. Therefore, two sets of rings, from the anterior and posterior cornea (i.e., from epithelium and endothelium, respectively) are not commonly obtained in an image at the same time. However, if the exploration in depth reaches the endothelium, then the image will contain two sets of contours: (i) large radius contours as determined by the epithelium and (ii) small radius contours as determined by the endothelium. If the number of MDE delays and their differential delay is such as not to cover the cornea thickness range, then the two sets can be easily identified. However, in this report, using up to seven delays and restricting the imaging to the top of the cornea, we have never intersected the endothelium. Using the calibration parameters obtained from the experiment with the reflective ball and the same basic algorithm, we can use Eqs. 9, 10 for the four detected circles to calculate the axial position and then the corneal cap radius. We obtained for this cornea an average horizontal cap curvature of and a vertical curvature of , corresponding to 43D horizontal and 45.75D vertical. The different curvature values for the vertical and horizontal meridians, representing “with the rule” astigmatism, was obtained from the difference between the known 0.97 vertical scaling of the OCT system and the 0.91 scaling between the horizontal and vertical axis found for this image. This is, of course, an approximation because it assumes that once the vertical and horizontal sizes are scaled correctly, the cornea cap radius is a constant. A different algorithm can be used to generate a complete corneal topography. As shown in Fig. 4, the axial position of every point on a given contour is a constant, being determined by a given OPD, and differs from the axial position of other contours by a multiple of the OPD step . For corneal topography measurement, the bright contours are no longer assumed to be perfectly circular. Instead, the transversal position of the brightness peaks is measured from a given image center along different meridians. These coordinates, together with the relative axial distance for the circular contour on which the point resides represent the full set of cylindrical coordinates . From all the points measured in this way, a continuous cornea surface can be generated using different forms of interpolation or surface fitting. Alternatively, the sample points can be used to calculate matching Zernike10 decomposition coefficients,11 and the cornea surface can be generated by the Zernike expansion based on these coefficients. Figure 7a shows a four-delay MDE C-scan image of a cornea. Figure 7b shows the cornea elevation map produced by reconstructing the surface from the Zernike coefficients, with the exception of the tilt , , and the defocus components. The Zernike coefficients for this cornea were calculated from the complete sample point set, using a minimum square fit followed by a Gaussian elimination method.12 Using the ANSI Z80.28–200413 ordering, we calculated the first 36 Zernike coefficients for this surface, the obtained values for coefficients 0 to 18 are presented in Fig. 8a , expressed in microns. These values were calculated for an aperture of , corresponding to the region covered by the circular contours. represents the vertical tilt, showing a slight down pitch of the cornea central axis compared with the OCT optical axis. is relatively large because it encapsulates most of the cornea shape curvature. The image in Figure 8b is a 3-D reconstruction of this cornea, using the Zernike expansion of the obtained coefficients. 6.Discussion and ConclusionThe MDE-OCT method for measuring corneal topography presented here is based on a very different principle than the currently used Placido ring method.14 In the Placido ring method, an image of the reflections of a light/dark pattern on the cornea tear film is analyzed, the result being a number of points where the meridional surface slope can be determined. To obtain the elevation and local curvature values, an iterative algorithm is used along each meridian, starting with the center of the cornea and progressing outward. This procedure is very sensitive to the precise axial and transversal alignment of the subject cornea, and depends on the lighting conditions and the existence of a good quality reflective corneal tear film. In contrast, the MDE OCT cornea topography measuring method described here generates direct cornea elevation measurements. The MDE-OCT method depends mostly on the reflectance between the air and the tear film or cornea epithelium and can be used to measure the cornea topography in cases where the corneal tear film quality is insufficient for the Placido ring–based method.13 Because an OCT system is scanning and self-illuminated, it is relatively immune to existing light conditions. As presented, the advantages of using this method over existing OCT cornea measurement methods are multifold. First, it uses a single C-scan image to obtain the 3-D shape of the anterior cornea. This in itself reduces the acquisition time over methods where repeated B scans or C scans need to be acquired. Second, the MDE method provides a mechanism to numerically calibrate the resolution of the images produced by the OCT system, allowing precise transversal measurements directly on the image. Lastly, the algorithm presented only depends on the peak position of the bright contours and not on the exact value of these peaks, making it relatively resistant to noise. In support of the first advantage mentioned above, let us refer to OCT methods which operate at higher frame rates than our system. Spectral domain (SD)-OCT has faster acquisition times than time domain (TD)-OCT but can only acquire A scans, which requires the acquisition of a complete 3-D data volume before the cornea shape can be assessed. For instance, let us consider an SD-OCT system,4, 15, 16 which, given its signal-to-noise advantage,17 can work at least 10 times faster than a TD-OCT system. This means that an SD-OCT system can acquire at least 10 B-scan images in the same time as our TD-OCT generates one C-scan frame. However, our C-scan images are made of -scan lines (i.e., to obtain the same transversal resolution in the en face section from 3-D reconstruction of a B-scan stack, at least 500 B scans would be required). A very fast swept source OCT system18 was reported that operates at . However, even at this high speed, the acquisition of the stack of OCT images takes , which is comparable to the frame rate of our system. In addition, we have used galvanometer scanners in the transverse scanning head. Resonant scanners19 or polygon mirrors20 have been reported in en face OCT, with line rates of 8 and , respectively, while potential for faster scan rates exists. A line scan rate of would deliver data 16 times faster than in our system. This can offset the speed advantage of the spectral OCT method even more. Another fast OCT technology reported for imaging of the cornea is full-field OCT. A system operating at a frame rate has been reported for in vivo imaging in the anterior segment of the rat eye.21 High transverse resolution images have been obtained using this technology. However, the high resolution achievable using the full-field method does not directly benefit a cornea topography application. Corneal topography is less demanding in terms of transversal resolution (a coarse sampling of over an -diam area may suffice22). Full-field OCT belongs to the same category of TD-OCT methods as that of the system we presented; however, its sensitivity is less than that of the flying spot en face OCT due to the limited dynamic range of the CCD camera. This may explain why no full-field OCT images of the in vivo human cornea have been reported. Potential drawbacks of the MDE-OCT cornea topography method also exist. The OCT speckle noise affects the accuracy of the measured position of the circular contours. We have addressed this in our algorithm by calculating the radial brightness as an average over a small arc around the selected center, thus improving the signal-to-noise ratio at the expense of reducing the number of independent points along a single contour. Although the sampling resolution achieved with our setup is currently inferior to the resolution quoted for commercial corneal topographer, improvements are being pursued. A higher density of contours can be used, in principle, as allowed by the coherence length of the source. Optical sources and dispersion compensated OCT systems, which can achieve a depth resolution are becoming available. Using such a source would allow a much smaller delay , which in turn would allow more delay steps to be used, resulting in an increase number of points where the cornea surface elevation can be measured. The MDE-OCT image quality is also affected by the reflections from below the cornea surface, such as opacities or even the posterior cornea surface. Artifacts generated by these reflections will corrupt the aspect of the circular contours on which the MDE-OCT cornea topography measurement is based. These reflections could be reduced by using infrared light of sufficiently long wavelength to encounter strong water absorption in the cornea tissue. This will also lead to attenuation of the contours from the endothelium, which may appear in the single-shot frame when measuring large and steeply curved corneas. It should also be noted that the brightness of the reflections on the cornea also depends on the angle of incidence of the beam, making reflections from locations that have a significant slope much dimmer than the ones closer to the cornea center. We are currently studying the expected accuracy of using this method for cornea topography, using synthetic cornea models described in Annex A of the ANSI Z80.23 Standard.22 In conclusion, we presented a novel method for obtaining quantitative 3-D data from a single en face OCT image, using a multiple delay element C-scan image. An MDE-OCT system can be accurately calibrated using a reflective sphere of a known radius. We have illustrated the calibration principle using a spherical metal object and applied the same principle to obtain the cornea curvature. Using a calibrated MDE-OCT system, 3-D coordinates for points on the cornea surface were generated, the Zernike decomposition was calculated and a corneal topography was generated from an MDE-OCT acquired image. We believe that with further developments, the method proposed could become as reliable as other methods currently in use for cornea topography.2 AcknowledgmentWe thank Marta Gomez for her contribution in assembling the MDEs and acquiring the MDE-OCT images. ReferencesD. Huang,
E. A. Swanson,
C. P. Lin,
J. S. Schuman,
W. G. Stinson,
W. Chang,
M. R. Hee,
T. Flotte,
K. Gregory,
C. A. Puliafito, and
J. G. Fujomoto,
“Optical coherence tomography,”
Science, 254 1178
–1181
(1991). https://doi.org/10.1126/science.1957169 0036-8075 Google Scholar
T. Swartz,
L. Marten, and
M. Wang,
“Measuring the cornea: The latest developments in corneal topography,”
Curr. Opin. Ophthalm., 18
(4), 325
–333
(2007). Google Scholar
A. Gh. Podoleanu,
G. M. Dobre,
D. J. Webb, and
D. A. Jackson,
“Coherence imaging by use of a newton rings sampling function,”
Opt. Lett., 21 1789
–1791
(1996). 0146-9592 Google Scholar
A. Gh. Podoleanu,
J. A. Rogers,
G. M. Dobre,
R. G. Cucu, and
D. A. Jackson,
“En-face OCT imaging of the anterior chamber,”
Proc. SPIE, 4619 240
–243
(2002). 0277-786X Google Scholar
B. J. Kaluzy,
J. J. Kaluzny,
A. Szkulmowska,
I. Gorczynska,
M. Szkulmowski,
T. Bajraszewski,
M. Wojtkowski, and
P. Targowski,
“Spectral optical coherence tomography—A novel technique for cornea imaging,”
Cornea, 25 960
–965
(2006). 0277-3740 Google Scholar
F. Graglia,
J.-L. Mari,
G. Baikoff, and
J. Sequeira,
“Cornea detection of the cornea from OCT radial images,”
5612
–5615
(2007). Google Scholar
L. Plesea,
M. Gomez, and
A. Gh. Podoleanu,
“Cornea Curvature Measurement Using Single Shot C-scan OCT,”
Proc. SPIE, 6429 64290Y
–1
(2007). 0277-786X Google Scholar
L. Plesea,
M. Gomez, and
A. Gh. Podoleanu,
“Keratometry and corneal topography using multiple delay element OCT,”
Proc. SPIE, 6847 684704
(2008). https://doi.org/10.1117/12.764376 0277-786X Google Scholar
C. C. Rosa,
J. Rogers,
J. Pedro,
R. B. Rosen, and
A. Gh. Podoleanu,
“Multi-scan time domain OCT for retina imaging,”
Appl. Opt., 46 1795
–1807
(2007). https://doi.org/10.1364/AO.46.001795 0003-6935 Google Scholar
D. Malacara and
Z. Malacara, Handbook of Optical Design, 175 2nd ed.Marcel Dekker, New York
(2004). Google Scholar
J. Schwiegerling,
E. Greivenkamp, and
J. M. Miller,
“Representation of videokeratoscopic height data with Zernike polynomials,”
J. Opt. Soc. Am. A, 12 2105
–2113
(1995). 0740-3232 Google Scholar
L. A. Carvalho,
“Accuracy of Zernike polynomials in characterizing optical aberrations and the corneal surface of the eye,”
Invest. Ophthalmol. Visual Sci., 46 1915
–1926
(2005). https://doi.org/10.1167/iovs.04-1222 0146-0404 Google Scholar
,
(2004) Google Scholar
D. Huang,
“Physics of customized corneal ablation,”
Wavefront Customized Visual Correction, 171
–180 Slack Inc., Thorofare, NJ
(2004). Google Scholar
M. Miura,
H. Mori,
T. Watanabe,
M. Usui,
K. Kawana,
T. Oshika,
T. Yatagai, and
Y. Yasuno,
“Three-dimensional optical coherence tomography of granular corneal dystrophy,”
Cornea, 26
(3), 373
–374
(2007). 0277-3740 Google Scholar
M. V. Sarunic,
S. Asrani, and
J. A. Izatt,
“Imaging the ocular anterior segment with real-time, full-range Fourier-Domain optical coherence tomography,”
Arch. Ophthalmol. (Chicago), 126
(4), 537
–542
(2008). 0003-9950 Google Scholar
J. F. de Boer,
B. Cense,
B. H. Park,
M. C. Pierce,
G. J. Tearney, and
B. E. Bouma,
“Improved signal-tonoise ratio in spectral-domain compared with time-domain optical coherence tomography,”
Opt. Lett., 28 2067
–2069
(2003). https://doi.org/10.1364/OL.28.002067 0146-9592 Google Scholar
R. Huber,
D. C. Adler,
V. G. Srinivasan, and
J. G. Fujimoto,
“Fourier domain mode locking at for ultra-high-speed optical coherence tomography of the human retina at 236,000 axial scans per second,”
Opt. Lett., 32 2049
–2051
(2007). https://doi.org/10.1364/OL.32.002049 0146-9592 Google Scholar
M. Pircher,
B. Baumann,
E. Gotzinger, and
C. K. Hitzenberger,
“Imaging the human retina and cone mosaic in vivo with PS-OCT,”
Proc. SPIE, 64290T T4290
–T4290
(2007). 0277-786X Google Scholar
L. Liu,
N. Chen, and
C. J. R. Sheppard,
“Double-reflection polygon mirror for high-speed optical coherence microscopy,”
Opt. Lett., 32
(24), 3528
–3530
(2007). https://doi.org/10.1364/OL.32.003528 0146-9592 Google Scholar
K. Grieve,
A. Dubois,
M. Simonutti,
M. Paques,
J. Sahel,
J.-F. Le Gargasson, and
C. Boccara,
“In vivo anterior segment imaging in the rat eye with high speed white light full-field optical coherence tomography,”
Opt. Express, 13 6286
–6295
(2005). https://doi.org/10.1364/OPEX.13.006286 1094-4087 Google Scholar
, for Ophtalmics—Corneal Topography Systems: Standard Terminology, Requirements,
(1999) Google Scholar
|


