|
|
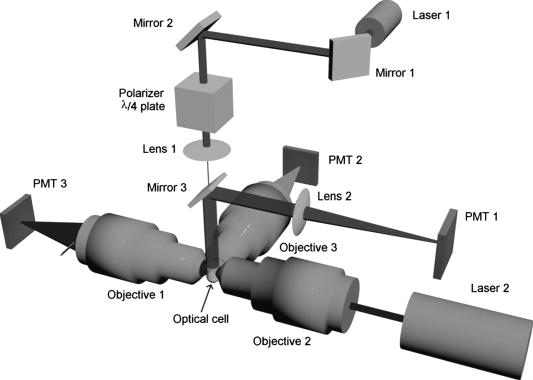
1.IntroductionGranulocytes are the most numerous type of leukocytes, and neutrophils constitute of granulocytes.1 The major role of neutrophils is to protect the host against infectious agents. To accomplish this task, the neutrophil must first sense infection, migrate to the site of the infecting organism, and then destroy the infectious agents.2 Many diseases have hematologic displays (i.e., some characteristics of blood cells, in particular neutrophils, fall outside the normal physiological limits).2 Therefore, blood analysis, including identification and characterization of neutrophils, may form a basic component of any diagnostics. Analysis of individual blood cells is currently performed mostly with flow cytometers,3 which allows simultaneous measurement of light scattering and fluorescence signals from single cells with a speed up to 30,000 cells per second.4 Ordinary flow cytometers measure only two light-scattering signals, so-called forward and side scattering. However, these are enough to discriminate neutrophils and eosinophils (less abundant subtype of granulocytes) from other leukocytes due to their larger values of both signals.5 To perform further discrimination between these two subtypes of granulocytes, labeled monoclonal antibodies to different cell receptors are commonly used. These receptors include CD45,5 CD16b, and CD49d.6 Flow cytometrical studies of neutrophil biology were reviewed by Carulli.7 These studies employ multiple fluorescent labels, up to 18 can be used simultaneously in modern flow cytometers.4 Measuring new light-scattering signals can provide additional information about cell morphology and simplify an analysis,8 although currently it is considered a less powerful technique than fluorescent labeling in biological and medical applications. One such signal, depolarized side scattering, was proposed by de Grooth 9 to discriminate eosinophils from neutrophils. That was actually implemented in cytometrical protocol, employing higher value of this signal of eosinophils.10, 11 Only recently, using extensive simulations of light scattering by a granulated sphere model, it was shown that this experimental fact can be explained by the difference in granule sizes between neutrophils and eosinophils.12 Angle dependence of light-scattering intensity [light-scattering pattern (LSP)] of an individual granulocyte was measured using an optical trap13 and a scanning flow cytometer (SFC).14 However, it was not specifically determined to which subtype of granulocytes analyzed cells belonged, and the result was shown in arbitrary intensity units. Another approach to study light scattering by neutrophils (or granulocytes) is through simulations. The finite difference time domain (FDTD) simulations of light scattering by a granulocyte model were performed in a number of manuscripts by Dunn and coworkers (summarized in Ref. 15), and the above-mentioned by Yurkin 12 employed the discrete dipole approximation (DDA). Neither of these directly compared simulation results to experimental data. The goal of this work is to bring together a modern experimental technique, SFC, and theoretical method, DDA, to show the potential of light scattering for characterization of neutrophils. We identified neutrophils in blood sample with help of monoclonal antibodies and measured their LSP in the range of scattering angles from . We determined their absolute differential cross sections and observed substantial differences in the measured set of LSPs for different donors. We developed an optical model of a neutrophil, including nuclei and granules, and simulated light scattering by this model with several different sets of parameters values. Comparison of simulated LSPs to experimental data showed good qualitative agreement. 2.Materials and Methods2.1.Sample PreparationWe used the ordinary immunofluorescence technique for cell extraction and staining with dye molecules adapted for flow cytometric analysis.16 Whole blood was taken from four donors by venopuncture into potassium salt of ethylenediamine tetraacetic acid. Lysing of red blood cells (RBCs) was performed adding of lysing solution (BD Biosciences, FACS lysing solution) to of blood and incubating it for in the dark. Two washing steps were performed to remove blood plasma and RBC debris, by centrifugation for at followed by supernatant removal. After the first step, the sediment was suspended in of buffered saline and shaken. After the second washing step, the sediment, containing leukocytes, was shaken and added to of antibodies (Immunotech, clone 3G8), which bind to CD16b, a receptor specific to neutrophils, and are labeled by fluorescein isothiocyanate (FITC).6 It is then incubated for in the dark, followed by a third washing step. Finally, the labeled leukocytes were suspended in buffered saline to a concentration . The analysis of a sample by SFC was performed for . All procedures were performed at room temperature . 2.2.Scanning Flow CytometerThe schematic layout of the SFC’s optical system is presented in Fig. 1 . A diode laser (Laser 1, LM-660-20-S, , ) was used for generation of the scattering pattern and the orthogonal laser (Laser 2, Uniphase 2214-12SLAB, , ) was used for excitation of fluorescence and for triggering the electronic unit. The beam of laser 1 was directed coaxially with the stream by a lens (lens 1, ) through a hole in the mirror (mirror 3). The Polarizer and plate provide a circular polarized incident beam. The hydrofocusing head (not shown) produces two concentric fluid streams: a sheath stream without particles and a probe stream that carries the analyzed particles. Two syringes controlled by step motors form the sample flow. The fluidics system directs a probe stream with a diameter into the optical cell (Fig. 1). Operational function of the optical cell was previously described in detail.8, 17 The light scattered by a single cell is reflected by mirror 3 to the photomultiplier tube [(PMT), PMT 1, Hammamatsu H9 305-04]. The beam of laser 2 is focused by objective 2 into the capillary of the optical cell. The light scattered in the forward direction is collected by objective 1 and detected by PMT 3 (Hammamatsu H9 305-04). The beam stop prevents illumination of PMT 3 by the incoming laser beam. The fluorescence of specific dye molecules linked at the single cell is collected by objective 3 and detected by PMT 2 (Hammamatsu H9 305-04). The bandpass optical filter provides measurement of the specific fluorescence with an appropriate signal-to-noise ratio. The current optical setup of the SFC (PMT 1 in Fig. 1) measures the following combination of the scattering matrix elements:18 where and are the elements of the matrix, and are the polar and azimuth scattering angles, respectively.Neutrophils are CD16b-positive cells (i.e., those cells that have pronounced fluorescence signals). The cells that belong to the granulocyte cluster but lack fluorescence (CD16b-negative granulocytes) are either eosinophils or basophiles. However, they may also contain a small portion of monocytes because of small overlap of the corresponding clusters on the forward versus side-scattering map.10 We used the radiation to excite the FITC molecules (maximum of absorption of ) and radiation to observe light scattering. Spectral separation of light scattering and fluorescence reduce an effect of the dye molecules absorption on light-scattering profiles of cells. The legand-receptor complexes form the monomolecular layer on the cellular membrane with a thickness , which allows us to ignore an enlargement of a size of cells covered by dye molecules. In each sample, we collected from 120 to 1500 LSPs of those cells, which had pronounced fluorescence signals. 2.3.Theoretical Methods2.3.1.Discrete dipole approximationThe DDA is a general method to compute scattering and absorption of electromagnetic waves by particles of arbitrary geometry and composition.19 The ADDA computer code is an efficient DDA implementation on a cluster of computers, parallelizing a single DDA computation. Recently, the overall performance of the code has been improved significantly, together with some optimizations specifically for the single-processor mode.20 The ADDA’s source code and documentation is freely available.21 Simulations of light scattering by the optical model of a neutrophil (see Section 3.1) were performed with ADDA v.0.76 using the built-in granule generator. For each particle, we computed the whole Mueller matrix for the full range of scattering angles with steps of 0.5 and in and , respectively. All simulations were run on the Dutch compute cluster LISA.22 Typical simulation time is on eight compute nodes per simulated neutrophil. The LSPs of optical model of neutrophils were evaluated in a form that corresponds to Eq. 1. 2.3.2.Spectral sizingTo determine the diameter of neutrophils, we used the spectral method.23 An experimental LSP is transformed with the standard Hanning window, and then its Fourier amplitude spectrum is calculated. The location of the last peak in this spectrum has a good linear correlation with the cell diameter, which was shown by extensive numerical simulations for spheres23 and concentric spheres.8 Using the proportionality coefficient determined from this numerical simulation, spectral sizing was empirically applied to erythrocytes,24 and leukocytes,14 producing meaningful results. However, it has never been verified for granulated cells. Therefore, size distributions obtained using this method should be considered as an estimate rather than a reference result. 3.Results and Discussion3.1.Neutrophil Optical ModelNeutrophils have a nonuniform structure and complex shape.2, 25 We use an optical model of a neutrophil consisting of a sphere filled by spheres of smaller diameter—the granules—and a nucleus in the form of four spheroids of the various sizes, which are randomly placed and oriented inside the cytoplasm (see Fig. 2 ). Then identical granules are randomly positioned inside the remaining cytoplasm. This model is an extension of a simpler model (without nucleus), which was recently used in theoretical study of light scattering by granulocytes.12 The numerical values of model parameters, given below, correspond to literature data on neutrophil morphology. However, these parameters have large biological variability, and we use only one or a few values for the current simulations. Nevertheless, as we show further these values do lead to meaningful results. Recently, distributions of diameters of granulocytes were determined microscopically for several donors.25 Bacause neutrophils constitute of granulocytes,26 we can assume that distributions of neutrophil diameters are very similar. Therefore, we set the diameter of the cell to , which also agrees with our own results using spectral sizing (Fig. 3 and Table 1 ). Granule diameters are , 0.15, and ,27, 28 and their volume fraction is .28, 29 The same as was used in the theoretical paper.12 Volume fraction of nuclei is ,25, 30 resulting in total volume fraction of noncytoplasm material, granules, and nucleus, equal to 0.2. Table 1Parameters of size distribution of neutrophils for four individuals.
Dunn collected information on refractive indices of the cell cytoplasm and constituents from several sources.15 However, the ranges are broad, which makes it hard to select a particular value. We set the cytoplasm refractive indices to , which corresponds to the values obtained by fitting experimental LSPs of lymphocytes by a multilayered sphere model.14, 31 Refractive indices of nuclei, reported in literature and used for theoretical simulations, are up to 1.50,15, 31, 32 while the upper limit for granule refractive index is equal to the refractive index of dried protein 1.58.15 We use a value in between those two, , as refractive index of both nuclei and granules to eliminate one free parameter of the model. The refractive index of the medium (buffered saline) is . This optical model of neutrophil has been used for calculation of The differential light-scattering cross section using the DDA (Section 2.3.1). 3.2.Differential Light-Scattering Cross Section of NeutrophilsThe essential feature of the SFC is the ability to measure the absolute differential light-scattering cross section of single particles of any form and structure. This feature is realized by measurement of a mixture of unknown particles and polymer microspheres. The LSP of the polymer microsphere, measured with the SFC, gives a perfect agreement with the Mie theory.33 This allows calibration in absolute light-scattering units. The differential cross section was calculated from the following equation: where is the signal from the SFC [Eq. 1], is the wavelength of the incident light, and is the refractive index of the surrounding medium.In order to determine the differential cross section for neutrophils we simultaneously analyzed blood leukocytes and polystyrene microspheres (Duke Scientific Corporation, 269C) with a size of . Sample preparation was carried out by the technique described above. The neutrophil LSPs were identified from specific fluorescent signal. Results of measurement of a sample from one individual are presented in Fig. 4 . Twenty LSPs of individual neutrophils and microspheres form two well-distinguishable sets of curves. We pulled out the LSP of a single microsphere to find the best-fit LSP calculated from the Mie theory. In order to take into account the experimental signal-to-noise ratio, the fitting procedure was applied for light-scattering traces. Actually, a LSP is a multiplication of a light-scattering trace with a normalizing coefficient of the SFC.8 The fitting result is shown in the inset in Fig. 4. Indeed, the experimental points are in a perfect agreement with the solid line that corresponds to a sphere with a size of and a refractive index of 1.580. The best-fit pattern provided the absolute units for vertical scale in Fig. 4. Differences in differential cross-sections of individual neutrophils are apparently caused by inherent biological variability (i.e., variations in size of cells and their internal structures). 3.3.Different Samples and Comparison to Numerical SimulationsDDA simulations were performed for six sets of the parameters presented in Table 2 . We varied both the diameter of granules and the angle , rotating the cell relative to the direction of the incident laser beam. Rotation is only one of the possible ways to vary internal composition of the model. Evidently, we do need a much larger set of simulated LSPs to develop a more exact optical model of neutrophils, but we leave this for future study. Here we limit ourselves to six simulated LSPs, presented in Fig. 5 . They have different intensities for different granule sizes, but the differences are significant only for , which agree with our previous results using the model without a nucleus.12 Table 2Parameters of the neutrophil optical model used for DDA simulations.
Next, we compared experimental LSPs of neutrophils to the simulated ones. Twenty-five randomly chosen experimental LSPs and one theoretical LSP simulated for the set N6 (Table 2) are shown in Fig. 6 . In general, the absolute cross section of the LSP calculated from our optical model coincides with experimental LSPs, which demonstrate a relatively large variability in their intensities and shapes. Fig. 6Experimental LSPs of single neutrophils (gray) and LSP calculated by DDA (black) from the optical model of the cell.  We measured LSPs of neutrophils of four donors to estimate their intersample variability. The result of the measurement is shown in Fig. 7 as LSPs averaged over all neutrophils in each sample. LSPs of individual neutrophils (gray lines in Fig. 6) have a random oscillating structure, while averaged LSP is almost featureless except a minimum and maximum between 7 and . These extrema are present in all individual LSPs as well as in the averaged LSP. The position of extrema of individual LSPs for small scattering angles is mostly determined by neutrophil diameter (i.e., it can be described by diffraction). The simulated LSPs (Fig. 5) also have these two extrema at similar angles, which proves that we used more or less correct size for the neutrophil model. It is important to note that simulated LSPs do not agree with experimental LSPs of the other three individuals as well, as they do with the individual 1. Variation of model parameters, especially refractive indices and nuclei sizes, is definitely required to produce better agreement for other individuals, and that is left for future research. However, we believe that Fig. 6 clearly supports the adequacy of our optical model. Averaged LSPs of neutrophils of different individuals are essentially different (e.g., they have different overall magnitudes and decay rates for larger scattering angles). These differences are caused by morphological differences of neutrophils (size, internal composition, refractive indices of the constituents, etc.). Hence, we put forward the hypothesis that averaged LSPs may serve as a diagnostic parameter. However, an extensive clinical study of both normal and abnormal samples is required to clarify its diagnostic value. 3.4.Size DistributionsSize distributions obtained by the spectral decomposition method (Section 2.3.2) for four samples are shown in Fig. 3. Mean sizes of neutrophils with an error of the mean size and width of distribution (two standard deviations) are presented in Table 1. Mean values agrees well with recent microscopic data,25 but standard deviations are on average 50% larger. This shows that spectral sizing method produces meaningful results for neutrophils, but it produces significant errors for each individual cell, leading to widening of distributions. As was mentioned in Section 2.3.2, the spectral decomposition method plays a role of an indicator for a neutrophil size because of unknown systematical error of this method for granular cells. The developed optical model of a neutrophil given a good agreement with experimental results should help us to determine this error from future theoretical study. One can see that there is only a small difference in neutrophil sizes between the samples, for sample-averaged values. Therefore, significant changes in neutrophil internal structure (granularity, size of nucleus, refractive indices, etc.) must be involved to explain the fivefold intersample variation of LSP magnitude. Further study is required to make any definite conclusions. 4.ConclusionTo the best of our knowledge, this paper describes the first measurement of the differential light-scattering cross section of normal human neutrophils in absolute units. Moreover, for the first time a direct comparison between simulated and experimental angle-resolved LSPs was obtained for these cells, which are apparently one of the morphologically most complex blood cells. The LSPs were measured by a scanning flow cytometer and simulated using the discrete dipole approximation. The measured differential cross section can be used in estimation of scattering efficiency of neutrophils in different angular intervals and to estimate a decay of laser radiation by white blood cell samples. The experimental LSPs of neutrophils demonstrate substantial variations in their intensities and structures within a single sample, and even larger variations between individuals. We used an empirical technique to determine neutrophil sizes, and these data suggest that inter-sample difference of mean sizes is . Therefore, significant changes in neutrophil internal structure (granularity, size of nucleus, refractive indices, etc.) must be involved to explain the fivefold intersample variation of LSP magnitude. This hints at the potential application of averaged over a sample LSP as a diagnostic parameter. As a first step to characterization of neutrophils from measured LSPs, we proposed an optical model and used it in simulation of light scattering for several sets of values of model parameters. Simulated LSPs show good agreement with one of the samples, but they do not explain the intersample variation of experimental LSPs. Although it shows the potential of our model, much more study is required to link this intersample variation to the morphological parameters of neutrophils. Currently, it does not seem feasible to rigorously characterize individual neutrophils because of the large number of model parameters involved and very complex structure of real neutrophils. A few simpler ways are possible: either to characterize individual cells using approximations of the light-scattering problem (optical model and/or method to simulate light scattering) or determine their average morphological parameters from analysis of the averaged LSPs. Even these simpler problems are far from trivial and still wait to be solved. AcknowledgmentsThe authors gratefully acknowledge Dr. Konstantin Semyanov for his efforts in accurate alignment of the scanning flow cytometer. This work was supported by the grant of the Russian Foundation for Basic Research, No. 07-04-00356, and integration grants of the Siberian Branch of the Russian Academy of Science, No. 2006-3, and No. 2006-14. M.A.Y. acknowledges support of the Russian Science Support Foundation through the grant “Best PhD-students of Russian Academy of Sciences” and of the administration of the Novosibirsk region. ReferencesS. L. Perkins,
“Normal blood and bone marrow values in humans,”
Wintrobe’s Clinical Hematology, 2738
–2741 11th ed.Lippincott Williams & Wilkins Publishers, Baltimore
(2003). Google Scholar
K. M. Skubitz,
“Neutrophilic leukocytes,”
Wintrobe’s Clinical Hematology, 267
–310 11th ed.Lippincott Williams & Wilkins Publishers, Baltimore
(2003). Google Scholar
Jan W. M. Visser,
“Analysis and sorting of blood and bone marrow cells,”
Flow Cytometry and Sorting, 669
–683 2nd ed.Wiley-Liss, New York
(1991). Google Scholar
L. Bonetta,
“Flow cytometry smaller and better,”
Nat. Methods, 2 785
–795
(2005). 1548-7091 Google Scholar
L. W. M. M. Terstappen,
D. Johnson,
R. A. Mickaels,
J. Chen,
G. Olds,
J. T. Hawkins,
M. R. Loken, and
J. Levin,
“Multidimensional flow cytometric blood-cell differentiation without erythrocyte lysis,”
Blood Cells, 17 585
–602
(1991). 0340-4684 Google Scholar
A. M. Thurau,
U. Schylz,
V. Wolf,
N. Krug, and
U. Schauer,
“Identification of eosinophils by flow cytometry,”
Cytometry, 23 150
–158
(1996). 0196-4763 Google Scholar
G. Carulli,
“Applications of flow cytometry in the study of human neutrophil biology and pathology,”
Haemapathol. Mol. Hematol., 10 39
–61
(1996). Google Scholar
V. P. Maltsev and
K. A. Semyanov,
“Characterisation of bio-particles from light scattering,”
J. Inv. Ill-Posed Problems, 133
(2004). 0928-0219 Google Scholar
B. G. de Grooth,
L. W. Terstappen,
G. J. Puppels, and
J. Greve,
“Light-scattering polarization measurements as a new parameter in flow cytometry,”
Cytometry, 8 539
–544
(1987). https://doi.org/10.1002/cyto.990080602 0196-4763 Google Scholar
L. W. Terstappen,
B. G. De Grooth,
K. Visscher,
F. A. van Kouterik, and
J. Greve,
“Four-parameter white blood cell differential counting based on light scattering measurements,”
Cytometry, 9 39
–43
(1988). 0196-4763 Google Scholar
S. Lavigne,
M. Bosse,
L. P. Boulet, and
M. Laviolette,
“Identification and analysis of eosinophils by flow cytometry using the depolarized side scatter-saponin method,”
Cytometry, 29 197
–203
(1997). 0196-4763 Google Scholar
M. A. Yurkin,
K. A. Semyanov,
V. P. Maltsev, and
A. G. Hoekstra,
“Discrimination of granulocyte subtypes from light scattering: Theoretical analysis using a granulated sphere model,”
Opt. Express, 15 16561
–16580
(2007). https://doi.org/10.1364/OE.15.016561 1094-4087 Google Scholar
D. Watson,
N. Hagen,
J. Diver,
P. Marchand, and
M. Chachisvilis,
“Elastic light scattering from single cells: orientational dynamics in optical trap,”
Biophys. J., 87 1298
–1306
(2004). 0006-3495 Google Scholar
K. A. Semyanov,
A. E. Zharinov,
P. A. Tarasov,
M. A. Yurkin,
I. G. Skribunov,
D. R. van Bockstaele, and
V. P. Maltsev,
“Optics of leucocytes,”
Optics of Biological Particles, 253
–264 Springer, London
(2006). Google Scholar
A. K. Dunn,
“Modelling of light scattering from inhomogeneous biological cells,”
Optics of Biological Particles, 19
–29 Springer, London
(2006). Google Scholar
Michael Loken,
“Immunofluorescence technique,”
Flow Cytometry and Sorting, 341
–353 2nd Ed.Wiley-Liss, New York
(1991). Google Scholar
V. P. Maltsev,
“Scanning flow cytometry for individual particle analysis,”
Rev. Sci. Instrum., 71 243
–255
(2000). https://doi.org/10.1063/1.1150190 0034-6748 Google Scholar
M. A. Yurkin,
K. A. Semyanov,
P. A. Tarasov,
A. V. Chernyshev,
A. G. Hoekstra, and
V. P. Maltsev,
“Experimental and theoretical study of light scattering by individual mature red blood cells by use of scanning flow cytometry and a discrete dipole approximation,”
Appl. Opt., 44 5249
–5256
(2005). 0003-6935 Google Scholar
M. A. Yurkin and
A. G. Hoekstra,
“The discrete dipole approximation: An overview and recent developments,”
J. Quant. Spectrosc. Radiat. Transf., 106 558
–589
(2007). https://doi.org/10.1016/j.jqsrt.2007.01.034 0022-4073 Google Scholar
M. A. Yurkin,
V. P. Maltsev, and
A. G. Hoekstra,
“The discrete dipole approximation for simulation of light scattering by particles much larger than the wavelength,”
J. Quant. Spectrosc. Radiat. Transf., 106 546
–557
(2007). https://doi.org/10.1016/j.jqsrt.2007.01.033 0022-4073 Google Scholar
“Description of the national compute cluster Lisa,”
(2005) http://www.sara.nl/userinfo/lisa/description/ Google Scholar
K. A. Semyanov,
P. A. Tarasov,
A. E. Zharinov,
A. V. Chernyshev,
A. G. Hoekstra, and
V. P. Maltsev,
“Single-particle sizing from light scattering by spectral decomposition,”
Appl. Opt., 43 5110
–5115
(2004). https://doi.org/10.1364/AO.43.005110 0003-6935 Google Scholar
P. A. Tarasov,
M. A. Yurkin,
P. A. Avrorov,
K. A. Semyanov,
A. G. Hoekstra, and
V. P. Maltsev,
“Optics of erythrocytes,”
Optics of Biological Particles, 231
–246 Springer, London
(2006). Google Scholar
G. I. Ruban,
S. M. Kosmacheva,
N. V. Goncharova, D. Van Bockstaele, V. A. Loiko,
“Investigation of morphometric parameters for granulocytes and lymphocytes as applied to a solution of direct and inverse light-scattering problems,”
J. Biomed. Opt., 12
(4), 044017
(2007). https://doi.org/10.1117/1.2753466 1083-3668 Google Scholar
S. L. Perkins,
“Normal blood and bone marrow values in humans,”
Wintrobe’s Clinical Hematology, 2738
–2741 11th ed.Lippincott Williams & Wilkins Publishers, Baltimore
(2003). Google Scholar
S. A. Livesey,
E. S. Buescher,
G. L. Krannig,
D. S. Harrison,
J. G. Linner, and
R. Chiovetti,
“Human neutrophil granule heterogeneity: immunolocalization studies using cryofixed, dried and embedded specimens,”
Scanning Microsc. Suppl., 3 231
–239
(1989). 0892-953X Google Scholar
D. F. Bainton,
“Neutrophilic leukocyte granules: from structure to function,”
Adv. Exp. Med. Biol., 336 17
–33
(1993). 0065-2598 Google Scholar
O. W. Bjerrum,
“Human neutrophil structure and function with special reference to cytochrome b559 and beta 2-microglobulin,”
Dan. Med. Bull., 40 163
–189
(1993). 0907-8916 Google Scholar
P. Brederoo,
J. van der Meulen, and
A. M. Mommaas-Kienhuis,
“Development of the granule population in neutrophil granulocytes from human bone marrow,”
Cell Tissue Res., 234 469
–496
(1983). 0302-766X Google Scholar
A. E. Zharinov,
P. A. Tarasov,
A. N. Shvalov,
K. A. Semyanov,
D. R. van Bockstaele, and
V. P. Maltsev,
“A study of light scattering of mononuclear blood cells with scanning flow cytometry,”
J. Quant. Spectrosc. Radiat. Transf., 102 121
–128
(2006). 0022-4073 Google Scholar
A. Dunn and
R. Richards-Kortum,
“Three-dimensional computation of light scattering from cells,”
IEEE J. Sel. Top. Quantum Electron., 2 898
–905
(1996). https://doi.org/10.1109/2944.577313 1077-260X Google Scholar
J. T. Soini,
A. V. Chernyshev,
P. E. Hänninen,
E. Soini, and
V. P. Maltsev,
“A new design of the flow cuvette and optical set-up for the scanning flow cytometer,”
Cytometry, 31 78
–84
(1998). https://doi.org/10.1002/(SICI)1097-0320(19980201)31:2<78::AID-CYTO2>3.0.CO;2-E 0196-4763 Google Scholar
|