
|
|
1.IntroductionMicroscopic phase objects—those featuring no amplitude contrast that would otherwise make them visible even under a standard microscope illumination (i.e., axial bright field)—can be visualized in various ways. The most common one is the phase-contrast imaging1, 2 (1953 Nobel Prize to Frits Zernike3). Other imaging modes capable of revealing the phase information include the differential interference contrast (e.g., after Nomarski4) and various schlieren illumination modes, 5 the most common one being the Hoffman modulation contrast,6 its simpler form,7 and the off-axis (oblique, inclined, single-sideband, asymmetric) illumination.8 Various other microscopic schlieren imaging modes, essentially combinations of the abovementioned ones have been briefly listed elsewhere.9 In phase objects, the luminance profiles in the off-axis illumination (or generally schlieren) image roughly correspond to those of the optical path difference gradients in the apparent direction of illumination; that is, perpendicular to the edge of the schlieren (cut-off, relief) diaphragm;2, 5, 10 this dependency is not exactly linear.11 The optical path difference (OPD) equals , where and are the refractive indices of the medium and phase object, respectively, and is the object’s (physical) thickness; is optical thickness. The phase shift induced by the phase object equals . For example, if the medium is air , OPD and phase shift are negative; the object is phase-retarding. In ideal, artifact-free phase-contrast images, the dependency between the luminance and the OPD itself is nearly linear within certain OPD intervals. If the phase object is also sufficiently thin (OPD is only a fraction of wavelength), the luminance in each phase-contrast image pixel is also almost directly proportional to the OPD in a corresponding point in the specimen; this holds for both phase-retarding objects (OPD is positive, e.g., cells in water) in negative phase-contrast and phase-advancing objects (OPD is negative, e.g., gas vacuoles in cells) in positive phase-contrast. 12, 13, 14 These situations can be easily documented with vector diagrams,3 whose usage was extensively described in Barer’s papers, as shown elsewhere.12, 13 In terms of the information contents, the off-axis illumination and artifact-free phase-contrast images can thus be regarded as more-or-less equivalent. Indeed, the fact that the quasi–three-dimensional (pseudo-relief) effect inherent to the off-axis illumination (or generally schlieren) images can also be obtained by differentiating (directional gradient filtering) the phase-contrast ones has been known for a long time. Qualitative examples have been reported in both optical15, 16, 17 and electron18 microscopy. However, the relationship between the off-axis illumination and phase-contrast images is generally difficult to document quantitatively. Such efforts have been inevitably hampered by the “halo”/shade-off artifacts inherently present in the phase-contrast images of thicker objects usually featuring large OPDs. In very thin objects, for example, tissue culture cells spread on a glass microslide or a Petri dish, this artifact is often small or even absent altogether,3, 16 but the off-axis illumination (or, for example, Hoffman modulation contrast) imaging is rather insensitive in detecting the OPD (“phase”) gradients in such cases. Indeed, the low sensitivity of schlieren imaging (where only the intensity of direct light is altered) was the very motivation behind the invention of the phase-contrast microscope,1, 2 although the idea that is pivotal in this method—to selectively alter also the phase of the direct light—was reported much earlier.19 To bridge this gap between the two phase-imaging modes, we use off-axis illumination and a refined form of phase-contrast imaging, the apodized phase-contrast microscopy. The latter delivers reduced halo/shade-off artifact images by purely optical means 14, 20, 21, 22, 23, 24, 25, 26, 27, 28 (Fig. 1 ), that is, without the need for any postdetection processing17, 29, 30 that would otherwise have to be employed.30 Apodized phase-contrast thus makes it possible to reliably visualize thicker phase specimens22, 28 than a conventional phase-contrast. Fig. 1The principle of apodized phase-contrast microscopy (qualitative aspects only). Details on the theory can be found in the text, accompanying vector diagrams (Fig. 2) and an interactive online material (Ref. 28). (a) Optical setup. Instead of a conventional phase plate, an apodized phase plate is located at the transform (objective back focal) plane conjugate with the condenser’s front focal plane hosting the annular diaphragm. Objects that are large in terms of lateral dimensions (thus diffracting light to small angles) are typically also thick in terms of OPD and so diffract rather strongly, causing profound halo/shade-off artifacts. Most of this light is attenuated by the apodization annuli (B) adjacent to the phase annulus (A). Small objects diffract light to wider angles; it passes mostly through the no-attenuation areas (C) and is largely unaffected by the phase annulus (A) and the apodization annuli (B). The image of the large/small colorless phase object is “optically stained” (light/dark gray); apodization somewhat reduces contrast in images of large thin objects but markedly supresses the halo/shade-off artifacts in images of large thick objects. (b) The principle of apodization (from Greek, meaning “foot removal”) illustrated with a periodic object yielding a distinct diffraction pattern registering with the apodization annuli. 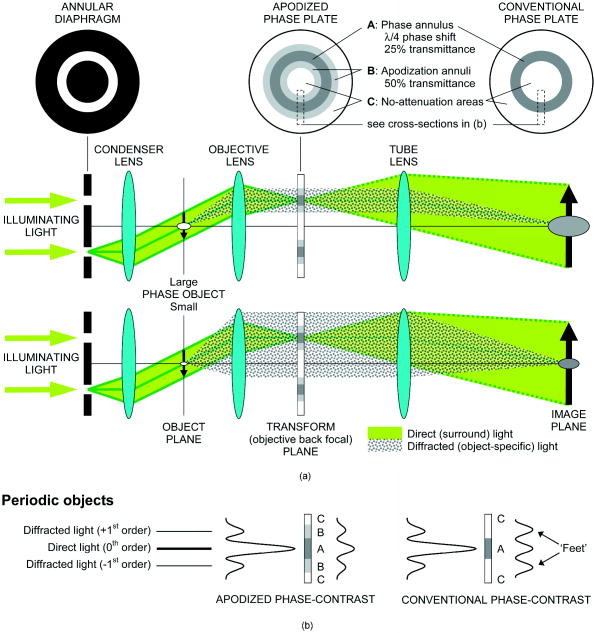 Fig. 2Vector diagrams applied here to “calculate” luminance in the images of a nonabsorbing (transparent) phase-retarding object ( phase shift relative to the surrounding medium, or ), in conventional and apodized phase-contrast (positive type in both cases). For simplicity it is assumed that all diffracted light passes through the apodization annuli and that the medium causes a negligible phase shift (e.g., air). Arrows represent light vectors ( to ), their length and angle indicating light wave amplitude and phase , respectively. Light intensity (luminance), . The strongest contrast is achieved when vectors and are as small as possible, that is, and (conventional and apodized phase-contrast, respectively). Note that in the conventional phase-contrast, the luminance in object’s image is already greater than the background luminance , in other words, it is giving rise to contrast reversal. In apodized phase-contrast, the object still appears darker than the background. Apodization in phase-contrast microscopy thus broadens the range of OPDs (broadly speaking, optical thicknesses) yielding unreversed contrast. As it attenuates the diffracted light, it is also instrumental in reducing the halo/shade-off artifacts.  The aim of the present paper is to document, in biological phase specimens of various optical thicknesses, the differences between the two imaging modes in terms of image information contents. Digital image filtering of apodized phase-contrast (artifact-free) images is employed and the effects of visual cues to depth structure in comprehension of quasi-3D (off-axis illumination) images are discussed. Note: Because the media surrounding the phase objects under investigation were not altered during the observations, and the data presented here are of semiquantitative nature only, a more familiar term, “optical thickness” is often used instead of a more rigorous one, “optical path difference” (OPD). As stated previously, both of them are proportional to the object’s physical thickness. 2.Experimental Proceedings2.1.SpecimensAlmost purely phase specimens were employed to evaluate the phase-visualization capability of the optical set-ups used:
2.2.MicroscopesAll off-axis illumination images shown in Figs. 3, 4, 5, 6 were acquired with an upright laboratory microscope, DN45-BH51 model (Lambda Praha, Prague, Czechoslovakia) equipped with a dedicated off-axis illumination Abbé-type condenser [numerical aperture (NA) 1.2], RCH-0128 model with a built-in shifting relief diaphragm, as described in detail elsewhere.9, 31, 32 An achromatic objective, was used. Fig. 3Phase specimen with a uniform refractive index (leaf replica from coachgrass, Agropyron repens). Its optical and physical thickness profiles directly correspond. Three different microscopic phase-imaging modes are used. Note the strong relieflike impression in the off-axis illumination image, facilitating a direct visual 3D “reconstruction.” Corresponding quasi-3-D surface rendering diagrams are shown in 1a. The halo/shade-off artifacts in the apodized phase-contrast image are substantially reduced compared with the conventional phase-contrast one. Phase-contrast type: positive. The two boxed motifs are shown in Fig. 4 at an expanded scale. 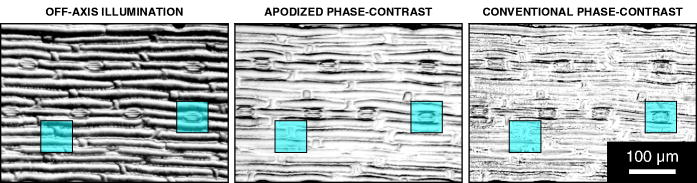 Fig. 4Correlation between off-axis illumination and apodized phase-contrast images, as demonstrated with cutout details marked in Fig. 3. Note the similarity between the off-axis illumination (a) and appropriately filtered apodized phase-contrast (f) images. This contrasts with the very different visual impression exerted by the original, unfiltered images (d). The conventional phase-contrast images (j) suffer from extensive halo/shade-off artifacts and make image filtering meaningless. Images: Original images (a), (d), and (j) were processed by directional gradient filtering [vertical differentiation, (e) and (k)] or directional gradient filtering combined with luminance inversion [embossed relief filtering, (f) and (l); minus (d); minus (j)]. Graphs: Each graph represents a luminance profile (0 to 255) along a line positioned in the corresponding image as shown in box (b) (top to bottom scan). Grayscale in all graphs, 0 to 300.  Fig. 5Phase specimen of medium optical thickness and uniform refractive index (leaf replica from catchweed, Galium aparine). Panels (a) and (b); Note the strong quasi-3D effect and overall impression that is dependent on the choice of the apparent direction of the off-axis illumination (left, from above; right, from below). To most observers, the cell shapes appear either convex (left) or concave (right); invert the page to experience impression reversal. Panels (c) and (d): The halo/shade-off artifacts (arrowheads) present in the conventional phase-contrast image are noticeably reduced in the apodized phase-contrast one. See the text for an explanation. Phase-contrast type: positive.  Fig. 6Phase specimens with extreme values of optical thickness. Panels (a) and (b) (thick specimen): Longitudinal section through the wood of Norway spruce (Picea abies). Note that the off-axis illumination yields better contrast than phase-contrast. Panels (c) and (d) (thin specimen): The thinnest, still growing portion of Spanish slug’s radula, as an example of a specimen in which the phase-contrast yields much higher contrast than the off-axis illumination. Phase-contrast type: positive (b) and negative (d).  Video 1Quasi-3D surface rendering of the images shown in Fig. 3 (tilted by around the axis and anticlockwise around the axis in increments). The information that can be extracted from the three image types is comparable, although the quasi-3D surface rendering starts failing in the conventional phase-contrast image, in which the structure is blurred by profound halo/shade-off artifacts; this is more apparent in the videos themselves. Video 1(a) (MOV, 2.5MB) 10.1117/1.2966716.1; Video 1(b) (MOV, 1.7MB) 10.1117/1.2966716.2; Video 1(c) (MOV, 1.8MB) 10.1117/1.2966716.3.  The phase-contrast image of the slug’s radula [Fig. 6d]) was acquired with another Lambda DN45–BH51 upright microscope fitted with a phase-contrast condenser (NA 1.25) normally supplied with DN45-BH47Ph microscope model. A planachromatic objective, Plan 10Ph/0.25 was used (conventional phase-contrast, negative type). All above-mentioned photomicrographs were acquired with Praktica VLC3 camera (Pentacon, Dresden, Germany), on Fuji Superia 100 color print film, using a photographic eyepiece . An ordinary (non-interference) green filter was used throughout. Except for Fig. 6d, all other phase-contrast images shown in Figs. 3, 4, 5, 6 were acquired with the following Nikon (Tokyo, Japan) CFI achromatic objectives of DL (“dark low”) series: DL (conventional phase-contrast, positive type) and ADL (apodized phase-contrast, positive type). A green interference filter and a personal computer–controlled DS-Fi1 charge-coupled device camera were used throughout. All positive-type phase-contrast images shown in Figs. 3 and 4 and Figs. 5 and 6 were acquired on Nikon Eclipse inverted microscopes (TE2000-S and TS100-F models, respectively), each fitted with a halogen lamp ( and , respectively) and a (extra) long-working-distance condenser (LWD, NA 0.52, working distance ; and ELWD, NA 0.30, working distance , respectively) with a Ph-1 annular aperture. 2.3.Apodized Phase-ContrastThe apodized phase-contrast microscope 14, 20, 21, 22, 23, 24, 25, 26, 27, 28 differs from a conventional one by two light-attenuating annuli immediately adjacent to the phase annulus (Fig. 1). Its principle is based on apodization and can be briefly described as follows: The angle of light diffracted by an object (e.g., a cell) decreases as the object’s size (or, to be precise, its lateral dimensions) increases [Fig. 1a]. In large objects, a considerable fraction of diffracted light thus passes through the phase annulus that, however, should ideally be sanctioned to the direct light only. This brings about distortions in the luminance profiles in the images, called halo and shade-off artifacts; they surround and fill the object’s image, respectively. The reason is that the diffracted light cannot fully contribute to image formation as it has been attenuated by the phase annulus.3, 12, 13 An analytical explanation of the halo/shade-off artifacts is possible either with Bessel functions1, 21 or, to some extent, with vector diagrams,3, 12, 13 which are also used in the present study (Fig. 2 ). On the other hand, the amplitude of the diffracted light increases with the optical path difference (OPD) between the object and the surrounding medium (Fig. 2). The artifacts are thus insignificant in thin objects, regardless of their lateral dimensions (e.g., tissue culture cells spreading on a flat surface3); the intensity of diffracted light is low. They only become prominent in those large objects that are also thick, in terms of OPD (e.g., cell clusters28). Such objects diffract light strongly, thus causing noticeable artifacts. The 50% transmittance apodization annuli decrease the relative contribution of the artifact-generating diffracted rays (i.e., those that have been absorbed by the phase annulus). In a simplified case of a periodic object with a particular spatial frequency, the diffraction maxima (side lobes or “feet”) pass through the apodization annuli and are attenuated (feet removed, or apodized) to 50% [Fig. 1b]. The price that is paid for the artifact reduction in the apodized phase-contrast images is a lower maximum theoretically achievable contrast, which can be easily calculated25 or demonstrated with vector diagrams (Fig. 2). This effect is only significant in large objects; in small ones, light is diffracted to greater angles and most of it bypasses the apodization annuli [Fig. 1a]. In real images, however, the contrast may actually increase owing to apodization because the structural details are no longer masked by the halo/shade-off artifacts (Figs. 3, 4, 5 and 1a). 2.4.ImagesIn Fig. 3, images of the same specimen area, acquired under different imaging modes, were aligned to match, at precision ( images), which translates to to 2% of image width in selected cutout details shown in Fig. 4. This value is within the Rayleigh resolution limit of for green light used here. A somewhat smaller precision in aligning the images was afforded in Figs. 5 and 6 where no quantitative image analysis was carried out. Upon electronic color separation, the strongest color signal (green) was converted to grayscale (0 to 255) and contrast optimized; the grayscale values of 0% to 3% of the brightest and 0% to 3% of the darkest pixels were adjusted to 255 and 0, respectively, and the histogram of the remaining 94% to 100% of pixels was expanded to cover the entire 0 to 255 grayscale range (linear expansion). This operation guarantees optimal print reproduction. However, it also slightly distorts the shape of image histograms. For this reason, the luminance profiles [Fig. 4, description follows], were obtained in images where the contrast was optimized by strictly using 100% (rather than, for example, 94%) of image pixels, as described previously. The contrast-optimized microscopic images shown in Fig. 3 were converted to quasi-3D rendering diagrams and video sequences (1a) showing the diagrams at a range of angles. The “3D-surface” function of Analysis Pro software was employed. The contrast in the still video images shown in 1a was optimized again. The luminance profiles (line scans) were determined, at resolution, in selected cutout details from Fig. 3. These are presented in Figs. 4a, 4d, 4j, the precise location of the line scans in Fig. 4b, and the profiles themselves in Figs. 4c, 4g, 4m. Top to bottom direction in the images corresponds to left to right direction in the graphs. The orientation of each line scan was always perpendicular to the edge of the central part of the relief diaphragm, that is, parallel to the apparent direction of illumination (north to south direction in Figs. 3 and 4). Such profiles were also determined, in the same locations, in the apodized and conventional phase-contrast images [Figs. 4d and 4j, respectively] previously processed, at resolution, by two kinds of filtering, as described in Secs. 2.4.1, 2.4.2. 2.4.1.Directional gradient filtering (or differentiation)The original image [Figs. 4d and 4j] was trimmed on top by two pixels and the resulting image shifted up by two pixels. From that image, the original one [Figs. 4d and 4j] was subtracted and the resulting image was trimmed on the right by two pixels to [Figs. 4e and 4k]. The corresponding luminance profile [Figs. 4h and 4n] represents a directional gradient between and pixel rows, i.e., a vertical gradient at pixel row. The step was chosen to be two pixels , about the same as the resolving power of the objective used. This is a compromise between a greater spatial precision and a more efficient suppression of high spatial frequency noise present in the luminance profiles. 2.4.2.Embossed relief filteringFrom the image obtained in the previous step (differentiation) [Figs. 4e and 4k], the original image [Figs. 4d and 4j] was subtracted again, after being (i) trimmed to by from top/bottom/right and (ii) shifted up by 1 pixel. The resulting images and corresponding luminance profiles are shown in Figs. 4f and 4l and Figs. 4i and 4o, respectively. The subtraction operation with any pair of images meant multiplication of each of the two images by , subtraction, and application of a 127 offset to prevent the grayscale intensity becoming negative or saturating at 255 level. In order for all seven images of the same detail [Figs. 4a, 4d, 4e, 4f, 4j, 4k, 4l] to match, Fig. 4a was trimmed to in the same way as Fig. 4d and 4j (by from top/bottom/right). All electronic operations with the images were performed with Analysis Pro version 3.1 or 3.2 (Soft Imaging Solutions GmbH, Münster, Germany), Adobe Photoshop version 7.0.1 CE (San Jose, California), or with ImageJ version 1.40g (National Institutes of Health, Bethesda, Maryland). 3.ResultsThe coachgrass leaf replica images and corresponding quasi-3D (pseudo-relief) surface rendering diagrams are shown in Fig. 3 and 1a, respectively. The diagrams can also be inspected at a range of viewing angles in online videos ( increment animation). Selected image details, marked in Fig. 3 by boxes, are shown at an expanded scale in Figs. 4a, 4d, 4j. Although the information contents in the off-axis illumination and apodized phase-contrast images is comparable, the conventional phase-contrast ones suffer from extensive halo/shade-off artifacts that overwhelmingly blur the structural details, especially edges. This demonstrates the efficiency of artifact reduction by apodization. These points are further documented in images processed by directional gradient [Figs. 4e and 4k] and embossed relief [Figs. 4f and 4l] filtering. The latter combines the directional gradient-filtered (differentiated) images with those in which the intensities were inverted (positive-negative). Note the similarity between Figs. 4a (original images) and 4f (embossed relief images). The filtered apodized phase-contrast images [Figs. 4e and 4f] feature a relief impression to some extent, as does the off-axis illumination image [Fig. 4a]. In many cases, a mere inversion of the luminance (positive-negative) was nearly sufficient to convert the original apodized phase-contrast images [Fig. 4d] to those similar to the off-axis illumination ones [Fig. 4a]. Indeed, both off-axis illumination and apodized phase-contrast imaging modes inherently suppress low spatial frequencies, thus highlighting edges/contours. Apodization also “deblurs” the images by eliminating the halo/shade-off artifacts associated with large optical path difference steps/gradients (edges). On the other hand, no meaningful information can be extracted from the filtered conventional phase-contrast images as the structure is either “flattened” [Fig. 4k] or “scrambled” [Fig. 4l]. The luminance profiles, performed vertically as line scans, located as shown in Fig. 4b, are also presented [Figs. 4c, 4g, 4m]. The profiles of the filtered images are shown in Figs. 4h and 4i (apodized phase-contrast) and Figs. 4n and 4o (conventional phase-contrast). The luminance profiles obtained in the off-axis illumination images [Fig. 4c] are comparable to some extent to those obtained in the filtered apodized phase-contrast ones [Fig. 4i]. As mentioned in Sec. 1, the graphs shown in Figs. 4c and 4h may theoretically match. In reality, however, the fit between them is far from perfect, and at least part of the reason are some of the following factors:
Another set of images from a specimen of medium thickness (leaf replica from catchweed) is shown in Fig. 5. Two opposite apparent directions of illumination were chosen in the off-axis illumination mode; note the strong illusion of convex/concave shapes conveyed by shading that serves as a visual cue to depth structure. The quasi-3D (pseudo-relief) impression is particularly strong in this “jigsaw-puzzle” specimen, perhaps owing to the high density of edges (cell borders) where the shading patterns are most prominent. The conventional phase-contrast image in Fig. 5 is partly blurred by the shade-off artifacts spreading along cell axes. These artifacts are mostly eliminated by the apodized phase-contrast; only thin ‘ridges’ remain (arrowheads). The image areas that are bright in the conventional phase-contrast but turn dark in the apodized phase-contrast roughly correspond to the OPD of ; compare vectors (bright) and (dark) in Fig. 2. The ridges may thus be regarded as optical thickness contour lines below which the image is free from the halo/shade-off artifacts. The complementarity of the off-axis illumination and apodized or conventional phase-contrast modes is demonstrated in rather thick and thin specimens (Fig. 6). The section through the wood of Norway spruce (thick specimen) is imaged much better in the off-axis illumination mode [Fig. 6a]. The effect of apodization is rather moderate in this specimen (image not shown), as theoretically predictable (Fig. 2 and elsewhere in the paper). In the Spanish slug’s radula (thin specimen), the off-axis illumination mode is apparently rather inefficient [Fig. 6c]; the contrast and quasi-3D effect are very weak. At the same time, the halo/shade-off artifacts are almost absent even in the conventional phase-contrast image [Fig. 6d]. In a thicker part of the same specimen, the opposite is the case, as shown elsewhere.31 4.DiscussionApodized phase-contrast makes it possible to reliably examine under the phase-contrast microscope thicker objects than in the conventional phase-contrast. These include large cells,28, 33 embryos,28 and even small organisms, for example, living roundworms22 (Caenorhabditis elegans, a popular model in developmental biology studies, in diameter). Tomographic 3D reconstructions27 have also been performed.33 Development has been underway to further reduce the halo/shade-off artifacts in the images, for example, with graded-transmittance apodization annuli21 or a pupil-projection (optical relay) setup.26 Much like in, for example, Nikon’s interference-phase attachment described elsewhere,12, 13 the latter configuration makes the phase plate physically accessible even in high-magnification objectives, allowing us to fine-tune its parameters to the object under investigation.23, 24, 25 Related designs presented so far include (i) special phase plates, such as those originally designed for tracing irregularities on lens surfaces,34 including antireflecting soot layers (“anoptral contrast” from Reichert Co.);12, 13, 35, 36 (ii) a combination of anoptral contrast with dark field illumination;37 (iii) “variable phase-contrast” systems equipped with, for example, two separate phase annuli (“Phv” objectives from Zeiss)38, 39 or a condenser enabling a continuous change of the diameter of the condenser annulus40 (in a way, a modification of so-called universal phase condenser). A more detailed account of these designs can be found elsewhere,12, 13 including a combination of phase-contrast with interference microscopy. The off-axis illumination mode is capable of introducing into the images the quasi-3D effect, thus facilitating their comprehension by the human visual system.41, 42 Corresponding physiological activity has been demonstrated directly in human and monkey brains, either by functional magnetic resonance imaging43, 44 or by recording single neuronal activity.45 The quasi-3D effect is perceived owing to so-called visual cues to depth structure (depth cues). They make it easier for the image, as detected on the retina in the eye, to be correctly interpreted by the visual cortex in human brain. Apart from motion cues and the binocular parallax, where both eyes are involved, there are also monocular cues that include shading, texture, occlusion, and contours (silhouette). Not all of these cues are present in every quasi-3D image, and not always are the different types of cues nonconflicting (“consistent-cue stimulus”).42, 44 Shading as a visual cue should not be confused with the shade-off or shading-off artifact referred to throughout the present paper in relation to the phase-contrast microscopy. The shading cue is inherently present in the off-axis illumination or Hoffman modulation contrast5, 6 images, hence the term “schlieren imaging” (see Sec. 1 for details), implying the presence of “streaks” (shading patterns) in the images. The same applies to the differential interference contrast after Nomarski4 using an altogether different optical principle. All of these imaging modes deliver quasi-3D (pseudo-relief) images and so do certain postdetection (image shift and subtraction) procedures16, 17, 18 and online approaches using split detectors,46 eliminating the need for any postdetection processing altogether. The latter thus essentially imitate the visual processing in the human brain. In the phase-contrast images, on the other hand, shading as a visual cue to depth structure is absent, although a version of the phase-contrast microscope that would bring about the quasi-3D effect by using noncircular phase strips was described a long time ago2 and various other modifications have been proposed since. 12, 13, 47, 48, 49, 50, 51, 52 A commercially available one called VAREL (Variable Relief Contrast)53 has been manufactured by Zeiss; its origin lies in a system allowing a switch between the phase-contrast and relief (off-axis) illumination, without having to change the objective lens.49 Yet another type has been proposed with the aim to improve the efficiency of the optical microlithography process.54 The quasi-3D (pseudo-relief) effects were also achieved in conjunction with laser scanning (confocal) microscopy by using half-aperture stops55, 56 or split detectors,46, 57, 58 or by shifting and subtracting images obtained by slight under- and overfocusing.59 Despite the absence of any phase-shifting elements the quasi-3D approach is often referred to as “differential phase-contrast”55, 57, 58 or (incorrectly) “differential interference contrast,”59 which only highlights the complementary nature of the off-axis illumination and phase-contrast imaging. Despite the advantages of directly obtaining the quasi-3D (pseudo-relief) images, it should be borne in mind that certain structures may easily be misinterpreted when using the off-axis illumination alone [see, for example, the top cutout detail in Figs. 4a and 4d]. Owing to a greater depth of field and the presence in the images of the visual cues to depth structure, this mode may be useful in the initial screening of a specimen, before selected details are subjected to a rigorous examination under the apodized phase-contrast. 5.ConclusionThe present paper describes the off-axis illumination and the apodized phase-contrast microscopy as two complementary phase-imaging modes. Their combination is particularly suitable to examine specimens of medium optical thickness (e.g., large cells or cell clusters) in which the two modes overlap in terms of phase visualization capability. From the viewpoint of image information contents alone, the two image types are comparable (“off-line machine vision”). Although the structure itself may often be more faithfully represented in the apodized phase-contrast images, an important visual cue to depth structure (shading) is present in the off-axis illumination images only, thus enabling an instant image interpretation by an experimentalist (“online human vision”). This may be of importance, for example, when observing highly motile cells or in routine screening of large specimen sets. The points outlined in the present paper could be demonstrated by using halo/shade-off artifact reduction in phase-contrast images by apodization. AcknowledgmentsThe authors are grateful to Dr. Kaoru Katoh (National Institute of Advanced Industrial Science and Technology—AIST, Tsukuba, Japan) for helpful discussions. Mr. Hiroyasu Tanaka (Nikon Instruments Company’s BioScience Division, Kawasaki City, Japan) and the staff, and Mr. Daniel Mack (Nikon s.r.o., Prague) kindly enabled acquisition of the positive phase-contrast images on their equipment. Many thanks are due to Drs. Jiří Janáček, Petr Bouř, Lucie Kubínová, and Oldřich Benada (all at Czech Academy of Sciences, Prague) for their advice about electronic image formats, and to the staff at Fotomedia a.s. in Prague for their extra effort. Institute of Physiology was supported by a framework grant No. AV0Z50110509 and a program grant No. LC06063. A partial support to RP is gratefully acknowledged (public funds, Czech Academy of Sciences’ framework grant, Ref. No. AV0Z50200510; private funds, FEI/Hitachi/JEOL-sponsored Scholarship for Young Scientists to visit Japan). ReferencesF. Zernike,
“Beugungstheorie des Schneidenverfahrens und seiner verbesserten Form, der Phasenkontrastmethode,”
Physica (Amsterdam), 1
(8), 689
–704
(1934). https://doi.org/10.1016/S0031-8914(34)80259-5 0031-8914 Google Scholar
F. Zernike,
“Phase contrast, a new method for the microscopic observation of transparent objects,”
Physica (Amsterdam), 9
(7), 686
–698
(1942). https://doi.org/10.1016/S0031-8914(42)80035-X 0031-8914 Google Scholar
F. Zernike, Physica (Amsterdam), 9
(10), 974
–986
(1942). https://doi.org/10.1016/S0031-8914(42)80079-8 0031-8914 Google Scholar
F. Zernike,
“How I discovered phase contrast,”
Science, 121
(3141), 345
–349
(1955). https://doi.org/10.1126/science.121.3141.345 0036-8075 Google Scholar
G. Nomarski,
“Microinterféromètre différentiel à ondes polarisées,”
J. Phys. Radium, 16
(7), S9
–S13
(1955). 0368-3842 Google Scholar
G. S. Settles, Schlieren and Shadowgraph Techniques, Springer-Verlag, Berlin
(2001). Google Scholar
R. Hoffman,
“The modulation contrast microscope: principles and performance,”
J. Microsc. (Oxford), 110 205
–222
(1977). 0022-2720 Google Scholar
A. Töpler,
“Ueber die Methode der Schlierenbeobachtung als mikroskopisches Hülfsmittel, nebst Bemerkungen zur Theorie der schiefen Beleuchtung,”
(Poggendorff's) Annalen der Physik und Chemie (Leipzig)Ann. Phys., 127203
(44), 556556
–580580
(18661866). 0003-3804 Google Scholar
E. Abbe,
“Ueber einen neuen Beleuchtungsapparat am Mikroskop,”
(Schultze’s) Archiv für Mikroskopische Anatomie (Bonn), 9 469
–480
(1873). Google Scholar
Z. Hostounský and
R. Pelc,
“An efficient way of high-contrast, quasi–3D cellular imaging: Off-axis illumination,”
J. Biochem. Biophys. Methods, 68
(1), 23
–30
(2006). 0165-022X Google Scholar
R. A. Sprague and
B. J. Thompson,
“Quantitative visualization of large variation phase objects,”
Appl. Opt., 11
(7), 1469
–1479
(1971). 0003-6935 Google Scholar
E. Tajahuerce,
T. Szoplik,
J. Lancis,
V. Climent, and
M. Fernandez,
“Phase-object fractional differentiation using Fourier plane filters,”
Pure Appl. Opt., 6
(4), 481
–490
(1997). https://doi.org/10.1088/0963-9659/6/4/011 0963-9659 Google Scholar
M. Pluta,
“Non-standard methods of phase contrast microscopy,”
Advances in Optical and Electron Microscopy, 49
–133 Academic Press, London (1975). Google Scholar
M. Pluta,
“Phase contrast microscopy,”
Advanced Light Microscopy, vol. 2; Specialized Methods, 1385
–90388 Elsevier & PWN-Polish Scientific Publishers, Warszawa
(1989). Google Scholar
T. Otaki,
“Halo reduction technique in phase contrast microscope,”
Opt. Rev., 8
(4), 284
–286
(2001). 1340-6000 Google Scholar
J. E. Rhodes Jr.,
“Microscope imagery as carrier communication,”
J. Opt. Soc. Am., 43
(10), 848
–852
(1953). 0030-3941 Google Scholar
S. Inoué, Video Microscopy, Plenum Press, New York
(1986). Google Scholar
E. D. Barone-Nugent,
A. Barty, and
K. A. Nugent,
“Quantitative phase-amplitude microscopy I: optical microscopy,”
J. Microsc. (Oxford), 206 194
–203
(2002). https://doi.org/10.1046/j.1365-2818.2002.01027.x 0022-2720 Google Scholar
P. J. McMahon,
E. D. Barone-Nugent,
B. E. Allman, and
K. A. Nugent,
“Quantitative phase-amplitude microscopy II: differential interference contrast imaging for biological TEM,”
J. Microsc. (Oxford), 206 204
–208
(2002). 0022-2720 Google Scholar
J. Rheinberg,
“On the influence on images of gratings of phase difference amongst their spectra,”
J. R. Microsc. Soc.,
(42), 388152
–390155
(19041905). 0368-3974 Google Scholar
T. Otaki,
“Artifact halo reduction in phase contrast microscopy using apodization,”
Opt. Rev., 7
(2), 119
–122
(2000). https://doi.org/10.1007/s10043-000-0119-5 1340-6000 Google Scholar
T. Otaki,
“Phase contrast observation device,”
(2001). Google Scholar
T. Otaki,
K. Katoh, and
F. Yoshida,
“Phase objects observing methods for video microscopy: apodized phase contrast, differential interference contrast with short shear and polarizing-microscope using liquid crystals,”
Electron Microsc., 37 105
–108
(2002). 0417-0326 Google Scholar
T. Otaki,
M. Suzuki, and
K. Katoh,
“Apodized phase contrast microscopy yields refined dynamic images of organelles in living cultured cells,”
43
–46
(2004). Google Scholar
K. Katoh,
T. Otaki, and
M. Suzuki,
“Dynamics of actin cytoskeleton revealed in living cells with a novel phase contrast system,”
Google Scholar
T. Otaki and
K. Katoh,
“Apodized phase-contrast microscopy, theory and images,”
98
(2006). Google Scholar
K. Katoh and
T. Otaki,
“Imaging living samples with apodized phase contrast microscopy, a novel phase contrast microscopy,”
64
(2006). Google Scholar
T. Otaki,
“Phase contrast microscope,”
(2006). Google Scholar
T. Otaki,
C. D. Howard, and
M. W. Davidson,
“Halo reduction with apodized phase contrast,”
http://www.microscopyu.com/articles/phasecontrast/apodized.html Google Scholar
C. L. Curl,
C. J. Bellair,
T. Harris,
B. E. Allman,
P. J. Harris,
A. G. Stewart,
A. Roberts,
K. A. Nugent, and
L. M. D. Delbridge,
“Refractive index measurement in viable cells using quantitative phase-amplitude microscopy and confocal microscopy,”
Cytometry, Part A, 65A
(1), 88
–92
(2005). 1552-4922 Google Scholar
C. L. Curl,
T. Harris,
P. J. Harris,
B. E. Allman,
C. J. Bellair,
A. G. Stewart, and
L. M. D. Delbridge,
“Quantitative phase microscopy: a new tool for measurement of cell culture growth and confluency in situ,”
Pfluegers Arch., 448
(4), 462
–468
(2004). 0031-6768 Google Scholar
Z. Hostounský and
R. Pelc,
“Phase-contrast versus off-axis illumination: is a more complex microscope always more powerful?,”
Adv. Physiol. Educ., 31
(2), 232
–235
(2007). http://advan.physiology.org/cgi/reprint/31/2/232 Google Scholar
Z. Hostounský,
“Osvětlovací soustava pro mikroskopické pozorování průhledných neabsorbujících objektů,”
(1996). Google Scholar
H. Kobayashi,
I. Ishimaru,
T. Yasokawa,
K. Ishizaki,
S. Kuriyama,
T. Masaki,
S. Nakai,
K. Takegawa, and
N. Tanaka,
“Three-dimensional phase-contrast imaging of single floating cells,”
Appl. Phys. Lett., 89
(24), 241117
(2006). https://doi.org/10.1063/1.2402229 0003-6951 Google Scholar
B. Lyot,
“Procédés permettant d’étudier les irrégularités d’une surface optique bien polie,”
C. R. Hebd. Seances Acad. Sci., 222
(14), 765
–768
(1946). 0001-4036 Google Scholar
A. Wilska,
“A new method of light microscopy,”
Nature (London), 171
(4347), 353
(1953). https://doi.org/10.1038/171353a0 0028-0836 Google Scholar
A. Wilska,
“Observations with the anoptral microscope,”
Mikroskopie, 9
(1/2), 1
–80
(1954). 0026-3702 Google Scholar
V. Soran and
B. Diaconeasa,
“The ultra-anoptral microscope—an improvement of Wilska’s method,”
Naturwiss., 44
(17), 465
–465
(1957). 0028-1042 Google Scholar
H. Beyer,
“Untersuchungen über den Einfluß der Gestalt der Aperturblende auf die mikroskopische Abbildung beim Phasenkontrastverfahren,”
Jenaer Jahrbuch 1953, 162
–209 VEB Carl Zeiss, Jena & VEB Gustav Fisher, Jena, Germany
(1953). Google Scholar
H. Beyer, Theorie und Praxis des Phasenkontrastverfahrens, 17 Akademische Verlagsgesellschaft Geest Portig K.-G., Leipzig
(1965). Google Scholar
M. L. Peshkov,
“A new type of objectives for anoptral microscopy, utilising an opening, and a brief analysis of the principle of their operation,”
Usp. Sovrem. Biol., 40
(3), 372
–378
(1955). 0042-1324 Google Scholar
J. Sun and
P. Perona,
“Where is the sun?,”
Nat. Neurosci., 1
(3), 183
–184
(1998). 1097-6256 Google Scholar
A. E. Welchman,
A. Deubelius,
V. Conrad,
H. H. Bülthoff, and
Z. Kourtzi,
“3D shape perception from combined depth cues in human visual cortex,”
Nat. Neurosci., 8
(6), 820
–827
(2005). 1097-6256 Google Scholar
G. K. Humphrey,
M. A. Goodale,
C. V. Bowen,
J. S. Gati,
T. Vilis,
B. K. Rutt, and
R. S. Menon,
“Differences in perceived shape from shading correlate with activity in early visual areas,”
Curr. Biol., 7
(2), 144
–147
(1997). https://doi.org/10.1016/S0960-9822(06)00058-3 0960-9822 Google Scholar
M. E. Sereno,
T. Trinath,
M. Augath, and
N. K. Logothetis,
“Three-dimensional shape representation in monkey cortex,”
Neuron, 33
(4), 635
–652
(2002). 0896-6273 Google Scholar
K.-I. Tsutsui,
H. Sakata,
T. Naganuma, and
M. Taira,
“Neural correlates for perception of 3D surface orientation from texture gradient,”
Science, 298
(5592), 409
–412
(2002). 0036-8075 Google Scholar
D. K. Hamilton,
C. J. P. Sheppard, and
T. Wilson,
“Improved imaging of phase gradients in scanning optical microscopy,”
J. Microsc. (Oxford), 135 275
–286
(1984). 0022-2720 Google Scholar
F. Bretschneider and
P. F. M. Teunis,
“Reduced-carrier single-sideband microscopy: a powerful method for the observation of transparent microscopic objects,”
J. Microsc. (Oxford), 175 121
–134
(1994). 0022-2720 Google Scholar
M. Pluta,
“Stereoscopic phase contrast microscope,”
Microscope, 16 32
–36
(1968). 0026-282X Google Scholar
H. Piller and
K. Weber,
“Device for alternately realizing the microscopic observation in phase contrast or in relief,”
(1983). Google Scholar
H. Takaoka,
“Optical microscope which has optical modulation elements,”
(2000). Google Scholar
J. Brief,
“Minimal dezentriert Phasenkontrast—eine sehr einfache methode zur Kontrast-verbesserung bei hoher Vergrößerung,”
Mikrokosmos, 94
(4), 203
–205
(2005). Google Scholar
J. Piper,
“Relief phasenkontrast—eine universell einsetzbare modifikation des phasenkontrast mit verbesserter Bildqualität,”
Mikrokosmos, 96
(4), 223
–229
(2007). Google Scholar
B. Hohman and
E. Keller,
“VAREL: a new contrasting method for microscopy,”
Biomed. Prod., 3
(2001) http://www.zeiss.com/micro Google Scholar
M. Erdelyi,
Z. Bor,
J. R. Cavallaro,
G. Szabo,
W. L. Wilson,
C. Sengupta,
M. C. Smayling, and
F. K. Tittel,
“Enhanced microlithography using combined phase shifting and off-axis illumination,”
Jpn. J. Appl. Phys., Part 2, 34 L1629
–L1631
(1995). 0021-4922 Google Scholar
P. Török,
C. J. R. Sheppard, and
Z. Laczik,
“Dark-field and differential phase contrast imaging modes in confocal microscopy using a half-aperture stop,”
Optik (Jena), 103
(3), 101
–106
(1996). 0030-4026 Google Scholar
K. K. Chu,
R. Yi, and
J. Mertz,
“Graded-field autoconfocal microscopy,”
Opt. Express, 15
(5), 2476
–2489
(2007). https://doi.org/10.1364/OE.15.002476 1094-4087 Google Scholar
M. R. Atkinson,
A. E. Dixon, and
S. Damaskinos,
“Surface-profile reconstruction using reflection differential phase-contrast microscopy,”
Appl. Opt., 31
(31), 6765
–6771
(1992). 0003-6935 Google Scholar
W. B. Amos,
S. Reichelt,
D. M. Cattermole, and
J. Laufert,
“Re-evaluation of differential phase contrast (DPC) in a scanning laser microscope using a split detector as an alternative to differential interference contrast (DIC) optics,”
J. Microsc. (Oxford), 210 166
–175
(2003). https://doi.org/10.1046/j.1365-2818.2003.01189.x 0022-2720 Google Scholar
S. H. Cody,
S. D. Xiang,
M. J. Layton,
E. Handman,
M. H. C. Lams,
J. E. Layton,
E. C. Nice, and
J. K. Heath,
“A simple method allowing DIC imaging in conjunction with confocal microscopy,”
J. Microsc. (Oxford), 217 265
–274
(2005). 0022-2720 Google Scholar
|


