
|
|
1.IntroductionFocal adhesions and close contacts play an important role in cellular motility, cellular adhesion, and signal transduction. Focal adhesions, also referred to as focal contacts or adhesion plaques, are strong adhesive sites used by cells to attach to an underlying substrate; their ability to do so is due to the large local concentration of binding proteins. Early use of natural fringe contrast microscopy in cell biology goes back to A. S. G. Curtis’s examination of how cells adhered to glass in 1964.1 An effort to improve the method by using an objective lens with high numerical aperture (NA) was implemented by Izzard and Lochner, while Gingell and Todd attempted to establish a theoretical basis for the quantification of cell substrate separation distances.2, 3 Despite extensive studies on focal contacts, it is still unknown whether the coverage area of focal contacts can determine the status of healthy and well-proliferating cells. The present letter presents the feasibility of multicontrast microscopy techniques to qualitatively examine the endothelial cell focal/close contact area changes under a cytotoxic medium. 2.MethodsSequential and complimentary use of interference reflection contrast microscopy (IRCM) and differential interference contrast microscopy (DICM) is presented to examine both the ventral surface and entire cell morphology, respectively. This multicontrast microscopy technique provided a more comprehensive examination of the dynamic cellular responses of live cells when exposed to a toxic agent. The focus of this study, in particular, was the qualitative examination of the change in focal and/or close contacts of live porcine pulmonary artery endothelial cells (PPAECs) under cytotoxic conditions. The recovery of the cell membrane and the reattachment of the cell to the substrate were also examined after the medium containing the cytotoxic agent had been replaced with a completely fresh medium. For a complete description of the methods used for culturing and maintaining the PPAECs, please see the referenced publication.4 A xenon light source/IRCM illuminator attached to an Olympus IX-71 inverted microscope was used to create the natural fringe patterns for imaging the ventral surface of a cell (Fig. 1 ). The fringe patterns of IRCM images are created by the interference of the two reflected rays, one ray from the coverslip–medium interface and the other ray from the medium–cell interface. In order to avoid obscuring fringes created with the low NA, the illuminating NA was controlled by adjusting the NA of the objective with the aperture iris fully open. Fig. 1A schematic of a multicontrast microscopy technique shows sequential and complementary use of DICM, PCM, and IRCM to comprehensively examine both ventral and dorsal cellular surfaces. The whole cell, including the dorsal surface of the two closely placed PPAECs, is examined using (a) DICM and (b) PCM. The field-of-view size of all images is . There are distinct higher-order fringes shown with the IRCM image taken with an (c) compared with that taken with an (d) where higher-order fringes are eliminated. Concentric fringes appear to be created along the nucleus and follow the general cell outline. The left arrow head mark shows the dark streak of a focal contact, and the right arrow head mark shows a close contact. [ is , which is the middle value of our filter specification (460 to 470); is 1.515, the refractive index of the glass; and NA is either 1.15 or 0.7.]  A plan apochromat oil immersion objective with adjustable NA was used for both IRCM5 and DICM6 imaging, and all images were captured using a electron multiplier charge coupled device (EMCCD) from Hammamatsu. A halogen light source, a plane polarizer, a condenser Nomarski prism, an objective Nomarski prism, and an analyzer were used for examining the whole cell including the dorsal surface, by way of DICM [Fig. 1a]. For phase contrast microscopy (PCM)4 imaging, all polarizers, prisms, and analyzers were also removed [Fig. 1b], and a condenser annulus ring was added to the light path. Also a new objective containing a phase plate (UPLFLN 02PH) replaced the objective used for DICM and IRCM. While both PCM and DICM can be used to examine the whole cell including the dorsal surface, PCM creates a halo around the cell boundary, making estimates of the cell-covered area less accurate. It should be noted that an incubator was attached to the microscope, which provided the same temperature and percent used for maintaining and culturing cells. Figures 1c and 1d show IRCM images of two neighboring PPAECs for an and depth-of-focus (DOF) of , and and DOF of , respectively. In order to effectively control the illuminating NA (INA), our aperture iris was set to be fully open and the NA of the objective lens was set at 1.15.It was observed that an NA of 1.3 was too bright and provided a very shallow depth of focus, while setting the NA below 1.0 obscures fringes because of multiple interferences reflected from the deeper region. For excessive DOF created by a small NA, the possibility of additional reflections from the nucleus and/or dorsal membrane can bias the cell–substrate gap information. In addition, the large DOF with low NA made it inevitable that higher-order fringes [Fig. 1c] would obscure the fringe analysis. The substantially reduced DOF for the higher NA prevented the multiple reflections and eliminated higher-order fringes [Fig. 1d]. Therefore, the use of a high NA objective retained only the zero-order fringes, allowing monotonic intensity variations correlating with the gap distance between the cell and substrate.5 3.Results and DiscussionFigure 2 shows the morphological evolution of live PPAECs before, during, and after the addition of of Cytochalasin D (cD) using DICM [Fig. 2a], IRCM [Fig. 2b], overlay of DICM and IRCM [Fig. 2c], IRCM contour mapping [Fig. 2d], and focal-contact area mapping [Fig. 2e]. Note that the images represent two contacting endothelial cells, where each cell is slender and relatively narrow when viewed separately. Fig. 2Analysis of DICM and IRCM images. (a) DICM images just before the addition of cD, and after replacement with cytotoxic medium, and approximately , , and after replacement with fresh medium. (b) The corresponding IRCM images. (c) Pseudo-color IRCM–DICM overlay images using green for IRCM images and red for DICM images. (d) The corresponding contours were created by separating pixels into bins of 1000 PGLs. (e) PGLs below 6500 were set to black on the IRCM images. The overlay images (c) and the corresponding contours provide qualitative information regarding ventral morphological changes in PPAECs under toxic and normal conditions. In order to prevent cell damage that can be caused by high-intensity illumination, both the halogen and xenon lamps were shuttered when images were not being taken. The field-of-view size of all images is .  The DICM images [Fig. 2a] show cell boundary shrinkage under cD, an agent widely known to disrupt the actin filament; they also show recovery following replacement with new fresh complete medium, as can be observed in Video 1 . The cells appeared relatively flat and spread across a large area before the addition of cD, while they become round near the nuclear area with large spikes protruding outward in response to the cytotoxic agent. The DICM images taken after replacement of the toxic medium showed that the cellular morphology returned to its original shape, i.e., flatter and more spread out. While DICM revealed the dynamic characteristics of the whole cell including the dorsal surface, additional information about the ventral surface was necessary to delineate the cellular fingerprint. Video 1DICM images showing the change in the dorsal surface of the cell before adding cD, during exposure to cD, and after replacement with complete medium (MPEG, ). 1 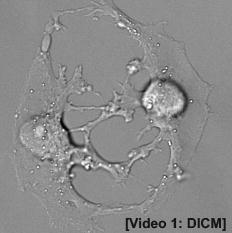 Figure 2b shows the corresponding IRCM images of the ventral surface. Before cD treatment, the focal contacts, representing the locations of the closest cell–substrate proximity, appeared as dark streaks; however, close contacts, areas slightly farther from the substrate, appeared broad and slightly less dark. The remaining areas represent larger cell-to-substrate distances and are brighter than both focal and close contacts. It should be noted that focal contacts are associated with the distal end of actin filament bundles and are known to have firm attachment structures holding the cell in place, while close contacts have relatively weak and highly dynamic adhesions to the substrate that can help sustain rapid movements of cells over the substrate. Upon administration of cD, the close contacts as well as the remaining brighter areas noticeably diminished in response to the cellular shrinkage and retraction caused by the toxic agent. Following replacement with new medium, both close contacts and brighter areas gradually recovered to reach the original distribution after about . However, the focal contacts remained largely unchanged throughout the experiment. The video created from the IRCM images, as seen in Video 2 , provides a quick look at changes in the ventral surface throughout the experiment. 10.1117/1.2993143.2The pseudo-color overlaid images, shown in Fig. 2c, allow comprehensive observation of both dorsal and overall cellular morphology changes, clearly showing the cell shrinkage/retraction and fingerprint changes. The IRCM contour mapping images [Fig. 2d] show pixel gray levels (PGLs) grouped into intensity bins of 1000. Darker PGL values are represented by blue, and brighter PGL values are represented by red. These images provide evidence that cD reduces close contact areas, while replacement with fresh nontoxic medium allows recovery to the cell’s initial levels. The focal contacts along the periphery of the cell remain largely unchanged despite the cytotoxic conditions. This is consistent with both ventral membrane retraction and cellular shrinkage/recovery. Figure 2e shows the contour map of PGLs below 6500, which is estimated to be the upper limit of focal contacts, as will be further discussed later in Fig. 3a . While the cell continually shrinks after the administration of cD and then recovers when replaced with fresh medium, focal contacts remain nearly unchanged. This may well suggest that focal contacts alone do not necessarily indicate the health of a cell exposed to a toxic agent. Fig. 3Focal contact analysis showing (a) the focal contact threshold , (b) the number of pixels below 6500 representing focal/close contacts, (c) the normalized cell-covered area, and (d) the ratio of focal/close contacts to the cell-covered area as a function of time. The range of PGL corresponding to the cell-substrate gap distance, , was set by the lower limit equivalent to the CCD camera dark noise and the higher limit equivalent to the maximum recorded intensity . (b) quantifies the focal and/or close contacts throughout the experiment, showing a rapid decrease just after addition of the drug, followed by a relatively constant value throughout the rest of the experiment. In (c), the normalized cell-covered area was calculated by dividing the total cell-covered area by the initial cell-covered area found just before administering the toxic agent. The cell-covered areas were obtained from the digital analysis of DICM images. (d) quantifies the ratio of the pixels below 6500 to the cell-covered area, showing that the focal contacts remain relatively constant. 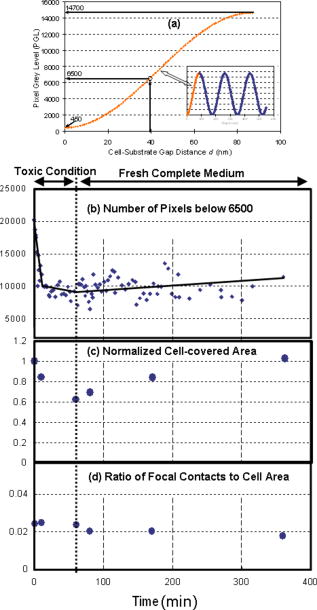 Figure 3a shows the predicted correlation between the PGL and the cell–substrate gap distance, . The natural interference fringe patterns are described by the equations7 where is the PGL intensity, is the ratio of the intensity of the reflected light to the incident light, is the reflectance, and is the wavelength in vacuum. The refractive indices used in this manuscript are 1.515, 1.33, and 1.36 for glass, medium, and cytoplasm of PPAECs, respectively. In the regard to these equations, the following assumptions are made: (1) the medium between cell and substrate is a nonabsorbing material, (2) the flux density of the incoming wave is the sum of the flux density reflected off the film and the total transmitted flux density for the multiple beam interference, and (3) the angle of transmitted light is perpendicular to the surface, which we acknowledge is a very limiting assumption.The minimum PGL value is set at 450, equivalent to the “dark noise” level of the CCD, while the maximum PGL value is set at 14,700, representing the highest intensity among all images. Assuming that the maximum PGL corresponds to the maximum gap detectable by zero-order fringes, i.e., , the PGL of 6500 is equivalent to a gap distance of . While there is controversy over the range in gap sizes for focal contacts, it is believed that is a fairly acceptable estimate for the upper limit of focal contacts.2 This is the rationale for allocating 6500 PGL for the range of focal contacts in Fig. 2e. Figure 3b shows the total number of pixels associated with focal contacts, . The focal contacts remained relatively unchanged during exposure to cD and after replacement with fresh medium. Note that the decay of focal contact area observed for the first few minutes is believed to be associated with the initial cell shrinkage in response to the toxic agent. The cell shrinkage under the toxic condition is evident in Fig. 3c by the change of the cell-covered area normalized by the initial coverage area. After replacement with fresh medium, the cell returned to an area approximately equal to its initial size. Figure 3d supports the conjecture that the ratio of focal contacts to the cell-coverage area remains nearly unchanged, while the cell-coverage area itself may go through shrinkage and recovery. Under toxic conditions, the similar changes of both focal contacts and cell-coverage areas result in almost constant area ratios. Upon replacement with fresh medium, however, the total coverage area increased gradually, while the focal contacts stayed at approximately the same level. This resulted in a slight decrease in the measured area ratio. Last, it should be noted that ECs grew in a monolayer fashion throughout all experiments. The first image before adding cD and the last image after replacing with fresh medium showed that the edges of cells moved freely, spreading outward from the cell/cell contact over time. This behavior is known to be common to endothelial cells. However, while under the cytotoxic condition, evidence of spreading was not observed. As a follow-up study to the presented result, examination of dose-dependency of cD has been conducted for 3, 4.5, 6, and . Although not shown here due to the space limitation, the results show that focal contacts tend to stay relatively well adhered for all the tested conditions, while other areas of the cell tend to retract and recover. It also appears that the rate of retraction of these other areas increases with increasing dosage. 4.ConclusionIn summary, the multicontrast microscopy technique, sequential and complimentary use of IRCM and DICM, was able to dynamically examine the ventral and overall cellular morphological changes of live cells (PPAECs) and showed that there was a relatively large, tightly adhered section that corresponds to cellular focal contacts. These focal contacts were also observed to remain resistant to Cytochalasin D. In particular, the ratio of focal contact area to the cell-covered area remained unchanged under the toxic conditions and during the recovery. Therefore, the focal contact area alone is not sufficient to determine the health of a cell. ReferencesA. S. G. Curtis,
“The mechanism of adhesion of cells to glass,”
J. Cell Biol., 20 199
–215
(1964). https://doi.org/10.1083/jcb.20.2.199 0021-9525 Google Scholar
C. S. Izzard and
L. R. Lochner,
“Cell-to-substrate contacts in living fibroblasts: an interference reflexion study with an evaluation of the technique,”
J. Cell. Sci., 21 129
–159
(1976). 0021-9533 Google Scholar
D. Gingell and
I. Todd,
“Interference reflection microscopy: a quantitative theory for image interpretation and its application to cell-substratum separation measurement,”
Biophys. J., 26 507
–526
(1979). 0006-3495 Google Scholar
C. K. Choi,
A. E. English,
K. D. Kihm, and
C. H. Margraves,
“Simultaneous dynamic optical and electrical properties of endothelial cell attachment on indium tin oxide bioelectrodes,”
J. Biomed. Opt., 12
(6), 064028
(2007). https://doi.org/10.1117/1.2821407 1083-3668 Google Scholar
H. Verschueren,
“Interference reflection microscopy in cell biology: methodology and applications,”
J. Cell. Sci., 75 279
–301
(1985). 0021-9533 Google Scholar
M. Mansuripur, Classical Optics and Its Applications, Cambridge University Press, New York
(2002). Google Scholar
E. Hecht, Optics, 4th ed.Addison Wesley, New York
(2002). Google Scholar
|


