
|
|
1.IntroductionThe formation of new blood vessels, angiogenesis, is a complex biological process that requires a successful interaction between many cellular and molecular components to generate mature, stable, and functional blood vessels.1 This vascularization process is of paramount importance in both disease and normal states.2, 3 To accomplish this process, soluble factors stimulate endothelial cells to proliferate, produce molecules that degrade extracellular matrix, migrate, avoid apoptosis, and finally differentiate and organize to form mature and functional new vascular tubes that are stabilized by the recruitment of smooth muscle cells known as pericytes.4 Angiogenesis can occur by one of the two known mechanisms: sprouting or intussusception, both resulting in increased vascular branching and vessel density.5 Different approaches have been used to evaluate angiogenesis.6 For example, the avian chorioalantoic membrane (CAM) model is one of the in vivo assays most widely used to study these biological phenomena. 6, 7, 8, 9, 10, 11, 12, 13, 14 The CAM model offers many advantages over other models, including easy access to the blood vessel network, function in low or absence of immunocompetence, shorter time frame for study completion, and no concern because of animal sacrifices. Additionally, this assay is relatively simple and inexpensive, and is suitable for large-scale screening. It is well known that vascular endothelial growth factor (VEGF) causes an increase in vascular density and branching in the CAM assay, and it is often viewed as the “gold standard” angiogenic factor.9, 13 A quantitative method has been developed10, 11, 12, 13, 14 to evaluate changes in vascular complexity and vascular density in response to angiogenic modulators in the CAM. This method uses computer-assisted image analysis of CAM obtained from ex ovo quail embryo cultures. The approach involves two morphometric techniques: (1) assessment of vascular complexity by measuring the space-filling vascular branching pattern with fractal dimension analysis and (2) evaluation of vascular density by the grid intersection method. The effects of proangiogenic molecules such as basic fibroblast growth factor (bFGF) and antiangiogenic molecules such as angiostatin have been quantified by these morphometric methods.10, 12 Discovered more than a decade ago, leptin, a product of the obese (ob) gene15 is a cytokine with multiple biological effects. 16, 17, 18, 19, 20, 21, 22 Leptin is expressed predominantly by adipocytes with an important role in energy balance.23 It is also known that leptin has mitogenic effects24, 25 and wound healing capabilities by acting as a potential proangiogenic factor on endothelial cells.26 It was recently demonstrated27 that leptin upregulates the expression of VEGF as well as its receptor VEGF-R2. In this paper we explore in detail the proangiogenic effects of leptin on a CAM model using two quantitative image-analysis methods. One method is based on ImageJ 1.30v software, and a second is a multiparametric computer-assisted method that we developed using the image processing toolbox of MATLAB® to measure more precisely other vascular parameters such as branching, length, diameter, and tortuousity. To quantify vascular density and complexity, we used fractal dimension and horizontal and vertical grid intersection analyses applied to CAM images. VEGF and anti-VEGF antibodies were used in these studies as positive and negative controls, respectively. The changes induced by leptin were qualitatively and quantitatively different from those induced by VEGF. Our results indicate that leptin increased the vascular density and vascular complexity in the CAM compared to controls. It also had an enhancing effect on tortuousity and overall vascular length in comparison to VEGF. The results reported herein also highlight the importance of measuring multiple parameters in the morphometric assessment of angiogenic modulators, which enabled us to quantify more precisely the proangiogenic effects of leptin and compare these effects with other proangiogenic molecules. 2.Methods2.1.Embryo CultureFertilized Japanese quail (Coturnix coturnix japonica) eggs (Boyd’s Bird Co., Pullman, Washington) were disinfected and incubated at under ambient atmosphere until E2.5. They were then opened under sterile conditions in a laminar flow hood, and each embryo was place in one well of a six-well cell culture cluster (Costar Inc., Corning, New York) and cultured further under the same conditions. 2.2.Embryo TreatmentSome of the embryos were kept without perturbation to evaluate the normal angiogenesis and these served as baseline controls. Other embryos were treated with phosphate-buffered saline (PBS), mouse leptin 4.0 and [AFP352C, National Hormone & Peptide Program, National Institute of Diabetes and Digestive and Kidney Diseases, National Institutes of Health (NIDDK, NIH)], rabbit polyclonal antibodies to mouse leptin at different dilutions (1:10, 1:100, 1:1000) (lot AFP3011199, National Hormone & Peptide Program, NIDDK, NIH), chicken leptin at different concentrations (0.1, 0.05, 0.025, 0.012, 0.006, and ) (lot AFP8942E, National Hormone & Peptide Program, NIDDK, NIH), and rabbit polyclonal antibodies to chicken leptin at different dilutions (1:500, 1:1000, 1:10000) (lot AFP1082300, National Hormone & Peptide Program, NIDDK, NIH). 3 Human recombinant VEGF-165 ( ) and (Genentech, Inc., San Francisco, California) and monoclonal antibodies to (lot 74839, G180CL, Genentech, Inc., San Francisco, California) were used as a positive and negative controls, respectively, in all the experiments. All of the substances used were prepared in a sterile laminar flow hood to the desired concentration and prewarmed at . Each treatment was prepared in a total volume of and was added gently onto each CAM at E7. 2.3.Fixation and Processing of the CAMAfter 24 of treatment, the embryos were fixed in situ with Karnovsky fixative (16% paraformaldehyde, 25% glutaraldehyde, and sodium phosphate) (Electron Microscopy Sciences, Hatfield, Pennsylvania), and allowed to fix for at least . The whole embryos were then taken out of their wells and placed in PBS for further dissection to separate the CAM from the rest of the embryo. Each CAM was carefully rinsed with PBS to flush out the blood within the veins. Arterial blood remained inside the vessels after the fixation. Then the edges of the CAM were dissected without affecting the midterminal zone of the arteries. Finally, each CAM was mounted onto a glass slide and covered with a glass coverslip or with Crystal Mount (Biomeda, Foster City, California). 2.4.Image AnalysisImages from the midterminal region of the CAM were acquired at , a magnification of , and a resolution of with a stereoscopic microscope (MZ 12.5, Leica, Bannockburn, Illinois) attached to a CCD camera (IN1120, Diagnostic Instruments, Inc., Sterling Heights, Michigan). We used two methods to analyze the images. In the first method, we evaluated the vascular complexity and density using the tools of ImageJ 1.30v software (Wayne Rasband National Institutes of Health; United States). Each image was converted to binary (black and white) and then the image was skeletonized. In the images taken with our system, each pixel corresponds to . The skeletonized images were analyzed by fractal dimension with the box-counting method. 6 This method overlays the image with a series of square boxes of decreasing size. The number of boxes that contain at least one black pixel is counted. The value of the slope of a squared regression yields value. The value was used as an indicator of vascular complexity that combines branching and tortuousity but does not discriminate among these two parameters. The method of grid intersection was used to evaluate vessel density with the same software28 (ImageJ, 1.30v). This method takes into account the number of intersections between a skeletonized vessel and a superimposed rectangular vertical and horizontal grid of spacing. We use a second method to quantify more precisely other vascular parameters such as vessel length, diameter, tortuousity, and branching. This image-analysis method consisted of a program that we developed based on the image processing toolbox of MATLAB® (The MathWorks, Natick, Massachusetts). An automatic-histogram-derived threshold selection, as proposed by Otsu,29 was used to obtain the CAM vascular binarization images. A sequential thinning method was then used to skeletonize images from the binarized vascular images (Fig. 1 ). The distance between each skeleton pixel in the skeletonized image and its nearest background pixel in the corresponding binarized image can be calculated based on Euclidean distances. In this method, the vascular radius of each skeleton/center pixel is equal to the corresponding , thus generating a diameter map. With this map, several measurements were evaluated, includins length, area, and average diameter of the vessels. For example, the length of a branch was defined as the total number of branch pixels after the preceding processing. Fig. 1Image processing of the CAM. The images were taken in a stereoscopic microscope at a magnification. Then, they were transformed to (a) gray scale, (b) binarized, and (c) skeletonized images before applying morphometry quantification. .  We obtained a node-structural map from every skeletonized vascular image. This node-structural map provided a functional tool for reconstructing the total vessel network and we could completely characterize the vascular organization by specifying the connectivity properties of each pixel. We also could evaluate the total number of branches (end nodes) and the degree of branching (furcation/junction nodes) in these regions as well as vessel tortuousity. The vessel tortuousity has been quantified in the vessels of the retina and is defined as the arc to chord ratio30, 31 (see Fig. 4 in Sec. 3.2). The arc length is defined as the length of the vessel section, and the chord length is the Euclidean distance between start point and endpoint of this vessel section. According the definition, the greater the ratio value, the greater the tortuousity.30, 31 Fig. 4Evaluation of vessel tortuousity based on the node-structure map. The vessel tortuousity is defined as the arc-to-chord ratio. The arc length is defined as the length of blood vessel section. The chord length is the ED between start point and endpoint of the blood vessel. According to the definition, the greater the ratio value, the greater the tortuousity.  3.Results3.1.Effect of Mouse Leptin, Chicken Leptin, and VEGF on CAMSimilarities between the chicken and mammalian leptin receptor genes have been reported.32 We treated the CAM with mouse leptin and chicken leptin (as proangiogenic factors) and the corresponding antimouse leptin and antichicken leptin antibodies (as antiangiogenic factors) to evaluate the angiogenic responses. The and anti-hVEGF effects were used as controls. The CAM treated with mouse leptin for showed a clear increase in vascular density, complexity, and tortuousity [Fig. 2b ] compared to the CAM controls [Fig. 2a]. An increase in vessel tortuousity and density was also observed in CAM treated with [Fig. 2c]. Antimouse leptin antibodies clearly diminished the vascular density and complexity [Fig. 2d] Quantification of these vascular parameters using morphometric measurements such as grid intersection and fractal dimension are shown in Fig. 3 . A significant increase in vessel density and complexity is evident with mouse leptin and in E8-E9 embryos compared to controls treated with PBS. These effects were totally repressed by antimouse leptin and anti-hVEGF antibodies. Surprisingly, when these antibodies were used directly, and alone, on the CAM, a decrease in these parameters was observed, particularly at higher concentrations. Fig. 2Effect of mouse leptin on CAM from E8-E9 embryos. Examples of some binarized CAM images captured at of magnification; (a) CAM without any treatment, (b) CAM treated with mouse leptin , (c) CAM treated with , and (d) CAM treated with antimouse leptin . .  Fig. 3Quantification of the effects of mouse leptin on CAM using the image tool box of ImageJ, 1.30v. Conventional vascular parameters were applied to CAM images. (a) Vascular density was measured applying grid intersection analysis and (b) vascular complexity was evaluated using fractal dimension analysis . Note: Cont, CAM controls without treatment; Lep, CAM treated with mouse leptin, , CAM treated with antibodies antimouse leptin; VEGF, CAM treated with VEGF; , CAM treated with antibodies antiVEGF; , ; and , .  Table 1 summarizes these results and data from those CAM treated with chicken leptin and antibodies antichicken leptin. A significant increase was observed in vascular complexity and density at lower concentrations of chicken leptin compared to mouse leptin . Those CAM treated with antichicken leptin antibodies alone also showed a significant decrease in vascular density and complexity compared to controls. Table 1Quantification of the effects of chicken leptin, antichicken leptin, hrVEGF165 , and anti-hVEGF (controls) on the quail CAM using conventional vascular parameters.
Each value represents
mean±SEM
(standard error of the mean);
n=50
samples for each treatment group;
*
,
P<0.05
;
**
,
P<0.001
. 3.2.Other Specific Vascular Parameters Measured on the CAMAs mentioned, mouse leptin and increased the vascular complexity and density in CAM. These vascular parameters have been measured previously using morphometric techniques.6, 10, 11, 12, 13, 14 To measure other vascular parameters for specific angiogenic changes such as vessel length, vessel diameter, branching, and tortuousity, we designed a new computer-assisted method, similar to the one used by Parsons-Wingerter 13 We used transformed images used in the binarized and skelenotized mode for these analyses. Based on the node-structure map that we developed with the software, we could easily evaluate the vessel length, diameter, branching, and tortuousity. As mentioned in Sec. 2, the vessel tortuousity is defined as the arc to chord ratio.30, 31 Figure 4 shows an example of two branches with different tortuousity. The arc length is defined as the branch length of the vessel and the chord length is the Euclidean distance (ED) between start point and endpoint of that branch. By this definition, the radio will be greater in those vessels that exhibit more tortuousity. Figure 5 shows the results of the image quantification of the vascular parameters already mentioned in those CAM treated with mouse leptin, antimouse leptin, and anti-hVEGF. Table 2 summarizes the results obtained using chicken leptin, antichicken leptin, , and anti-hVEGF on CAM. Mouse leptin increased the total vascular length [Fig. 5a] along with a decrease in vessel diameter [Fig. 5b]. Similar results were observed in those CAM treated with . Antimouse leptin and anti-hVEGF antibodies significantly decreased the vascular length without any modification in the vascular average diameter [Figs. 5a and 5b]. Chicken leptin also increases the total vascular length and decreases the average diameter of CAM blood vessels (Table 2). Antichicken leptin affects only the total vascular length. Fig. 5Quantification of specific vascular parameters on CAM treated with different angiogenic and antiangiogenic factors using the image processing toolbox of MATLAB®: (a) total vessel length, (b) vascular diameter, (c) tortuousity, and (d) vascular branching (end and furcation branch number) were measured with this method ( , ; , ). 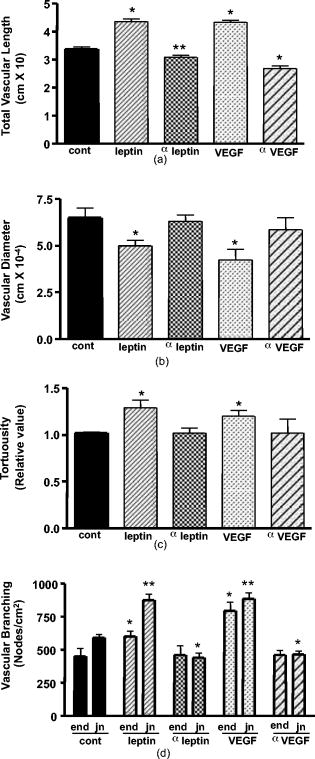 Table 2Quantification of the effects of chicken leptin, antichicken leptin, hrVEGF165 and anti-hVEGF (controls) on quail CAM using other specific vascular parameters.
Each value represents
mean±SEM
;
n=50
samples for each treatment group,
*
,
P<0.05
;
**
,
P<0.001
. A tortuousity pattern was evident in most of the first-, second-, and third-generation blood vessels treated with mouse leptin and [see Figs. 2b and 2c]. A increase in tortuousity was observed in CAM treated with mouse leptin, chicken leptin, and [Fig. 5c and Table 2]. The vessel tortuousity was more dramatic in those CAM treated with mouse and chicken leptin [Fig. 2b, Table 2]. Antimouse leptin, anti-hVEGF, and antichicken leptin antibodies had no effect on vessel tortuousity [Fig. 5c, Table 2]. A drastic effect in the formation of end nodes, which represent terminal branches, and furcation nodes, which represent emerging branches, was observed after treatment with mouse leptin, chicken leptin, and [Fig. 5d, Table 2]. Antimouse leptin, antichicken leptin, and anti-hVEGF antibodies produced a significant decrease, however, in the number of furcation nodes. No changes were observed in the number of end nodes. 4.DiscussionThe formation of new and functional blood vessels is a dynamic process that requires the participation of factors and cells that interact harmoniously.4 Because angiogenesis is critical in both normal and pathological conditions, it is essential to use new methodologies for quantification of the effects of pro- and antiangiogenic factors for a deeper understanding of their possible role in vivo. Many in vitro and in vivo models have been proposed to study the angiogenic responses to several angiogenic factors and cytokines. 6, 7, 10, 11, 12, 13, 14, 33 Angiogenesis can occur by sprouting and/or intussusception.5 These mechanisms increase the complexity and the number of branches of the developing vessel network.5 It has been demonstrated that leptin is able to stimulate human endothelial cell proliferation and stimulate angiogenesis in vivo and in vitro.26, 34 Leptin is a circulating hormone that regulates adipose tissue mass through hypothalamic effects on satiety and energy expenditure.35 Whereas adipose tissue is considered to be the key site for leptin production, this cytokine is also produced in actively angiogenic tissues such as placenta and fetal tissues such as heart, bone, and hair follicles, suggesting an important role in neovascularization in these tissues.36 However, the mechanisms through which leptin increase the vascular density and complexity during angiogenesis are not fully characterized. In this work, we designed a program based on the image-processing toolbox of MATLAB® to measure additional vascular parameters such as vessel length, diameter, branching, and tortuousity to study in more detail the effects of mouse leptin, chicken leptin, , and neutralizing antibodies against these cytokines on a CAM model. In this paper, we have demonstrated that leptin induces an increase in vascular complexity and density. The proangiogenic effects of leptin quantified in our CAM model may be the result of a direct effect of leptin in vascular receptors, and/or an indirect effect through the activation of VEGF or a synergistic activity with VEGF or bFGF (Refs. 37, 38, 39). The increase in these parameters may be made possible by two known mechanisms: sprouting and intussusception.5 The increase in vascular length along with the decrease in vascular diameter support the idea of an intussusception mechanism exerted by leptin in a quail CAM model. This nonsprouting angiogenesis has been demonstrated40 in chicken CAM. This idea is also supported by the fact that antileptin and anti-VEGF antibodies decreased the junction nodes (sites where intussusception may take place for division of larger branches) without affecting the end nodes (distal terminal branches growing by a possible sprouting mechanism). Leptin and increased the end node number, suggesting an angiogenic effect by the sprouting mechanism. However, the increase in the end node number was more dramatic with , suggesting that this cytokine stimulates the sprouting mechanism more than leptin. Therefore, it is possible that leptin stimulates angiogenesis through the intussusception mechanism, while VEGF may increase density and complexity by both intussusception and sprouting processes. The sprouting mechanism implies endothelial cell proliferation, which has been widely demonstrated41 as an effect of VEGF. Neutralizing antibodies, antimouse leptin, and antichicken leptin inhibited the vascular density, complexity, and length and had no effect on vascular diameter. This fact suggests that the antibodies may inhibit the intussusception mechanism without affecting the sprouting mechanism, which could be regulated for more than one proangiogenic factor. This also suggests40 that intussusception may be the main angiogenic process during the development of a nondisturbed CAM. The vascular density inhibited in normal CAM using antileptin suggests a possible role of endogenous leptin during normal maturation of the vascular network. This antileptin effect could also affect proangiogenic molecules that act synergistically with leptin such as VEGF (Refs. 13, 37, 39). Most of the CAM treated with leptin showed a change in the vessel morphology. The tortuousity induced by leptin was more evident than that observed after treatment with . These alterations induced by leptin will require further analysis to understand the biological significance; however, it is possible that this morphology is the result of the effects of molecules that modify the extracellular matrix.42 This fact also suggests a direct effect of leptin not mediated by VEGF since treatment with this cytokine was less dramatic in vessel tortuousity. In this work, a node-structural map was developed that can be easily derived from skeletonized images. Based on such node-structural maps and thickness maps, angiogenically significant multiparameter measurements such as morphometrics, structure, and branch generation can be implemented and evaluated. In addition, the quantitative method described here was used as an important tool to discriminate between effects of proangiogenic and antiangiogenic molecules. Through this analysis, we evaluated some of the proangiogenic effects of leptin in vivo. Further studies involving the interactions between this cytokine and other pro- and antiangiogenic molecules will be necessary for a better understanding of its biological effects on the differentiation and maturation of functional blood vessels. AcknowledgmentsWe thank Phillip Huff for laboratory assistance. This work was supported by the National Institutes of Health (NIH) Grant No. 1R01GM66292-01A1 to MRSH and the U.S. Navy Bureau of Medicine and Surgery Grant No. CSR200121 to DLF. We also acknowledge NIDDK’s National Hormone & Peptide Program and A. F. Parlow for the biologic reagents provided. ReferencesW. Risau,
“Mechanisms of angiogenesis,”
Nature, 386
(6626), 671
–674
(1997). https://doi.org/10.1038/386671a0 0028-0836 Google Scholar
D. Hanahan and
J. Folkman,
“Patterns and emerging mechanisms of the angiogenic switch during tumorigenesis,”
Cell, 86
(3), 353
–364
(1996). https://doi.org/10.1016/S0092-8674(00)80108-7 0092-8674 Google Scholar
D. Hanahan,
“Signaling vascular morphogenesis and maintenance,”
Science, 277
(5322), 48
–50
(1997). https://doi.org/10.1126/science.277.5322.48 0036-8075 Google Scholar
R. Muñoz-Chápuli,
A. R. Quesada, and
M. Angel Medina,
“Angiogenesis and signal transduction in endothelial cells,”
Cell. Mol. Life Sci., 61
(17), 2224
–2243
(2004). 1420-682X Google Scholar
V. Djonov,
O. Baum, and
P. H. Burri,
“Vascular remodeling by intussusceptive angiogenesis,”
Cell Tissue Res., 314
(1), 107
–117
(2003). https://doi.org/10.1007/s00441-003-0784-3 0302-766X Google Scholar
L. M. Kirchner,
S. P. Schmidt, and
B. S. Gruber,
“Quantitation of angiogenesis in the chick chorioallantoic membrane model using fractal analysis,”
Microvasc. Res., 51
(1), 2
–14
(1996). https://doi.org/10.1006/mvre.1996.0002 0026-2862 Google Scholar
M. Nguyen,
Y. Shing, and
J. Folkman,
“Quantitation of angiogenesis and antiangiogenesis in the chick embryo chorioallantoic membrane,”
Microvasc. Res., 47
(1), 31
–40
(1994). https://doi.org/10.1006/mvre.1994.1003 0026-2862 Google Scholar
D. Ribatti,
A. Vacca,
L. Roncali, and
F. Dammacco,
“The chick embryo chorioallantoic membrane as a model for in vivo research on angiogenesis,”
Int. J. Dev. Biol., 40
(6), 1189
–1197
(1996). 0214-6282 Google Scholar
H. Kurz,
S. Ambrosy,
J. Wilting,
D. Marmé, and
B. Christ,
“Proliferation pattern of capillary endothelial cells in chorioallantoic membrane development indicates local growth control, which is counteracted by vascular endothelial growth factor application,”
Dev. Dyn., 203
(2), 174
–186
(1995). 1058-8388 Google Scholar
P. Parsons-Wingerter,
B. Lwai,
M. C. Yang,
K. E. Elliott,
A. Milaninia,
A. Redlitz,
J. I. Clark, and
E. H. Sage,
“A novel assay of angiogenesis in the quail chorioallantoic membrane: stimulation by bFGF and inhibition by angiostatin according to fractal dimension and grid intersection,”
Microvasc. Res., 55
(3), 201
–214
(1998). 0026-2862 Google Scholar
P. Parsons-Wingerter,
K. E. Elliott,
A. G. Farr,
K. Radhakrishnan,
J. I. Clark, and
E. H. Sage,
“Generational analysis reveals that TGF-beta1 inhibits the rate of angiogenesis in vivo by selective decrease in the number of new vessels,”
Microvasc. Res., 59
(2), 221
–232
(2000). 0026-2862 Google Scholar
P. Parsons-Wingerter,
K. E. Elliott,
J. I. Clark, and
A. G. Farr,
“Fibroblast growth factor-2 selectively stimulates angiogenesis of small vessels in arterial tree,”
Arterioscler., Thromb., Vasc. Biol., 20
(5), 1250
–1256
(2000). 1079-5642 Google Scholar
P. Parsons-Wingerter,
U. M. Chandrasekharan,
T. L. McKay,
K. Radhakrishnan,
P. E. DiCorleto,
B. Albarran, and
A. G. Farr,
“VEGF165-induced phenotypic switch from increased vessel density to increased vessel diameter and increased endothelial NOS activity,”
Microvasc. Res., 72
(3), 91
–100
(2006). 0026-2862 Google Scholar
T. L. McKay,
D. J. Gedeon,
M. B. Vickerman,
A. G. Hylton,
D. Ribita,
H. H. Olar,
P. K. Kaiser, and
P. Parsons-Wingerter,
“Selective inhibition of angiogenesis in small blood vessels and decrease in vessel diameter throughout the vascular tree by triamcinolone acetonide,”
Invest. Ophthalmol. Visual Sci., 49
(3), 1184
–1190
(2008). 0146-0404 Google Scholar
Y. Zhang,
R. Proenca,
M. Maffel,
M. Barone,
L. Leopold, and
J. M. Friedman,
“Positional cloning of the mouse obese gene and its human homologue,”
Nature, 372
(6505), 425
–432
(1994). 0028-0836 Google Scholar
Y. Zhang,
R. Proenca,
M. Maffel,
M. Barone,
L. Leopold, and
J. M. Friedman, Nature, 374
(6521), 479
(1995). https://doi.org/10.1038/374479a0 0028-0836 Google Scholar
J. Harvey and
M. L. Ashford,
“Leptin in the CNS: much more than a satiety signal,”
Neuropharmacology, 44
(7), 845
–854
(2003). 0028-3908 Google Scholar
J. A. Cioffi,
A. W. Shafer,
T. J. Zupancic,
J. Smith-Gbur,
A. Mikhail,
D. Platika, and
H. R. Snodgrass,
“Novel B219/OB receptor isoforms: possible role of leptin in hematopoiesis and reproduction,”
Nat. Med., 2
(5), 585
–589
(1996). 1078-8956 Google Scholar
T. Gainsford,
T. A. Willson,
D. Metcalf,
E. Handman,
C. McFarlane,
A. Ng,
N. A. Nicola,
W. S. Alexander, and
D. J. Hilton,
“Leptin can induce proliferation, differentiation, and functional activation of hemopoietic cells,”
Proc. Natl. Acad. Sci. U.S.A., 93
(25), 14564
–14568
(1996). 0027-8424 Google Scholar
S. G. Hassink,
E. de Lancey,
D. V. Sheslow,
S. M. Smith-Kirwin,
D. M. O’Connor,
R. V. Considine,
I. Opentanova,
K. Dostal,
M. L. Spear,
K. Leef,
M. Ash,
A. R. Spitzer, and
V. L. Funanage,
“Placental leptin: an important new growth factor in intrauterine and neonatal development?,”
Pediatrics, 100
(1), E1
(1997). https://doi.org/10.1542/peds.100.1.e1 0031-4005 Google Scholar
N. Hoggard,
L. Hunter,
J. S. Duncan,
L. M. Williams,
P. Trayhurn, and
J. G. Mercer,
“Leptin and leptin receptor mRNA and protein expression in the murine fetus and placenta,”
Proc. Natl. Acad. Sci. U.S.A., 94
(20), 11073
–11078
(1997). 0027-8424 Google Scholar
N. Hoggard,
L. Hunter,
P. Trayhurn,
L. M. Williams, and
J. G. Mercer,
“Leptin and reproduction,”
Proc. Nutr. Soc., 57
(3), 421
–427
(1998). 0029-6651 Google Scholar
F. F. Chehab,
K. Mounzih,
R. Lu, and
M. E. Lim,
“Early onset of reproductive function in normal female mice treated with leptin,”
Science, 275
(5296), 88
–90
(1997). 0036-8075 Google Scholar
J. M. Friedman and
J. L. Halaas,
“Leptin and the regulation of body weight in mammals,”
Nature, 395
(6704), 763
–770
(1998). 0028-0836 Google Scholar
P. Somasundar,
D. W. McFadden,
S. M. Hileman, and
L. Vona-Davis,
“Leptin is a growth factor in cancer,”
J. Surg. Res., 116
(2), 337
–349
(2004). 0022-4804 Google Scholar
X. Hu,
S. C. Juneja,
N. J. Maihle, and
M. P. Cleary,
“Leptin—a growth factor in normal and malignant breast cells and for normal mammary gland development,”
J. Natl. Cancer Inst., 94
(22), 1704
–1711
(2002). 0027-8874 Google Scholar
M. R. Sierra-Honigmann,
A. K. Nath,
C. Murakami,
G. García-Cardeña,
A. Papapetropoulos,
W. C. Sessa,
L. A. Madge,
J. S. Schechner,
M. B. Schwabb,
P. J. Polverini, and
J. R. Flores-Riveros,
“Biological action of leptin as an angiogenic factor,”
Science, 281
(5383), 1683
–1686
(1998). 0036-8075 Google Scholar
R. R. Gonzalez,
S. Cherfils,
M. Escobar,
J. H. Yoo,
C. Carino,
A. K. Styer,
B. T. Sullivan,
H. Sakamoto,
A. Olawaiye,
T. Serikawa,
M. P. Lynch, and
B. R. Rueda,
“Leptin signaling promotes the growth of mammary tumors and increases the expression of vascular endothelial growth factor (VEGF) and its receptor type two (VEGF-R2),”
J. Biol. Chem., 281
(36), 26320
–26328
(2006). 0021-9258 Google Scholar
M. J. Rieder,
D. M. O’Drobinak, and
A. S. Greene,
“A computerized method for determination of microvascular density,”
Microvasc. Res., 49
(2), 180
–189
(1995). 0026-2862 Google Scholar
N. Otsu,
“A threshold selection method from gray-level histograms,”
IEEE Trans. Syst. Man Cybern., 9 62
–66
(1979). https://doi.org/10.1109/TSMC.1979.4310076 0018-9472 Google Scholar
W. Hsu,
M. L. Lee, and
K. G. Goh,
“Image mining in IRS: integrated retinal information system (demo),”
(2000). Google Scholar
W. Hsu,
M. L. Lee,
B. C. Ooi,
P. K. Mohanty,
K. L. Teo, and
C. Xia,
“Advanced database technologies in a diabetic helthcare system,”
(2002). Google Scholar
G. Horev,
P. Einat,
T. Aharoni,
Y. Eshdat, and
M. Friedman-Einat,
“Molecular cloning and properties of the chicken leptin-receptor (CLEPR) gene,”
Mol. Cell Endocrinol., 162
(1–2), 95
–106
(2000). 0303-7207 Google Scholar
A. A. Ucuzian and
H. P. Greisler,
“In vitro models of angiogenesis,”
World J. Surg., 31
(4), 654
–663
(2007). 0364-2313 Google Scholar
A. Bouloumié,
H. C. Drexler,
M. Lafontan, and
R. Busse,
“Leptin, the product of Ob gene, promotes angiogenesis,”
Circ. Res., 83
(10), 1059
–1066
(1998). 0009-7330 Google Scholar
S. Margetic,
C. Gazzola,
G. G. Pegg, and
R. A. Hill,
“Leptin: a review of its peripheral actions and interactions,”
Int. J. Obes. Relat. Metab. Disord., 26
(11), 1407
–1433
(2002). 0307-0565 Google Scholar
P. Trayhum,
N. Hoggard,
J. G. Mercer, and
D. V. Rayner,
“Leptin: fundamental aspects,”
Int. J. Obes. Relat. Metab. Disord., 23
(Suppl. 1), 22
–28
(1999). 0307-0565 Google Scholar
R. Cao,
E. Brakenhielm,
C. Wahlestedt,
J. Thyberg, and
Y. Cao,
“Leptin induces vascular permeability and synergistically stimulates angiogenesis with FGF-2 and VEGF,”
Proc. Natl. Acad. Sci. U.S.A., 98
(11), 6390
–6395
(2001). 0027-8424 Google Scholar
E. Suganami,
H. Takagi,
H. Ohashi,
K. Suzuma,
I. Suzuma,
H. Oh,
D. Watanabe,
T. Ojima,
T. Suganami,
Y. Fujio,
K. Nakao,
Y. Ogawa, and
N. Yoshimura,
“Leptin stimulates ischemia-induced retinal neovascularization: possible role of vascular endothelial growth factor expressed in retinal endothelial cells,”
Diabetes, 53
(9), 2443
–2448
(2004). 0012-1797 Google Scholar
K. A. Frankenberry,
P. Somasundar,
D. W. McFadden, and
L. C. Vona-Davis,
“Leptin induces cell migration and the expression of growth factors in human prostate cancer cells,”
Am. J. Surg., 188
(5), 560
–565
(2004). 0002-9610 Google Scholar
S. Patan,
M. J. Alvarez,
J. C. Schittny, and
P. H. Burri,
“Intussusceptive microvascular growth: a common alternative to capillary sprouting,”
Arch. Histol. Cytol., 55
(Suppl.), 65
–75
(1992). 0914-9465 Google Scholar
M. Byrne,
D. J. Bouchier-Hayes, and
J. H. Harmey,
“Angiogenic and cell survival functions of vascular endothelial growth factor (VEGF),”
J. Cell. Mol. Med., 9
(4), 777
–794
(2005). Google Scholar
M. Castellucci,
R. De Matteis,
A. Meisser,
R. Cancello,
V. Monsurrò,
D. Islami,
R. Sarzani,
D. Marzioni,
S. Cinti, and
P. Bischof,
“Leptin modulates extracellular matrix molecules and metalloproteinases: possible implications for trophoblast invasion,”
Mol. Hum. Reprod., 6
(10), 951
–958
(2000). 1360-9947 Google Scholar
|


