
|
|
1.IntroductionManipulation of micron- and submicron-size matter by optical forces from a single laser beam has been a subject of continuing interest after its first demonstration by Ashkin 1 The possibility of contactless manipulation under physiological conditions has widespread implications in biology, and consequently, the optical trap has been extensively used for manipulation of cells.2 Deformability of red blood cells (RBCs) and their properties, such as like membrane elasticity, are of long standing interest. Changes in the RBC deformability exhibit a strong correlation with several blood disorders. Deformability of RBC population is currently measured using automated rheoscopes and ektacytometers.3, 4, 5 Changes in deformability of a single RBC are assessed through micropipette aspiration,6 automated rheoscopes,7 and with optical traps using two beads fixed on either side of an RBC.8 Each of these single-cell techniques is cumbersome, especially if one needs to study a small, specific subset of the population. Whether through automated rheoscopes or through bead entrapment, the measurements can currently be made only for a random subset of cells. In previous work on the optical trapping of healthy and malaria-infected (Plasmodium falciparum) RBCs,9 we have shown that as an RBC moves toward the laser focus, trapping occurs; this is accompanied by shape distortion (buckling) such that the original disklike RBC buckles, by folding action, into a rodlike shape. On removal of the laser light, the cell unfolds to its original biconcave shape.10 Our particular interest is to probe the trapping characteristics of healthy and malaria-infected RBCs. Single-cell studies of normal and Plasmodium-infected RBCs have assumed considerable importance in recent years.11 It is established that malaria-induced organ failure is associated with capillary blockage and the enhanced rigidity of infected RBCs. Elastometric microchannels of micron-sized diameters have been utilized to establish differences in deformability of normal and infected RBCs.11 We have succeeded in combining a liquid flow cell with a laser optical trap and a fluorescent set up to measure the shear modulus of fluorescence-labeled RBCs, both healthy and malaria-infected, under liquid flow conditions. We describe here a simple technique “optical trap-assisted folding-unfolding of RBC” (OTAFUR) to analyze the buckling-unbuckling behavior of specific single RBCs. The OTAFUR value in Folding (F) (in milliseconds) and unfolding (UF) (in seconds) are measures of the intrinsic deformability and recovery of a single RBC. The UF-recovery parameter, in particular, is independent of any flow or shear stress and measured without having to immobilize the RBC on any solid surface. Although all the previous experiments (see Refs. 3, 4, 5, 6, 7, 8, and references therein) have yielded useful information on cell deformability, we present here an alternative experimental approach that has a direct link to the mechanical properties of cell membranes. The efficacy of the method is illustrated by studying (i) the buckling behavior of normal and Plasmodium-infected red blood cells and (ii) the effect of P. falciparum–conditioned medium on normal, uninfected cells. Specifically, we have utilized optically induced folding and unfolding times of single cells as a measureable parameter with a mechanical connection to examine the deformation rate of the cell under a constant load and its subsequent relaxation/recovery time when the load is removed. 2.Experimental Details2.1.Optical Trap and Flow Cell SetupThe experimental set up is shown in Fig. 1 . We use single-beam optical tweezers to trap RBCs under both static and flow conditions. Our tweezers setup has been described earlier.10 In brief, it consists of a Nd:YAG laser with a beam that is expanded to . This beam is coupled to an inverted microscope (Nikon TE 2000U) that is equipped with a fluorescence attachment. Trapping of a single cell is achieved using either a 100X oil-filled objective or a 60X long-working-distance objective. Typical values of laser power measured using an integrating sphere after the objective are in the present series of experiments (variation of cell folding and unfolding with laser power has been characterized by us in an earlier study12). A CCD camera is used to capture the cell trapping events in the form of a real-time movie interfaced to a computer. The RBCs are placed either on a cover slip (static case) or in a parallel-plate liquid flow cell mounted on a translation stage attached to the microscope (Fig. 1). Care was taken to ensure that the trapped cells were always in the same focal plane ( above the cover slip), ensuring constant trapping force at each instant. The flow cell was constructed using a glass slide of dimensions and a cover slip of dimensions , with thick spacers in-between to form the flow channel. The effective inner dimensions of the flow channel were . A peristaltic pump (Pharmacia LKB-Pump P-1) was used to maintain continuous flow of the red cell suspension through the chamber at a constant flow of . The fluid flow was laminar, and the Reynolds value was typically of order . 2.2.Sample PreparationAsexual stages of P. falciparum 3D7 strain were maintained in vitro in 5% hematocrit in Roswell Park Memorial Institute (RPMI) 1640 medium containing 0.5% albumax and gentamycin sulphate in a humidified chamber containing 5% at in human RBCs of serological type . To obtain synchronized cultures, sorbitol treatment was performed.13 The P. berghei ANKA and P. yoelli strains were maintained by passaging asexual stages through BALB/c mice. Tail bleeds were collected from mice showing approximately 20–40% peripheral blood parasitemia, and diluted 1:10 in incomplete RPMI. About of this dilution was injected intraperitoneally into naïve BALB/c mice for the expansion of parasites. Parasitemia was monitored by microscopic examination of blood smears stained with Giemsa. Blood samples from humans and mice were collected in a sterile tube containing the anticoagulant ACD ( glucose; citric acid monohydrate and sodium citrate) and centrifuged at for . The plasma and buffy coat containing white blood cells were aspirated out and purified RBCs were washed with sterile RPMI (Life Technologies, Inc.) medium with , HEPES, and gentamycin sulphate. The RBCs were resuspended in sterile RPMI medium containing 0.5% albumax (Life Technologies, Inc.) as a 50% v/v suspension, and diluted for use. In case of P. berghei–and P. yoelli–containing samples, normal RBCs (NRBCs) were obtained from uninfected mice and infected RBCs (IRBCs) from infected mice. Before running in the flow cell, cells were incubated with DAPI in either PBS or RPMI for , pelleted at , and resuspended in phosphate-buffered saline with 1% bovine serum albumin (BSA). Cells were used at a concentration of . 2.3.Conditioned MediumIRBCs were synchronized by sorbitol treatment. Freshly treated IRBCs were cultured at 5% haematocrit and 1% parasitemia as described above. After every , the spent medium was collected after the cells settled down and fresh medium was added. The spent medium collected was pelleted at for ; the pH was adjusted to 7.4 and was filter sterilized. This medium was called conditioned medium (CM). For the experiment, fresh NRBCs were incubated for each in CM from different stages. As a control, NRBCs were kept in CRPMI. After , all sets of RBCs were washed and incubated for another in CRPMI. 2.4.Assessment of Folding and UnfoldingFor folding and unfolding analysis, the RBCs were stained with DAPI, washed twice in RPMI and diluted to in complete RPMI (CRPMI). During the experiment, about of suspension was placed on a coverslip. Infected cells were identified by strong fluorescence in UV light . Typically, an RBC in the vicinity of the trap experiences an attractive force, causing it to move toward the trap focus and subsequently deforms (folds) into a rod shape. Furthermore, when the trap is removed by blocking the laser beam path, the RBC regains its original shape by unfolding. These events were recorded for several RBCs. Subsequent analysis was done by converting the videos to frames and counting the number of frames taken to fold. Unfolding, which takes several seconds could also be typically measured using real-time movies captured by a CCD camera. 2.5.Statistical AnalysisThe data sets were first checked for normality by Kolmogorov and Smirnov’s method. Most of them failed the normality test; hence, significance testing was done using the Kruskal–Wallis test followed by Dunn’s nonparametric test. The data sets that passed the normality test (shear modulus experiment and unfolding data in the P. yoelli experiment) were further tested using one-way ANOVA followed by Tukey–Kramer’s multiple comparison tests. All tests were two tailed. The statistical significance of our data is quantified in terms of values. 3.Results and DiscussionWe have earlier proposed a model based on Euler buckling that rationalizes the experimentally observed folding and unfolding of RBCs that occur upon their placement in an optical trap.12 Such buckling phenomena have been related to the elastic properties of the cell membrane; the model successfully predicts that folding actions occur much more rapidly than unfolding and also establishes the functional relationship between folding time and incident laser power.12 However, there is, as yet, no simple formulation of how such buckling phenomena might be related to the shear modulus of the RBC. Here, we investigate the folding and unfolding behavior of NRBCs, parasite-infected RBCs (PRBCs), and uninfected RBCs (URBCs) within an infected population under flow conditions. URBCs represent those uninfected RBCs that are exposed to PRBCs, while NRBCs are RBCs that have never been exposed to PRBCs. Infected cells were labeled with DAPI, a membrane-permeable fluorescent nuclear dye. Control experiments on a population of infected and uninfected RBCs conducted with and without DAPI did not reveal any change in the buckling phenomena. Initially, a gentle flow with a fluorescence scan is used for sampling of appropriate red cells. Once a desirable cell is viewed, the cell is trapped by switching on the laser trapping field. The flow is then stopped, and the folding (F) and unfolding (UF) time-values are measured. Figure 2a shows the folded RBC. Unfolding occurs upon removal of the laser trapping field. These F and UF values are robust and do not change for up to of trapping and untrapping of the same RBC, repeatedly. Typical F and UF states of a normal RBC are shown in Fig. 2b, Video 1, and Video 2 The intraerythrocytic stages of the human malaria parasite P. falciparum take to complete one cycle as they progress through ring, trophozoite, and schizont stages. Fig. 2(a) Schematic of the combined setup. The rectangular box represents a cross section of the parallel-plate flow chamber. Red cells are flowed through the flow cell. Filled arrow shows direction of flow. The focus of the optical trap is at above the flow-cell surface. RBC flowing at this level gets trapped and folds in an optical trap. The asterisk shows the image of a folded RBC, where the focus of the laser trap is visible as a white spot. The vertical arrow indicates the direction of laser light and the center of the light gradient. (b) Images of normal human RBCs at different time points during folding (F) and unfolding (UF) (for a movie clip showing cell folding, see Video 1; for a movie clip showing cell unfolding, see Video 2). (c) Images of (trophozoite stage) parasitized RBC at different time points during folding (F) and unfolding (UF). 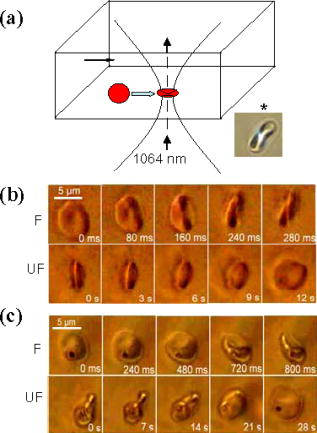 Video 1Real-time movie clip of a single, healthy, human red blood cell undergoing folding action as soon as the laser optical trap is switched on. Note that the other two cells in the frame simply undergo Brownian-like motion, their overall disk-like shape remaining intact. (QuickTime ). 1.  Video 2Real-time movie clip showing the unfolding of a healthy, human red blood cell into its normal biconcave disk-like shape upon removal of the optical trap. (QuickTime, ). 2.  It is known that the shear modulus and the deformability of infected red cells increase as they progress to the schizont stages.8, 14 It is difficult to distinguish between infected and uninfected RBCs through simple bright-field imaging, especially during the early ringstages of the parasite. Therefore, a synchronization of the P. falciparum culture, along with use of the fluorescence attachment to our opticaltrap, enabled us to assess OTAFUR values for unequivocally identified parasitic stages as detected by DAPI staining [Fig. 3a ]. It was observed that the F and UF values for different parasitic stages changed distinctly during the late ring to early trophozoite stage at (Fig. 3). It is to be noted that the currently employed technique of micropipette aspiration does not work well with mature stages of malaria-infected RBCs.6, 8 Fig. 3(a) Images of DAPI-stained uninfected (U) and P. falciparum infected RBCs at respective time points postsynchronization as seen in (a) bright field and (b): through fluorescent attachment. (b) F and (c) UF times of different RBCs versus time after synchronization of P. falciparum culture containing 1% parasitemia. N: normal RBCs; U: uninfected RBCs from synchronized culture at time point. Each point represents a single RBC, and horizontal bars represent the mean of each group R: ring; T: trophozoite, and S: schizont ( value: , , ). 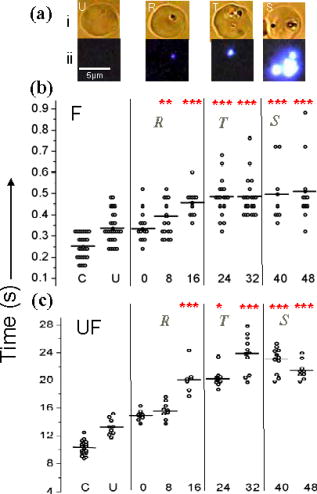 Our measurements show that the F and UF parameters can help resolve the buckling properties of different stages of malarial infection [Fig. 3b and 3c]. UF values show greater resolution to distinguish various stages, and the maximal change occurs at which approximately represents the early schizont stage. Earlier, a recovery parameter was reported in red cells (time constant), which was determined by stretching red cells immobilized at one end and allowing the cell to recover.15 The OTAFUR unfolding time is reflective of the inherent membrane properties comparable to this time constant. However, unlike earlier methods, the buckling is caused by a definitive laser power and remains constant in a setup. Moreover, the unfolding time is in seconds, which allows for far greater temporal resolution [Fig. 3a]. We observe similar behavior of mouse RBCs in murine models of malaria (P. berghei ANKA and P. yoelii), where stage-specific assessments of RBC deformability have not been reported previously (Fig. 4 ). It is apparent from Figs. 3b and 3c that uninfected RBCs in the population also show distinct changes in F and UF values, indicating a trans-effect of parasitized cells on the uninfected cells. We used OTAFUR to explore the effects of PRBCs on neighboring RBCs. It has been documented that a small percentage of PRBCs , as detected in the peripheral blood of patients, can influence the mechanical properties of uninfected cells, possibly resulting in severe anemia.16, 17 Fig. 4Folding time and unfolding time of different RBCs from P. bergheii ANKA infected (a) and P. yoelli infected (b) BALB/c mice ( values: , , ). 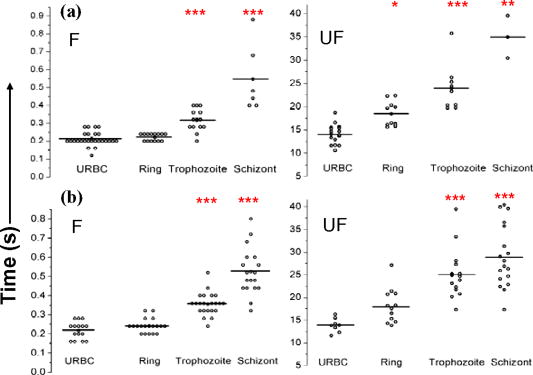 Measurements of cell deformability have been carried out earlier on malaria-infected RBC populations using a laser-assisted optical rotational cell analyzer (LORCA).16 In this assay, a diffraction pattern of the ellipticity of the population was evaluated, from which it was possible to deduce the deformability of a population of RBCs. We have assessed the effects of conditioned parasite CM on NRBCs. A schematic of our experiment is shown in Fig. 5a . The medium is removed after requisite time periods, and NRBCs are treated for with the CM. The cells are then washed, and one aliquot is immediately analyzed using OTAFUR [Fig. 5b], while the remaining cells are put back with normal medium for and then tested using OTAFUR [Fig. 5c]. It is apparent that the medium of parasitized culture contains one or more components that mediate measurable changes in normal RBCs [Fig. 5b]. The effects are transient, and the cells recover [Fig. 5c]. Our experiments in Fig. 3 did reflect these changes between URBCs and NRBCs, but did not show statistical significance perhaps because the cells were subjected to the CM only for . Our detailed observations indicate that incubation shows significant effects on the URBCs, and is indeed also dependent on the percentage parasitemia (data not shown). Moreover, control experiments were conducted to establish that normal RBCs do not show any change in folding/unfolding for up to of incubation in normal medium. It is pertinent to note that preliminary experiments have been conducted by us to explore possible mediators in the CM; our results indicate that proteins might not be active mediators because measurements indicate the effects to be heatstable. There might be a possible role played by ionic flux as ion chelators and channel blockers appear to reverse the changes. Fig. 5Effect of P. falciparum CM on folding and unfolding of normal NRBCs. (a) Schematic for collection of CM from different stages post synchronization. F and UF times of (b) RBCs incubated with different CM for and (c) after recovery in normal medium for another N: normal RBCs incubated in normal medium ( values: , , ).  In order to place our findings in a proper perspective, we make a comparison of shear modulus values that we determine with those obtained using standard rheological and optical stretcher methods. For determining shear modulus in the present experiments, the trap was focused near the surface of the flow cell. Typically, the flow was stopped and an RBC was trapped. Once the RBC was trapped and folded, flow was started. Because of the viscous drag experienced by the trapped RBC, it elongated and at a critical flow speed, escaped the trap. Velocity of the escaped RBC was measured by counting the number of frames it took to escape from the field of view after getting released from the trap. Calculation of shear modulus was done by the following formula:18 where denotes the medium viscosity, is the length of the folded RBC prior to the start of the fluid flow, is the maximal change in the length upon application of fluid action, and is the escape velocity of the RBC. , where , denote the distance of the RBC from the top and bottom surface of the flow cell.We measure changes in cell length and velocity to calculate the shear modulus for different cells. The fluorescence attachment enables us to distinguish between NRBCs, PRBCs, and URBCs. Figure 6, Video 3, and Video 4 shows the experimentally measured values of the shear modulus for NRBC, PRBC, and URBC. We find that our measured values of shear modulus for NRBCs are comparable to those determined through established rheological methods.19 We observed that the shear moduli of URBCs are significantly different from that of NRBCs, indicating that the membrane properties are modified in case of former. Fig. 6(a) (i) Images from a movie clip showing elongation of NRBC. The movie clip can be viewed as Video 3. (ii) Image of elongated URBC. (iii) Images from a movie clip showing elongation of PRBC. The movie clip can be viewed as Video 4. denotes the cell length before elongation and after elongation. (b) Shear modulus of different RBCs as determined by our flow-trap method. PRBCs and URBCs were taken from a time point of a synchronized P. falciparum culture with 10% parasitemia ( values: , ).  Video 3Trapping of a flowing healthy, human red blood cell (NRBC) by an optical trap. Note how the flow of the medium elongates the trapped cell. The periodic variations that are observed are due to the non-constant action of the peristaltic pump used in our experiments. (QuickTime, ). 3.  Video 4Trapping of a flowing, malaria-infected red blood cell (PRBC) by an optical trap. The flow of the medium leads to considerably less elongation of the cell, compared to a healthy cell, due to its enhanced rigidity that accompanies Plasmodium infection. (QuickTime, ). 4.  The shear modulus of PRBC is higher than that of NRBC and URBC. These measurements open new possibilities for identifying the mediator(s), which cause changes in RBC deformation and help develop deeper insights for severe malaria. Measurement of folding and unfolding (OTAFUR) is restricted to RBCs because only discoid RBCs undergo folding in the optical trap. Combining an optical trap, fluorescence microscopy and a flow cell allows us to measure the shear modulus under specific flow conditions for a defined single RBC. It is important to note that the insides of infected RBCs are usually subjected to severe modification brought about by factors such as the inhomogeneity of cytoplasm, crystallization of hemoglobin, and the growth of malarial parasites. Furthermore, we also recognize that the morphology of infected RBCs alters during intraerythrocytic stages, and this leads to significant alterations in the physical properties of RBCs. While calculating the shear modulus, all these factors are not taken into account. Nevertheless, what we have measured is still a useful albeit approximate quantity because it represents a physiological measurement on free-flowing infected RBCs at the single-cell level while allowing comparison between folding time and cell elongation. 4.ConclusionIn summary, we have presented a method whereby the membrane shear modulus of single specific fluorescently labeled RBC can be estimated without the constraint of mechanical immobilization of the cell. Our technique involves a combination of a liquid flowcell, fluorescence microscopy, and an opticaltrap such that relatively simple measurements of the shear modulus and buckling properties of single RBCs are facilitated under physiological conditions. This method provides an opportunity of monitoring the membrane changes in a genetically manipulated single PRBC. We have illustrated the efficacy of our new technique by studying the buckling behavior of normal as well as Plasmodium-infected RBC and the effect of P. falciparum–conditioned medium on normal, uninfected cells. Cell deformability strongly correlates with severe malaria, and therefore, a method such as OTAFUR should be useful to predict the propensity for severe malaria.16 Because the cell rigidity changes in several hematological disorders, such as sickle-cell anemia and diabetes,18, 20 we believe that OTAFUR might also be useful as a supplementary method to assess membrane properties of RBCs in such disorders. ReferencesA. Ashkin,
J. M. Dziedzic,
J. E. Bjorkholm, and
S. Chu,
“Observation of a single-beam gradient force optical trap for dielectric particles,”
Opt. Lett., 11 288
–290
(1986). 0146-9592 Google Scholar
M. P. Sheetz,
“Laser tweezers in cell biology,”
Methods Cell Biol., 55 47
–69
(1997). 0091-679X Google Scholar
A. Bransky,
N. Korin,
Y. Nemirovski, and
U. Dinnar,
“An automated cell analysis sensing system based on a microfabricated rheoscope for the study of red blood cells physiology,”
Biosens. Bioelectron., 22 165
–169
(2006). https://doi.org/10.1016/j.bios.2005.12.006 0956-5663 Google Scholar
J. G. Dobbe,
M. R. Hardeman,
G. J. Streekstra, and
C. A. Grimbergen,
“Validation and application of an automated rheoscope for measuring red blood cell deformability distributions in different species,”
Biorheology, 41 65
–77
(2004). 0006-355X Google Scholar
M. Bessis,
N. Mohandas, and
C. Feo,
“Automated ektacytometry: A new method of measuring red cell deformability and red cell indices,”
Blood Cells, 6 315
–327
(1980). 0340-4684 Google Scholar
G. B. Nash,
E. O’Brien,
E. C. Gordon-Smith, and
J. A. Dormandy,
“Abnormalities in the mechanical properties of red blood cells caused by Plasmodium falciparum,”
Blood, 74 855
–861
(1989). 0006-4971 Google Scholar
A. Bransky,
N. Korin,
A. Leshansky,
N. Lanir,
Y. Nemirovski, and
U. Dinnar,
“The rheologic properties of Erythrocytes: A study using an automated rheoscope,”
Rheol. Acta, 46 621
–627
(2007). 0035-4511 Google Scholar
S. Suresh,
J. Spatz,
J. P. Mills,
A. Micoulet,
M. Dao,
C. T. Lim,
M. Beil, and
T. Sefferlein,
“Connections between single-cell biomechanics and human disease states: Gastrointestinal cancer and malaria,”
Acta Biomater., 1 16
–30
(2005). 1742-7061 Google Scholar
J. A. Dharmadhikari,
S. Roy,
A. K. Dharmadhikari,
S. Sharma, and
D. Mathur,
“Torque-generating malariainfected red blood cells in an optical trap,”
Opt. Express, 12 1179
–1184
(2004). https://doi.org/10.1364/OPEX.12.001179 1094-4087 Google Scholar
J. A. Dharmadhikari and
D. Mathur,
“Using an optical trap to fold and align single red blood cells,”
Curr. Sci., 86 1432
–1437
(2004). 0011-3891 Google Scholar
J. P. Shelby,
J. White,
K. Ganeshan,
P. K. Rathod, and
D. T. Chiu,
“A microfluidic model for single-cell capillary obstruction by Plasmodium falcipuram-infected erythrocytes,”
Proc. Natl. Acad. Sci. U.S.A., 100 14618
–14622
(2003). https://doi.org/10.1073/pnas.2433968100 0027-8424 Google Scholar
A. Ghosh,
S. Sinha,
J. A. Dharmadhikari,
S. Roy,
A. K. Dharmadhikari,
J. Samuel,
S. Sharma, and
D. Mathur,
“Euler buckling-induced folding and rotation of red blood cells in an optical trap,”
Phys. Biol., 3 67
–73
(2006). https://doi.org/10.1088/1478-3975/3/1/007 1478-3975 Google Scholar
C. Lambros and
J. P. Vanderberg,
“Synchronization of Plasmodium falciparum erythrocytic stages in culture,”
J. Parasitol., 65 418
–420
(1979). 0022-3395 Google Scholar
L. H. Miller,
S. Usami, and
S. Chien,
“Alteration in the rheologic properties of Plasmodium Knowlesi–infected red cells. A possible mechanism for capillary obstruction,”
J. Clin. Invest., 50 1451
–1455
(1971). 0021-9738 Google Scholar
R. M. Hochmuth,
P. R. Worthy, and
E. A. Evans,
“Red cell extensional recovery and the determination of membrane viscosity,”
Biophys. J., 26 101
–114
(1979). 0006-3495 Google Scholar
A. M. Dondorp,
B. J. Angus,
K. Chotivanich,
K. Silamut, R. Ruangveerayuth, M. R. Hardeman,
P. A. Kager,
J. Vreeken, and
N. J. White,
“Red blood cell deformability as a predictor of anemia in severe falciparum malaria,”
Am. J. Trop. Med. Hyg., 60 733
–737
(1999). 0002-9637 Google Scholar
A. M. Dondorp,
E. Pongponratn, and
N. J. White,
“Reduced microcirculatory flow in severe falciparum malaria: Pathophysiology and electron-microscopic pathology,”
Acta Trop., 89 309
–317
(2004). 0001-706X Google Scholar
M. M. Brandao,
A. Fontes,
M. L. Barjas-Castro,
L. C. Barbosa,
F. F. Costa,
C. L. Cesar, and
S. T. O. Saad,
“Optical tweezers for measuring red blood cell elasticity: Application to the study of drug response in sickle cell disease,”
Eur. J. Haematol., 70 207
–211
(2003). 0902-4441 Google Scholar
S. Henon,
G. Lenormand,
A. Richert, and
F. Gallet,
“A new determination of the shear modulus of the human erythrocyte membrane using optical tweezers,”
Biophys. J., 76 1145
–1151
(1999). 0006-3495 Google Scholar
S. Adak,
S. Chowdhury, and
M. Bhattacharyya,
“Dynamic and electrokinetic behavior of erythrocyte membrane in diabetes mellitus and diabetic cardiovascular disease,”
Biochim. Biophys. Acta, 1780 108
–115
(2008). 0006-3002 Google Scholar
|


