|
|
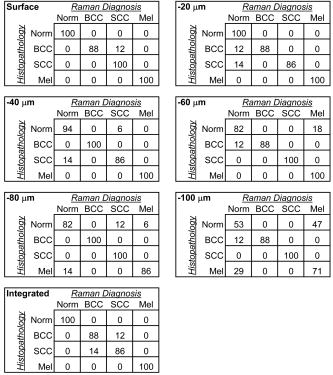
1.IntroductionSkin cancers are the most prevalent form of human cancer; their incidence is nearly equal to that of all other cancers combined.1 Nonmelanoma skin cancers, including basal cell carcinomas (BCC) and squamous cell carcinomas (SCC), present more than one million cases each year in the United States alone.1 Melanomas contribute another cases each year.1, 2 As in most cancers, early diagnosis is crucial for a favorable prognosis. Recognition of skin cancers typically relies on visual inspection and patient history. Although skin presents an easy site for inspection, diagnosis of skin cancers is difficult, as many benign lesions visually resemble malignancies. Thus, accurate clinical diagnosis relies on biopsy and subsequent histopathologic examination. Clinicians are presented with the challenge of deciding which and how many skin lesions to biopsy, usually relying on visual inspection and palpation. Furthermore, as treatment depends on the pathology of the lesion and the extent of its margins, time-consuming histopathologic confirmation of lesion malignancy is required for proper treatment. Despite many efforts, there is a continued need for an automated, noninvasive diagnostic method of characterizing skin lesions in situ that can direct biopsies and, ultimately, circumvent the need for histology. Such a technique could streamline and combine diagnostic and therapeutic procedures in a single visit, saving time and expense for both the clinician and the patient. 1.1.Optical DiagnosisOptical methods present a viable approach for providing automated, noninvasive, real-time diagnosis of skin lesions, as well as guidance of therapy. There has been much interest in recent years to develop “optical biopsy” methods for tissue diagnosis. Several optical techniques have been applied in a variety of organ systems, with varying degrees of success. A number of optical imaging modalities have been employed to study skin structures and malignancy, including optical coherence tomography (OCT), laser scanning microscopy, and polarized light imaging. Welzel obtained OCT images from various skin lesions and were able to differentiate skin layers and morphological changes.3 Knüttel utilized OCT to measure refractive index and scattering differences in skin structures.4 However, OCT typically provides axial sections that are based on morphological structures alone and requires expert interpretation. On the other hand, confocal reflectance imaging typically provides transverse sections of tissues by depth resolution that is again based on tissue morphology. This method has been used to study a number of skin conditions and diseases. 5, 6, 7, 8 In particular, Rajadhyaksha constructed a portable confocal microscope for in vivo skin imaging with positional accuracy within .9 Thus, both confocal imaging and OCT are two methods that provide in vivo morphological images that still require an expert to interpret. Both these imaging methods provide little quantitative information and no biochemical information with respect to the disease state. Pellacani and Seidenari compared polarization microscopy with epi-illuminescence microscopy of pigmented skin lesions and found that the polarization revealed excellent contrast between morphological structures while obscuring the observed pigment colors in the lesions.10 Yaroslavsky used polarization imaging to accurately detect locations and shapes of dye-enhanced samples with BCC and SCC in vitro.11 Olivier found polarization imaging to be a superior alternative to clinical examination for determining necrotic regions of skin flaps.12 While these results show that polarization microscopy provides semiquantitative information about tissue state, it provides little biochemical information and lacks the capability for automated, graded tissue diagnosis. Spectroscopic techniques, in contrast, are based on quantitative measurement of specific native tissue chromophores. Clinical application of these techniques can be performed by unskilled personnel, with automated, statistical algorithms providing objective correlation of measured data with pathological state. In the case of skin cancer diagnosis, perhaps the most often applied spectroscopic techniques have been fluorescence spectroscopy and Raman spectroscopy. Fluorescence spectroscopy has been used to characterize melanomas13 as well as nonmelanoma skin cancers (BCC and SCC) from normal skin spectra.14 Fluorescence spectra could be correlated to the disease state, and some of these differences were attributed to tryptophan moieties related to the carcinomas. Doukas found a linear relationship between the fluorescence intensity at and epidermal keratinocyte proliferation.15 In another study, Gillies found this same relationship in psoriatic lesions and observed a clear distinction between the fluorescence signals of epidermis and dermis.16 These studies indicate that the biochemical constituents detected by fluorescence spectroscopy are capable of predicting morphological and pathologic changes. However, because there are relatively few autofluorescent biological markers, the fluorescence spectra provide a limited capability to perform graded diagnosis of skin lesions. Moreover, Lauridsen found pigmentation to be the greatest factor in the variability of fluorescence spectra from normal skin measured in vivo.17 Sandby-Møller also found skin redness due to sun exposure affected the fluorescence spectra, while epidermal thickness had no effect.18 Thus, intrinsic tissue parameters such as skin color can modulate the fluorescence spectra measured, thus affecting the performance of fluorescence spectroscopy for skin cancer diagnosis. Raman spectroscopy is an optical technique that probes the vibrational energy levels of molecules. In the Raman spectrum, specific peaks correspond to particular chemical bonds or bond groups. Because of Raman’s chemical specificity, it has the ability to discern the slight biochemical changes associated with malignant transformation, thereby aiding in differential diagnosis. Furthermore, when utilized in a confocal configuration, Raman spectra can be acquired from various depths and locations within the tissue. Several groups have used Raman spectroscopy to study the molecular composition and biochemistry of normal skin. One study on the normal skin measured in vivo shows Fourier-transform (FT) Raman spectra to vary as a function of hydration state and related collagen structure, while pigmentation was found to have very little contribution to spectral differences.19 Caspers correlated confocal Raman spectra measured in vitro and in vivo with molecular composition and hydration of skin layers. 20, 21, 22, 23 FT-Raman spectra have also been measured from normal and psoriatic lesions in vitro, and distinct differences due to lipid content and related keratin content were found.24 Hata found a relationship between Raman spectral differences and carotenoid concentrations and therefore, cancerous and precancerous skin lesions.25 For skin cancer detection, Gniadecka used FT-Raman spectroscopy to characterize skin structures26 and to differentiate BCC from normal skin in vitro.27 Sigurdsson utilized surface-level FT-Raman spectra to discriminate BCC and melanoma from actinic keratosis, pigmented nevi, and normal skin tissue with sensitivity and specificity.28 Nuclear and tissue environmental changes between BCC and normal epidermal cells were found using confocal Raman microscopy by Short 29 Nijssen used a confocal system to generate Raman maps of 15 skin sections and were able to diagnose BCCs with 100% sensitivity and 93% specificity.30 Thus, these different studies demonstrate the ability of Raman spectroscopy to detect subtle molecular transformations associated with skin and skin malignancy. Furthermore, a confocal approach has been shown to be essential in order to maximize Raman signal collection from relevant structures while avoiding interference from irrelevant sources. However, none of the published reports explore the capability of Raman spectroscopy to differentiate both melanomas and nonmelanomas (BCC and SCC) from normal skin toward clinical detection, nor compare the diagnostic performance of depth-resolved Raman measurements with non-depth-resolved measurements such as those obtained from a simple fiber probe. While skin is easily accessible for optical diagnostic techniques, its stratified composition, inherent variability between and within patients, and presentation of malignancy at various depths within the skin provide a unique challenge. Any optical diagnostic technique, then, must not only be able to discern normal skin from various pathological conditions, but also be spatially resolved in order to minimize the effect of extraneous contributors in the superficial layers. Due to its molecular specificity, clinically viable acquisition times ( seconds), and spatial resolution, confocal Raman spectroscopy was selected for differential skin cancer diagnosis. The goal of this study was to characterize the Raman signatures of normal and malignant skin and to develop a strategy for clinical implementation. Using an in-house built confocal Raman microspectrometer, spectra were acquired from various normal and malignant skin tissues in vitro at various depths, and the spectra were characterized using simple and multivariate statistical techniques. Logistic discrimination was performed to predict pathological classification of the samples, and preliminary analyses indicate the ability of confocal Raman spectroscopy to successfully differentiate the various types of skin lesions and suggest that further clinical studies are warranted. 2.Materials and Methods2.1.Skin SamplesAll skin samples were obtained under a protocol approved by the Vanderbilt University Institutional Review Board (IRB). Each sample was obtained fresh-frozen from the Vanderbilt University Medical Center immediately after resection. Thirty-nine samples were obtained for this study, of which 17 were normal, 8 basal cell carcinoma (BCC), 7 squamous cell carcinoma (SCC), and 7 melanoma. Normal samples were obtained from either breast reduction or amputation procedures. Malignant samples were partial sections of lesions that had been surgically removed. All samples were maintained at until time of spectral study, at which point they were thawed in buffered saline. Because of their small size and harvest from within the resected tumor boundaries, gross tissue pathology from the parent lesion was used as the gold-standard for classification. 2.2.Confocal Raman MicroscopeThe confocal Raman microscope (CRM) used in this study is an in-house built system designed specifically for tissue interrogation and is shown in Fig. 1 . The excitation source of the microscope is an external cavity diode laser (ECDL) built in-house, which includes a 150-mW diode at (DL8032, Sanyo Electric, Japan) and an 1800-line/mm, gold-coated, high-modulation holographic grating (ThermoRGL, Rochester, New York). The ECDL output beam is shaped by a weak cylindrical lens to minimize astigmatism, and an anamorphic prism pair transforms the elliptical cross section into a circular beam with Gaussian energy distribution. A longpass dichroic beamsplitter at (Omega Optical, Brattleboro, Vermont) separates the excitation beam path from the emitted Raman scatter. A second dichroic (hot) mirror (Edmund Industrial Optics, Barrington, New Jersey) separates both the excitation beam and the Raman scatter from the shortpass-filtered white light illumination source to allow concurrent Raman acquisition and white light viewing of the sample via a color video camera. An achromatic near-infrared-optimized microscope objective ( , Nachet, France) serves both to focus the excitation light on the sample and to collect the Raman scatter. A longpass edge filter at (Omega Optical, Brattleboro, Vermont) eliminates residual Rayleigh scatter. The Raman signal from the sample is focused into a core diameter, multimode optical fiber, which serves as the confocal aperture. The fiber is connected to a holographic imaging spectrograph (HoloSpec f/1.8i, Kaiser Optical Systems, Ann Arbor, Michigan) and liquid-nitrogen-cooled, back-illuminated, deep-depletion CCD (EEV1024EB, Roper Scientific, Trenton, New Jersey) for detection. In addition, a motorized microscope stage (4400RP, Conix Research, Springfield, Oregon) allows automatic positioning of the sample with mechanical resolution better than . Fig. 1Schematic of confocal Raman microscope used in this study: ECDL=laser, AP=anamorphic prism pair, cylindrical lens, BP=bandpass filter, DM=dichroic mirror, M=mirror, beamsplitter, SP=shortpass filter, LP=longpass filter, and Obj=microscope objective.  Axial and lateral optical resolution of the CRM was determined by the average full-width-at-half-maximum (FWHM) of the intensity profile of a small polystyrene bead as it was repeatedly scanned through the beam focus in the three respective dimensions. This produced an axial resolution of and lateral resolutions of 2.4 and in the and directions, respectively. The axial resolution was deliberately increased over true diffraction-limited resolution (theoretically to with objective) in order to guarantee tissue-level measurement volumes ( to 3 cells) while maintaining volume resolution and increasing overall collection efficiency. The discrepancy between the lateral resolutions can be attributed to residual astigmatism in the excitation beam. The spectral resolution of the detection system was calculated to be , based on the holographic grating dispersion, slit width, and CCD pixel size. 2.3.Data Acquisition and ProcessingRaman spectra were recorded from the surface of each tissue specimen (determined by focusing the microscope on the tissue surface using a video image) and at increments below the surface, down to a depth of at least (determined by translation of the motorized stage). These depth measurements were made at various locations (2 to 5, depending on sample size) within each tissue specimen to ensure repeatability of the spectral data. All spectra were recorded using a 30-s integration time, with an excitation power of at the sample. The spectral dispersion of the system was characterized using the atomic emission lines of a lamp; wave number calibration was performed using naphthalene and acetamidophenol as standards. Spectra were binned to half the spectral resolution of the system for direct comparison. High-frequency readout noise and shot noise were removed from the spectra by a second-order Savitzky-Golay filter.31 Tissue autofluorescence was subtracted using an automated modified polynomial fitting method.32 To account for inherent variation in intra- and intersample absolute signal intensity, the spectra were normalized to their respective mean intensity across all wave numbers. 2.4.Data AnalysisFor each sample, spectra from all measurement locations were averaged, and a mean spectrum was calculated for each depth. Outlier spectra were determined as those residing outside three standard deviations of the respective mean spectrum (i.e., from same sample, same depth, different locations), and mean spectra were recalculated with outliers removed. All further data analysis used only the mean spectral values from each sample, at each measured depth. Integrated Raman spectral surrogates were created from the depth-resolved spectra to approximate spectra that would be obtained from a traditional, nonconfocal Raman probe. These integrated spectra were created by summing the intensity values of the depth-resolved spectra (processed as earlier but without any normalization) at each respective wave number across all measured depths and locations within each sample. While depth-related optical absorption was not mathematically factored into this integration, the depth resolution of the Raman microscope and the associated decrease in Raman intensity with increasing measurement depth allows a general approximation of non-depth-resolved spectra. Outliers, identified earlier, were excluded from integration. Each resultant spectrum (one for each tissue specimen) was then normalized to its mean intensity across all wave numbers to eliminate inherent intersample absolute intensity variation. Each measurement depth (and the integrated spectra) was evaluated independently to assess the effect of measurement depth on the pathological predictive capabilities of the Raman spectra, using leave-one-out cross-validation. The analysis technique employed has been described previously33, 34, 35 and consists of two steps: (1) extraction of diagnostic features from the spectra using the nonlinear maximum representation and discrimination feature (MRDF), and (2) development of a probabilistic scheme of classification based on linear sparse multinomial logistic regression (SMLR) for classifying the nonlinear features into corresponding tissue categories. Given a set of input data comprising samples from different classes with a given dimensionality, nonlinear MRDF aims to find a set of nonlinear transformations on the input data that optimally discriminate between the different classes in a reduced dimensionality space. It uses nonlinear transforms that are polynomial mappings of the input data. In the case of spectral data, the aim of nonlinear MRDF is to compute nonlinear transformation vectors, , from -dimensional (where is the number of wave numbers over which spectra were recorded) spectra of skin tissues, such that the projections of the input data on from the different tissue categories are statistically well separated from each other. Since the dimensionality is much larger than the size of the data, a two-stage MRDF with restricted polynomial transform at each stage was used. In the first stage, the input data (intensities corresponding to wave numbers of the spectra) from each tissue type were raised to the power and subject to a transform to produce the first stage output features in the feature space of reduced dimension . In the second stage, the reduced -dimensional output features for each tissue type were further raised to the power and subject to a second transform to yield the final output features in the nonlinear feature space of dimension . Since the nonlinearities introduced in the two stages were different ( in the first stage, and in the second stage), this is expected to produce more general nonlinear transforms on the input spectral data leading to improved separation of the final nonlinear features for the tissue types in the new feature space. Classification with SMLR is a probabilistic multiclass model based on a sparse Bayesian machine-learning framework of statistical pattern recognition. The central idea of SMLR is to separate a set of labeled input data into its constituent classes by predicting the posterior probabilities of their class membership. It computes the posterior probabilities using a multinomial logistic regression model and constructs a decision boundary that separates the data into its constituent classes based on the computed posterior probabilities following Bayes’s rule. Classification of a given set of input data is based on the vector of posterior probability estimates yielded by the SMLR algorithm, and a class is assigned to each dataset (transformation of the original spectrum) for which its posterior probability is the highest. 3.ResultsFigure 2 shows typical Raman spectra (normalized to their respective mean intensity) obtained from each layer of a normal skin tissue specimen, alongside a hematoxylin and eosin (H&E) stained histological section of representative normal skin. Spectral variations between the different layers can be observed at 890 to 1030, 1170, 1230 to 1345, 1440, and , corresponding to biochemical differences inherent in the major skin strata, notably collagen, elastin, keratin, and lipids.23, 24, 36 Fig. 2Representative Raman spectra acquired from various depths in skin, along with H&E stained section of normal skin. Several spectral differences between the major layers of the skin (stratum corneum, epidermis, and dermis) are evident, attributable to intrinsic biochemical differences between the skin strata.  The mean spectra of the various skin malignancies studied at each measured depth are presented in Fig. 3a . Numerous differences between the tissue pathologies can be observed at many depths. The melanoma spectra are noticeably different as compared to the other categories at all depths. Differences between normal, BCC, and SCC are subtler: the ratio of the bands between 1200 to 1300 (tryptophan, phenylalanine, amide III: proteins) and ( bending: proteins, lipids) varies with depth, and this variation is different between normal and malignant tissues. The peak at (amide I: proteins, lipids) as well as the small peak near (tryptophan) is higher in the BCC and SCC than in the normal tissue. Other variations include changes in the band patterns between 850 and (tyrosine, proline, glucose, glycogen, phenylalanine, proteins) evident as a function of pathology and depth. Figure 3b shows the mean integrated spectra of the various malignant tissues. As expected, the spectral changes evident between the pathologies at each depth are not as easily visible in the integrated spectra. Figure 4 shows the mean normal, BCC, and SCC Raman spectra taken at a measurement depth of excluding the melanoma spectrum, allowing the subtle variations between these pathologies to be more evident. While there are many observable spectral differences, it is more relevant to explore the significance of these variations toward pathological classification. Fig. 3(a) Mean Raman spectra of the four pathologies studied (normal, BCC, SCC, melanoma) at each measured depth, and (b) integrated Raman spectra approximating a probe-based system. Significant differences are seen between the melanoma spectra and all other pathologies at all depths. The BCC and SCC variations are much more subtle with respect to the normal samples, and with depth.  Fig. 4Mean Raman spectra of the nonmelanoma cancers and normal skin tissues from measurement depth. In this enlarged view, the subtle variations between the BCC, SCC, and normal tissue spectra are evident in a number of Raman band regions.  In order to quantify the spectral variations of the different pathologies at each depth, both data reduction (MRDF) and classification (SMLR) algorithms were applied. The MRDF algorithms reduced the dimensionality of the spectra such that the features most important to differentiation are retained (as opposed to techniques such as principal components analysis, which compress the data with regard to common variance) through higher-order nonlinear transformation. The SMLR algorithms received as input the compressed (via MRDF) datasets and provided probabilistic class memberships. Figure 5 shows the posterior probability plots at each depth, grouped by tissue pathology (as determined by histopathological diagnosis of parent lesions). These plots show both the surface and the -depth measurements as those with the highest overall probabilities of class membership. Fig. 5Posterior probability plots generated by sparse multinomial logistic regression of the Raman spectra at each measurement depth, grouped by histopathologic diagnosis.  The confusion matrices for each measurement depth and the integrated spectra are shown in Fig. 6 , with each value corresponding to the percentage of correct classifications (i.e., agreement between SMLR classification of Raman spectra and histopathologic diagnosis). It can be seen that the surface spectra provide 100% sensitivity and specificity of disease versus normal and misclassify only a single spectrum as a SCC rather than BCC. Increasing the measurement depth causes further classification error, although not necessarily in a linear fashion. All measurement depths from the surface down to provide reasonable classification accuracy, while the classification at depth incurs much more error. The integrated spectra are seen to provide slightly lower classification accuracy than the surface and -depth measurements, although higher than some of the deeper measurements. 4.DiscussionThese results show that a spatially resolved Raman measurement technique provides a moderate increase in diagnostic performance as compared to integrative measurements. Skin cancers manifest in specific skin strata, and non-spatially-resolved measurement techniques can attenuate the slight spectral differences caused by slight biochemical changes in localized regions. However, this technique is not without limitations. Spatial resolution of a confocal system depends not only on the system optics, but also on sample stability. While this is not a problem in vitro, clinical application will require stabilizing the tissue for the duration of the measurements. Short measurement times will aid in this sample stabilization procedure and also minimize the impact of the Raman measurements on the patient and clinician. Furthermore, accurate histopathologic correlation of the Raman measurement sites will allow accurate correlation of the Raman spectra with specific morphological structures. The spectral differences in the melanoma spectra are seen to be much more significant, and at different wave number ranges than the BCC and SCC spectra, while the BCC and SCC spectra show significant differences in similar wave number ranges. This is likely due to differences in the cellular origins of the cancers, as both BCC and SCC involve malignancy of keratinized epidermal cells and melanomas result from malignancy of melanocytes. 37, 38, 39, 40 While melanomas were included in this study for completeness, the direct comparison between BCC or SCC and melanoma is much less relevant clinically. Melanomas, being pigmented lesions, generally require diagnosis to differentiate them from other pigmented lesions such as nevi, while BCC and SCC are often mistaken for unpigmented lesions such as actinic keratoses or inflamed scar tissue. As such, future studies are planned to include the aforementioned benign lesions in a larger clinical study. This obvious disparity between the melanoma spectra and the nonmelanoma cancer and normal tissues is, thus, not unexpected, and shows the Raman technique to be more sensitive to pigment-related variations than the subtle biochemical differences leading to skin disease. This observation strengthens the argument for a depth-resolved measurement technique, in order to minimize the effect of inherent pigment variations between subjects on optical-based diagnosis. The data analysis methods used in this study were selected for their ability to both compress the large amount of data obtained with each Raman spectrum as well as retain only the diagnostically relevant portions of the spectra in this compression. Principal components analysis (PCA), in contrast, creates only a single model for a dataset and compresses the data in decreasing degrees of shared variance. Since the diagnostically relevant features in the Raman spectra are very small in comparison with the shared spectral content, it is imperative that these features be retained. However, while MRDF is demonstrably adept at exploiting diagnostically relevant features for maximum discrimination, its nonlinear mathematical transformation of the original data space does not allow retracing of the specific wave number regions responsible for each transform. It is, therefore, not possible to identify which particular Raman band differences are ultimately responsible for the MRDF/SMLR discrimination, as opposed to the component loadings generated by PCA. Further comparisons between the MRDF/SMLR technique and conventional data reduction/discrimination techniques can be found in other literature.33, 34 As seen in the depth-specific classification of the Raman spectra, there is a clear variation in classification accuracy with increasing measurement depth, particularly between 80 and . This is likely due to the anatomical structure of the skin and the thickness of the epidermis. The epidermis is the site of manifestation for most skin tumors and is comprised of keratinized cells superficial to the basement membrane (stratum basale). Although the depth of the basement membrane varies considerably, it is likely that this heterogeneity was accounted for within the depth, whereas the depth sampled larger portions of the underlying dermis, which is comprised primarily of structural collagen. Histological analysis of each measurement site could reveal this heterogeneity but unfortunately was not available for these samples. These results also show that an optical diagnostic tool such as Raman spectroscopy would benefit from a tandem optical imaging technique (i.e., OCT, laser confocal imaging), which would allow rapid, noninvasive visualization of the skin strata in addition to the quantitative spectral measurements. The tandem imaging technique could easily coexist with the Raman sampling optics and allow visual identification of lesion depth and size prior to targeting the depth-specific spectral acquisition. These capabilities are being planned in future revisions of the CRM. 5.ConclusionThe accessibility of most skin lesions make them ideally suited for the application of optical diagnostic techniques, yet the stratified architecture of the skin and its malignancies presents an obstacle for optical techniques that cannot discern these strata. Raman microspectroscopy provides the ability to obtain optical signals only from specified volumes within the tissue, and therefore can circumvent the extraneous optical signals of non-disease-predictive regions. Using multivariate analysis methods, we were able to accurately predict the pathology of several skin samples in vitro. These results indicate the potential of Raman spectroscopy to accurately diagnose skin lesions clinically. Based on this success, the development of a handheld confocal Raman system has been initiated, and clinical studies are planned for the near future. AcknowledgmentThis project was funded in part by the Vanderbilt In-Vivo Imaging Center, Grant No. NIH CA86283. ReferencesA. Jemal,
R. C. Tiwari,
T. Murray,
A. Ghafoor,
A. Samuels,
E. Ward,
E. J. Feuer, and
M. J. Thun,
“Cancer statistics, 2004,”
Ca-Cancer J. Clin., 54 8
–29
(2004). 0007-9235 Google Scholar
“Cancer Facts and Figures,”
4
(2007) Google Scholar
J. Welzel,
E. Lankenau,
R. Birngruber, and
R. Engelhardt,
“Optical coherence tomography of the human skin,”
J. Am. Acad. Dermatol., 37 958
–963
(1997). 0190-9622 Google Scholar
A. Knüttel and
M. Bochlau-Godau,
“Spatially confined and temporally resolved refractive index and scattering evaluation in human skin performed with optical coherence tomography,”
J. Biomed. Opt., 5
(1), 83
–92
(2000). https://doi.org/10.1117/1.429972 1083-3668 Google Scholar
S. Gonzalez,
E. Gonzalez,
W. M. White,
M. Rajadhayaksha, and
R. R. Anderson,
“Allergic contact dermatitis: correlation of in vivo confocal imaging to routine histology,”
J. Am. Acad. Dermatol., 40 708
–713
(1999). 0190-9622 Google Scholar
S. Gonzalez,
M. Rajadhayaksha,
A. Gonzalez-Serva,
W. M. White, and
R. R. Anderson,
“Confocal reflectance imaging of folliculitis in vivo: correlation with routine histology,”
J. Cutan Pathol., 26 201
–205
(1999). 0303-6987 Google Scholar
S. Gonzalez,
M. Rajadhayaksha,
G. Rubinstein, and
R. R. Anderson,
“Characterization of psoriasis in vivo by reflectance confocal microscopy,”
J. Med., 30 337
–356
(1999). 0025-7850 Google Scholar
S. Gonzalez,
W. M. White,
M. Rajadhayaksha,
R. R. Anderson, and
E. Gonzalez,
“Confocal imaging of sebaceous gland hyperplasia in vivo to assess efficacy and mechanism of pulsed dye laser treatment,”
Lasers Surg. Med., 25
(1), 8
–12
(1999). https://doi.org/10.1002/(SICI)1096-9101(1999)25:1<8::AID-LSM2>3.0.CO;2-8 0196-8092 Google Scholar
M. Rajadhyaksha,
S. Gonzalez,
J. M. Zavislan,
R. R. Anderson, and
R. H. Webb,
“In vivo confocal scanning laser microscopy of human skin II: advances in instrumentation and comparison with histology,”
J. Invest. Dermatol., 113
(3), 293
–303
(1999). https://doi.org/10.1046/j.1523-1747.1999.00690.x 0022-202X Google Scholar
G. Pellacani and
S. Seidenari,
“Comparison between morphological parameters in pigmented skin lesion images acquired by means of epiluminescence surface microscopy and polarized-light videomicroscopy,”
Clin. Dermatol., 20
(3), 222
–227
(2002). 0738-081X Google Scholar
A. N. Yaroslavsky,
V. Neel, and
R. R. Anderson,
“Demarcation of nonmelanoma skin cancer margins in thick excisions using multispectral polarized light imaging,”
J. Invest. Dermatol., 121
(2), 259
–266
(2003). https://doi.org/10.1046/j.1523-1747.2003.12372.x 0022-202X Google Scholar
W. A. Olivier,
A. Hazen,
J. P. Levine,
H. Soltanian,
S. Chung, and
G. C. Gurtner,
“Reliable assessment of skin flap viability using orthogonal polarization imaging,”
Plast. Reconstr. Surg., 112
(2), 547
–555
(2003). 0032-1052 Google Scholar
W. Lohmann and
E. Paul,
“In situ detection of melanomas by fluorescence measurements,”
Naturwiss., 75 201
–202
(1988). https://doi.org/10.1007/BF00735581 0028-1042 Google Scholar
L. Brancaleon,
A. J. Durkin,
J. H. Tu,
G. Menaker,
J. D. Fallon, and
N. Kollias,
“In vivo fluorescence spectroscopy of nonmelanoma skin cancer,”
Photochem. Photobiol., 73
(2), 178
–183
(2001). https://doi.org/10.1562/0031-8655(2001)073<0178:IVFSON>2.0.CO;2 0031-8655 Google Scholar
A. G. Doukas,
N. S. Soukos,
S. Babusis,
Y. Appa, and
N. Kollias,
“Fluorescence excitation spectroscopy for the measurement of epidermal proliferation,”
Photochem. Photobiol., 74 96
–102
(2001). 0031-8655 Google Scholar
R. Gillies,
G. Zonios,
R. R. Anderson, and
N. Kollias,
“Fluorescence excitation spectroscopy provides information about human skin in vivo,”
J. Invest. Dermatol., 115
(4), 704
–707
(2000). https://doi.org/10.1046/j.1523-1747.2000.00091.x 0022-202X Google Scholar
R. K. Lauridsen,
H. Everland,
L. F. Nielsen,
S. B. Engelsen, and
L. Norgaard,
“Exploratory multivariate spectroscopic study on human skin,”
Skin Res. Technol., 9 137
–146
(2003). 0909-752X Google Scholar
J. Sandby-Moller,
T. Poulsen, and
H. C. Wulf,
“Influence of epidermal thickness, pigmentation, and redness on skin autofluorescence,”
Photochem. Photobiol., 77 616
–620
(2003). https://doi.org/10.1562/0031-8655(2003)077<0616:IOETPA>2.0.CO;2 0031-8655 Google Scholar
L. Knudsen,
C. K. Johansson,
P. A. Philipsen,
M. Gniadecka, and
H. C. Wulf,
“Natural variations and reproducability of in vivo near-infrared Fourier transform Raman spectroscopy of normal human skin,”
J. Raman Spectrosc., 33 574
–579
(2002). https://doi.org/10.1002/jrs.888 0377-0486 Google Scholar
P. J. Caspers,
G. W. Lucassen,
H. A. Bruining, and
G. J. Puppels,
“Automated depth-scanning confocal Raman microspectrometer for rapid in vivo determination of water concentration profiles in human skin,”
J. Raman Spectrosc., 31 813
–818
(2000). https://doi.org/10.1002/1097-4555(200008/09)31:8/9<813::AID-JRS573>3.0.CO;2-7 0377-0486 Google Scholar
P. J. Caspers,
G. W. Lucassen,
E. A. Carter,
H. A. Bruining, and
G. J. Puppels,
“In vivo confocal Raman microspectroscopy of the skin: noninvasive determination of molecular concentration profiles,”
J. Invest. Dermatol., 116
(3), 434
–442
(2001). https://doi.org/10.1046/j.1523-1747.2001.01258.x 0022-202X Google Scholar
P. J. Caspers,
G. W. Lucassen, and
G. J. Puppels,
“Combined in vivo confocal Raman spectroscopy and confocal microscopy of human skin,”
Biophys. J., 85 572
–580
(2003). 0006-3495 Google Scholar
P. J. Caspers,
G. W. Lucassen,
R. Wolthuis,
H. A. Bruining, and
G. J. Puppels,
“In vitro and in vivo Raman spectroscopy of human skin,”
Biospectroscopy, 4 S31
–S39
(1998). https://doi.org/10.1002/(SICI)1520-6343(1998)4:5+<S31::AID-BSPY4>3.0.CO;2-M 1075-4261 Google Scholar
H. G. M. Edwards,
A. C. Williams, and
B. W. Barry,
“Potential applications of FT-Raman spectroscopy for dermatological diagnostics,”
J. Mol. Struct., 347 379
–388
(1995). https://doi.org/10.1016/0022-2860(95)08560-I 0022-2860 Google Scholar
T. R. Hata,
T. A. Scholz,
I. V. Ermakov,
R. W. McClane,
F. Khachik,
W. Gellermann, and
L. K. Pershing,
“Noninvasive Raman spectroscopic detection of carotenoids in human skin,”
J. Invest. Dermatol., 115
(3), 441
–448
(2000). https://doi.org/10.1046/j.1523-1747.2000.00060.x 0022-202X Google Scholar
M. Gniadecka,
O. F. Nielsen,
D. H. Christensen, and
H. C. Wulf,
“Structure of water, proteins, and lipids in intact human skin, hair, and nail,”
J. Invest. Dermatol., 110
(4), 393
–398
(1998). https://doi.org/10.1046/j.1523-1747.1998.00146.x 0022-202X Google Scholar
M. Gniadecka,
H. C. Wulf,
N. N. Mortensen,
O. F. Nielsen, and
D. H. Christensen,
“Diagnosis of basal cell carcinoma by Raman spectroscopy,”
J. Raman Spectrosc., 28 125
–129
(1997). https://doi.org/10.1002/(SICI)1097-4555(199702)28:2/3<125::AID-JRS65>3.0.CO;2-# 0377-0486 Google Scholar
S. Sigurdsson,
P. A. Philipsen,
L. K. Hansen,
J. Larsen,
M. Gniadecka, and
H. C. Wulf,
“Detection of skin cancer by classification of Raman spectra,”
IEEE Trans. Biomed. Eng., 51
(10), 1784
–1793
(2004). https://doi.org/10.1109/TBME.2004.831538 0018-9294 Google Scholar
M. A. Short,
H. Lui,
D. McLean,
H. Zeng,
A. Alajlan, and
X. K. Chen,
“Changes in nuclei and peritumoral collagen within nodular basal cell carcinomas via confocal micro-Raman spectroscopy,”
J. Biomed. Opt., 11
(3), 34004
(2006). 1083-3668 Google Scholar
A. Nijssen,
T. C. Bakker Schut,
F. Heule,
P. J. Caspers,
D. P. Hayes,
M. H. A. Neumann, and
G. J. Puppels,
“Discriminating basal cell carcinoma from its surrounding tissue by Raman spectroscopy,”
J. Invest. Dermatol., 119 64
–69
(2002). https://doi.org/10.1046/j.1523-1747.2002.01807.x 0022-202X Google Scholar
A. Savitzky and
M. J. E. Golay,
“Smoothing and differentiation of data by simplified least squares procedures,”
Anal. Chem., 36 1627
–1639
(1964). https://doi.org/10.1021/ac60214a047 0003-2700 Google Scholar
C. A. Lieber and
A. Mahadevan-Jansen,
“Automated method for subtraction of fluorescence from biological Raman spectra,”
Appl. Spectrosc., 57
(11), 1363
–1367
(2003). https://doi.org/10.1366/000370203322554518 0003-7028 Google Scholar
A. Talukder and
D. Casasent,
“A genral methodology for simultaneous representation and discrimination of multiple object classes,”
Opt. Eng., 37
(3), 904
–913
(1998). https://doi.org/10.1117/1.601925 0091-3286 Google Scholar
S. K. Majumder,
S. Gebhart,
M. D. Johnson,
R. Thompson,
W. C. Lin, and
A. Mahadevan-Jansen,
“A probability-based spectroscopic diagnostic algorithm for simultaneous discrimination of brain tumor and tumor margins from normal brain tissue,”
Appl. Spectrosc., 61
(5), 548
–557
(2007). 0003-7028 Google Scholar
S. K. Majumder,
E. Kanter,
A. Robichaux-Viehoever, H. Jones III, A. Mahadevan-Jansen,
“Near-infrared Raman spectroscopy for in vivo diagnosis of cervical dysplasia: a probability-based multi-class diagnostic algorithm,”
Proc. SPIE, 6430 64300Q
(2007). 0277-786X Google Scholar
N. Stone,
C. Kendall,
N. Shepherd,
P. Crow, and
H. Barr,
“Near-infrared Raman spectroscopy for the classification of epithelial pre-cancers and cancers,”
J. Raman Spectrosc., 33 564
–573
(2002). https://doi.org/10.1002/jrs.882 0377-0486 Google Scholar
W. H. Clark,
L. From,
E. A. Bernardino, and
M. C. Mihm,
“The histogenesis and biologic behavior of primary human malignant melanomas of the skin,”
Cancer Res., 29 705
–726
(1969). 0008-5472 Google Scholar
R. M. MacKie, Skin Cancer, An Illustrated Guide to the Aetiology, Clinical Features, Pathology, and Management of Benign and Malignant Cutaneous Tumours, Year Book Medical, Chicago (1989). Google Scholar
R. L. Moy,
D. P. Taheri, and
A. Ostad, Practical Management of Skin Cancer, Lippincott-Raven, Philadelphia (1999). Google Scholar
R. A. Schwartz, Skin Cancer, Recognition and Management, Springer-Verlag, New York (1988). Google Scholar
|