|
|
1.Introduction1.1.Optical Monitoring of the Effects of Neoadjuvant ChemotherapyNeoadjuvant chemotherapy, or chemotherapy administered prior to the surgical removal of the tumor, is increasingly used for treatment of large and locally advanced breast cancers.1, 2, 3 Neoadjuvant chemotherapy offers two distinct advantages over conventional postsurgical chemotherapy. First, neoadjuvant chemotherapy reduces tumor size prior to surgery, thereby increasing the potential for breast-conserving procedures. Second, neoadjuvant chemotherapy provides physicians an opportunity to evaluate the effectiveness of the treatment on the patient’s tumor. Because therapeutic effectiveness can be quantified, alternative treatment regimens may be implemented if the initial treatment is ineffective. The in vivo evaluation of tumor response to therapy is of particular importance as new treatment options, particularly targeted therapies, become increasingly available for treating breast cancer. Diffuse optical spectroscopy (DOS) and diffuse optical imaging (DOI) have been suggested as techniques that could monitor the physiological effects of neoadjuvant chemotherapy.4, 5, 6, 7, 8 DOS is a noninvasive, bedside-capable technique that quantitatively measures near-infrared (NIR, ) absorption and reduced scattering spectra.9 Absorption spectra are used to calculate the tissue concentrations of oxygenated and deoxygenated hemoglobin (ctHHb), water , and bulk lipid, which are the dominant NIR molecular absorbers in breast tissues. DOS does not require exogenous contrast and rapidly provides quantitative, functional information about tumor biochemical composition, making it potentially desirable from a patient perspective. Typically, DOS samples a low number of spatial locations with a large spectral bandwidth. In contrast, DOI typically samples a large number of spatial locations but with low spectral bandwidth. The relationship between DOS and DOI is comparable to that between magnetic resonance spectroscopy (MRS) and magnetic resonance imaging (MRI). In early-stage clinical studies, DOI and DOS have been used to characterize breast tumor biochemical composition and monitor therapeutic response in Stage II/III patients undergoing neoadjuvant chemotherapy. We have reported the use of DOS to track long-term tumor response to neoadjuvant chemotherapy in a human subject.5 Changes in tissue biochemical composition were quantified over a three-cycle, Adriamycin/Cytoxan (A/C) regimen. Significant reductions in total tumor hemoglobin concentration (ctTHb) and of 56% and 67%, respectively, were observed by the final treatment. Recent studies have supported these findings by comparing optical imaging with MRI and ultrasound after long-term treatment.6, 7, 8 More recently, DOS measurements obtained prior to and into treatment were used to predict final, postsurgical pathological response, as demonstrated in an 11-patient pilot study.4 Tumor concentrations of ctHHb, , and dropped , , and , respectively, within of the first treatment for pathology-confirmed responders , while nonresponders and contralateral normal controls showed no significant differences in these parameters. Tumors displaying higher pretreatment levels of tumor relative to normal tissues also were more likely to respond to neoadjuvant chemotherapy. These results highlight DOS sensitivity to tumor cellular metabolism and biochemical composition and demonstrate its potential for predicting and monitoring an individual’s response to treatment. 1.2.Challenges Presented by Clinical BiopsiesBecause our goal is to introduce DOS as a monitoring tool for neoadjuvant chemotherapy in breast cancer, we must investigate how optical measurements may be influenced by clinical standard-of-care. Biopsy is routinely performed on any suspicious lesion found in the breast via clinical exam or screening mammography. Neoadjuvant chemotherapy may then be prescribed if malignancy has been documented on pathologic review. In general, neoadjuvant chemotherapy is started within days to weeks following pathological confirmation, depending on a variety of factors.10 The inflammatory response and postprocedural bleeding introduced by biopsy, however, present challenges for noninvasive imaging in general, and optical imaging in particular. 1.3.Effects of Wound HealingA biopsy is a tissue-injuring wound that causes the disruption of blood vessels, leakage of blood constituents, inflammation, and bruising.11 The wound-healing response undergoes several overlapping phases: hemostasis, inflammation, proliferation, and remodeling. Hemostasis occurs over minutes after the biopsy. During the inflammatory phase (generally three days post injury), vasodilation occurs, which increases blood flow into the surrounding tissues. In addition, macrophages begin to secrete growth factors such as fibroblast growth factor (FGF-1, FGF-2) and vascular endothelial growth factor (VEGF). These growth factors eventually lead to angiogenesis and resultant blood vessel migration into the wound.12 The proliferative phase, occurring after, mainly involves the production of granulation tissue. Granulation tissue also consists of macrophages, fibroblasts, and blood vessels. The macrophages provide a continuing source of growth factors needed to stimulate fibroplasia and angiogenesis. Remodeling, the longest phase of soft-tissue wound healing, takes several months to complete. Collagen remodeling takes place as granulation tissue is replaced with type I collagen, elastin fibers, proteoglycans, and glycoproteins. As wounds mature and fill with granulation tissue, angiogenesis ceases, and fibroblasts and inflammatory cells slowly disappear as a result of apoptosis.11, 13 In addition, the wound is remodeled and blood flow decreases as a result of fewer blood vessels. Several studies have been conducted to monitor cutaneous wound healing through such techniques as photography,14 odor,15 and sonographic monitoring.16 Yet, fewer studies have been conducted on monitoring soft tissue wound healing, particularly using quantitative methods. 1.4.Project GoalsOur study was designed to determine the amount of time required for the breast to heal from a standard-of-care core biopsy such that DOS/ DOI measurements would be unaffected. Prior to biopsy, a lesion was imaged using a handheld DOS instrument. After the biopsy, the lesion was manually scanned weekly for to quantify the impact of the biopsy within the field of view of the DOS instrument. Based on the current literature stating that the major phases of wound healing would be complete after , we decided to continue evaluating the patient beyond that time frame to ensure that all healing effects could be observed. By quantifying the time scale for wound healing, the time frame needed to minimize biopsy effects on DOS measurements could then be determined. 2.Methods2.1.Laser Breast Scanner InstrumentSpecific details of our DOS instrument, the laser breast scanner (LBS), have been previously described in detail.9 Briefly, the current LBS instrument is a bedside-capable, multiwavelength device that integrates both broadband frequency-domain and broadband steady-state approaches to provide complete tissue absorption and scattering spectra from . Briefly, the frequency-domain component employs six fiber-coupled diode lasers (658, 682, 785, 810, 830, and ) and an avalanche photodiode (APD) detector. Each laser diode is swept in modulation frequency from in 401 steps. 17 The steady-state component employs a fiber-coupled broadband lamp and a fiber-coupled back-illuminated CCD spectrometer (BW Tek, Newark, Delaware). A handheld probe was designed such that both frequency-domain and steady-state approaches interrogated the same region of breast tissue. The source-detector separation distance was fixed at in a reflection-style geometry. Measurement time was less than per spatial location for both frequency-domain and steady-state measurements combined. Calibrations for the frequency-domain and steady-state instruments were performed using a tissue phantom and an integrating sphere, respectively. Simple calculations using known absorber extinction coefficients were used to convert the recovered absorption spectra into the tissue concentrations of deoxyhemoglobin (ctHHb, in ), oxyhemoglobin ( , in ), water ( , in %), and bulk lipids (Lipid, in %), which are the primary NIR absorbers in breast tissue. 18, 19, 20 is the concentration of measured tissue water divided by pure water concentration , whereas tissue lipids are reported as the percentage lipid measured relative to an assumed “pure” lipid density of . Thus, reported water and lipid percentages are relative figures of merit compared to pure solutions of the substance and are neither strict volumes nor add to 100%. The reduced scattering properties of tissue are reported as the results of a power-law fit to the measured frequency-domain reduced scattering values.21 The absolute value of the exponent resulting from this fit is termed the scatter power (SP), and the prefix is termed the scatter amplitude (A). In general, the SP is related to the size of the tissue scattering particles in relation to the optical wavelength, and the A is related to the density of the scattering centers. A tissue optical index (TOI) was also calculated according to the formula . The TOI has been shown to be a useful index for the detection of malignant breast lesions by combining the highest-contrast parameters into a single expression.9 All calculations were performed using custom algorithms developed within the MATLAB platform. 2.2.Measurement SequenceA single subject was recruited for this case study. The subject provided informed written consent to participate in this research study, which was approved by the University of California, Irvine, Institutional Review Board (Protocol #95-563). The subject was a -old female with a suspicious mass in the right breast at the 3 o’clock position from the nipple. Standard clinical ultrasound indicated that the lesion was well circumscribed and homogeneous, measuring 3.7 by 1.8 by . LBS measurements were performed on the subject over an cycle (Table 1 ). The initial LBS measurement was taken prior to a standard core biopsy. Pathology indicated that the sampled lesion was a benign fibroadenoma. Subsequent LBS measurements were performed weekly thereafter to monitor breast optical properties throughout the wound-healing process, as outlined in Table 1; a total of eight postbiopsy LBS measurements were performed. Because the subject was premenopausal, we also related LBS measurement dates to patient menstrual cycle phases. In order to approximate the subject’s phase in menstrual cycle, menses onset dates were recorded. The menstrual cycle length was calculated as the first day of the menses to the last day before next menses. The assumption that the luteal phase is approximately prior to the onset of menses was used to postulate when the ovulatory phase occurred. Table 1Laser breast scanner measurement schedule.
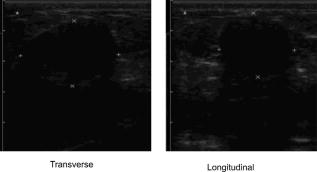
2.3.Diffuse Optical Spectroscopy Measurement TechniqueCare was taken to perform LBS measurements with the patient in a consistent position. The subject laid supine with her arm up above her head on a recliner at about from horizontal for all LBS measurements. An ultrasound was then performed to visualize the breast lesion position at the time of the baseline LBS measurement. A steady-state broadband-only scan was done to quickly visualize the areas of greatest optical attenuation over the lesion localized by ultrasound. The point of highest attenuation was assumed to be the best representation of the lesion and was chosen as the center of the LBS scan area (Fig. 1a ). A -spaced point grid measuring 50 by was marked on the breast using a nonpermanent surgical skin marker. Within our coordinate system, the nipple was taken to be the origin, with the LBS scan area centered on the ( , ) location. The large scan area was chosen to cover regions of the breast both with and without the lesion. The top leftmost point of the grid ( , ) was measured with respect to the nipple and recorded to remark the LBS scan area on the subject during subsequent LBS measurements. On the contralateral normal breast, a partial grid covering the same area as the lesion was also marked and measured as a control. LBS measurements were performed at each spatial grid location by moving the handheld probe to each marked location. The instrument probe was placed with light gravitational pressure without compression on the skin surface. The average penetration depth of the light was calculated to be approximately below the surface of the skin. Fig. 1(Left) Areas of the breast mapped by the LBS. Each small circle represents a single LBS measurement. Complete absorption and reduced scattering spectra were obtained at each spatial location. Measurements were also conducted on the contralateral normal side for comparison. (Right) Trajectory of the biopsy needle in a medial-lateral view. Notice that the needle direction lies under the LBS measurement area. Thus, the direction of the biopsy was not orthogonal to the mapped breast surface.  Maps of breast tissue physiological properties were generated by calculating the DOS-measured parameters at each grid location.9 No tomographic reconstructions were used, and the tissue within the field of view was assumed to be homogeneous in accordance with the standard diffusion approximation. Map points were interpolated using 2-D nearest-neighbor cubic splines to round out the discrete shapes. All image thresholds were performed using the maximum and minimum values of the image. A four-stage color bar was used with RGB values of (0,0,0), (0,0,255), (0,255,255), and (255,255,255) to display all functional maps. The lesion center was defined as the spatial location of the TOI maximum in accordance with our previous studies.9 The spatial extent of the lesion was then defined as the full width at half maximum (FWHM) of the TOI image, as we have done for a single axis in previous nonimaging studies. The TOI FWHM image then formed a mask for the images of other optical properties. Because of the limited spatial sampling of the lesion (i.e., only a few points are typically found inside the uninterpolated lesion masks), we have reported the maximum value within the FWHM as a value representative of the lesion Feature-based stratification was preferred to a strict spatial segmentation of lesion area to guard against possible movement of the lesion and/or optically scanned area. Normal tissue values were taken to be the average of DOS-measured parameters from the same spatial location on the contralateral normal breast. The calculated standard deviations, typically from the background and other normal tissue regions, represents the variation in the measured parameter across the image area. Images were rethresholded by TOI FWHM for each measurement date. 2.4.UltrasoundAn ultrasound of the lesion was performed in order to determine the position, orientation depth, and size (Fig. 2 ). Ultrasound showed a well-circumscribed, solid mass at the 3 o’clock position of the right breast, from the nipple. The ultrasound was taken in two views: transverse and longitudinal. The lesion dimensions in the transverse and longitudinal orientations were measured to be approximately and , respectively. 2.5.Needle Core BiopsyA needle core biopsy was administered by a general surgeon after a baseline DOS measurement session. An incision was made at the surface of the breast at a site away from the lesion [Fig. 1a]. Figure 1b depicts the orientation of the biopsy needle in relationship to the lesion location and the DOS scan in a medial-lateral view. The needle was inserted through the incision site and tracked through the lesion in the breast (dotted line). The LBS scan area was performed in the direction indicated in the figure. The position of the incision site was noted at each DOS measurement. On day 9, the incision scar was red and about the same size as the tip of the surgical marker used to mark the breast. The patient claimed the area was tender, but there was no irritation or bruising visible. By day 23, the redness at the site of incision had completely dissipated. On day 44, the patient reported that her breasts felt swollen. Her menses began on day 46. 3.Results3.1.Fibroadenoma Functional PropertiesFigure 3 displays a spatial map of (a) ctHHb and (b) of the lesion and surrounding normal tissue prior to biopsy. The lesion area is the optical property in question that is above a threshold of the TOI FWHM. In agreement with our past broadband spectroscopic studies of benign 22 and malignant9 lesions, Fig. 3 displays elevated water and hemoglobin concentrations relative to normal background tissue. The dark region on the left of the map is the areola, which was manually filtered from the map. and ctHHb are on average 19 and 33% respectively higher in the lesion compared to normal tissue. If we constrain the lesion to the signal above the parameter FWHM, the lesion size is approximately 20 by . However, we note that the peak values of and ctHHb are not always colocalized.9 Fig. 3Maps of the fibroadenoma optical properties prior to biopsy: (a) deoxyhemoglobin concentration and (b) water concentration. The areola region on the far-left side of the map was filtered out of each image.  The baseline lesion map of the TOI contrast function is presented in Fig. 4 . The TOI map displays features similar to both and ctHHb maps. The FWHM of the baseline TOI map is provided in Fig. 4b; TOI values within the FWHM were averaged together to provide a value representative of the lesion. All DOS-measured parameters (i.e., ctHHb) were averaged over the same TOI FWHM thresholded area. Fig. 4Baseline maps of fibroadenoma TOI. (a) Standard TOI map, using data from the previous figure. (b) Full width at half maximum (FWHM) of the baseline TOI image. The TOI values within the FWHM were averaged to provide a tumor-averaged TOI value. For other parameters, the same area was used for the average: thus, for ctHHb, the same area as the FWHM of the TOI was used for the tumor-averaged ctHHb value. 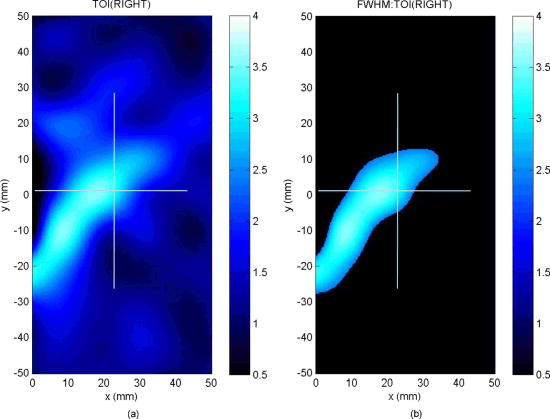 3.2.Serial Tissue Optical Index MapsFigure 5 presents a series of lesion TOI maps taken over the course of an additional in the same human subject. Note that all maps have been rescaled to the maximum and minimum TOI values for comparison (which is mostly dominated by day 9). The initial map was acquired at baseline ( prebiopsy), with subsequent maps measured on dates listed in Table 1. The TOI map measured postbiopsy demonstrated a clear localized TOI increase in the vicinity of the lesion, which was likely the result of the biopsy via inflammation and bleeding. A general decreasing trend in TOI followed, which returned to baseline values postbiopsy. Several weeks after the initial biopsy, however, the TOI continued to oscillate, demonstrating another return to TOI baseline postbiopsy. We note that the “tail” region in the lower-left corner of the baseline image was still present in subsequent images when independently scaled, but it is not visible in this figure upon matching scales. 3.3.Image AnalysisFigure 6a provides a quantitative analysis of the previous lesion maps to facilitate comparisons; Figure 6b does the same for normal regions of the breast. “Lesion” values represent the peak TOI value within the TOI FWHM; in general, only a few actual DOS measurements were found within the TOI FWHM. “Background” values represent the average of the points in the same map that were below the TOI FWHM threshold, covering approximately a field of view. “Normal” values were averaged over all map points taken from the contralateral breast. No distinction is made between lesion and biopsy areas because our low spatial sampling makes it hard to reliably separate the two areas. Fig. 6Summary of serial TOI map analysis for the lesion. (a) The average values for each DOS-measured parameter averaged over the lesion TOI is provided. The error bars represent the degree of variance over the averaged area, and thus represent the heterogeneity of the tissue. (b) TOI for the remaining tissue in the lesion-containing breast and contralateral normal breast.  The maximum TOI values show a clear peak at day 9, followed by an oscillatory behavior, in accordance with the images from Fig. 5. Although it is difficult to test for statistical significance with large disparity between sampled points (many in background, few in lesion), we can test to see that the background and lesion values are correlated. The background and lesion TOI values are strongly correlated, both with ( , ) and without ( , ) the inclusion of day 9. More importantly, the weekly changes in background and lesion TOI are also correlated, both with ( , ) and without ( , ) the inclusion of day 9. These correlations suggest that the TOI changes in both background and lesion tend to track each other. In terms of TOI values averaged over the lesion FWHM at baseline, the average lesion TOI value was , with an average background TOI value of and an average normal TOI value of . The maximum averaged TOI value was 3.03. The average lesion TOI also followed an oscillatory pattern, with a period of approximately . The higher peak (day 9) is the result of the biopsy, as described earlier. Figure 7 presents a quantitative analysis of the lesion maps for all other DOS-measured basis parameters in order to understand the origin of TOI changes in Fig. 6. In each panel, we plot the lesion maximum value (top plot), along with the average value and standard deviation of the normal tissue value (bottom plot). Panel (a) is the tissue water: there is a large increase on day 9 from the biopsy, and also a mild increase in a nearly periodic trend nearly later. The ctHHb does not display this behavior [panel (b)] with a rather flat distribution in the normal tissue. The lesion increase occurs after day 9. and lipids do not show remarkable features [panels (c) and (d), respectively], although the lipids do decrease in the latter portion of the measurements. The log of the scatter amplitude [LN(A)] in panel (e) shows a significant increase on the day of the biopsy and also later in the cycle on day 44; this second increase does not seem to coincide with the observed TOI changes. Tumor and normal are plotted on different scales to emphasize the relative magnitude of the changes in each tissue. Thus, it appears that the water increase and slight lipid decrease are most responsible for the increased TOI. Fig. 7Summary of serial map analysis for the lesion, but for all DOS-basis parameters. For the tumor tissue (top panels), the max value is plotted (as in Fig. 6). For the normal tissue (bottom panels), the average value, with standard deviation, is plotted. For normal tissues, the variations are about 4% , 3% (lipids), 14% , 10% (ctHHb), and 10% (LN(A)). 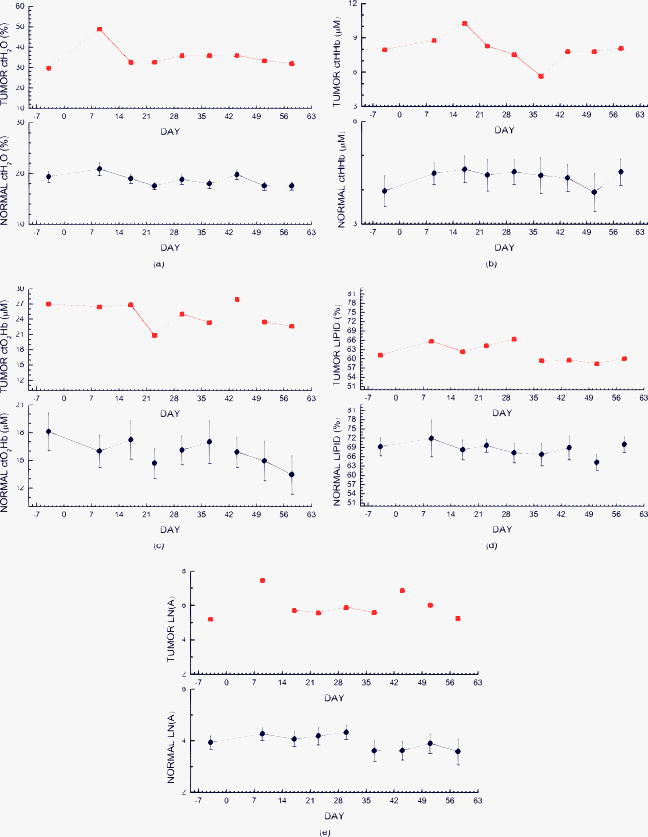 4.Discussion4.1.Wound-Healing ResponseThe changes observed in DOS-measured parameters following breast biopsy were consistent with known soft tissue healing responses. Day 9 postbiopsy corresponds to the proliferation and remodeling phases of healing where blood flow increases and fluids accumulate in the injured tissue.23 Alterations to the extracellular matrix also occur through the formation of granulation tissue and collagen.24 The 10% increase in DOS-measured ctHHb, 65% increase in , and 43% increase in LN(A) at day 9 are most likely due to these effects. These results are all significant when compared to the normal fluctuations seen in the normal breast on the same day, where ctHHb increased 13%, increased 8%, and LN(A) increased by 9%. ctHHb, , LN(A), and TOI values recovered to their baseline values by day 23 postbiopsy. On day 23, we also noted that the surface on the incision scar visually healed. Therefore, in this patient, we assumed that the effects of the biopsy on DOS optical parameters dissipated after approximately . Individual response rates may vary with different patients, but the wound healing time frame is consistent with what has been reported by Hom.23 The presence of bruises may prolong these effects, and thus our case study may not represent the full spectrum of possible healing responses. Past studies reporting the effects of chemotherapy upon tissue optical properties have shown a 26% and 37% decrease in hemoglobin and water, respectively, within the first of therapy.9 By comparing this to the 10% and 65% increase observed in hemoglobin and water postbiopsy, it is evident that the effects of biopsy must be accounted for or avoided before monitoring lesion changes. The effects of the wound-healing process must be deconvolved from any lesion shrinkage or growth effects. 4.2.Menstrual Cycle FluctuationsClose inspection of the data on both biopsied and normal breasts revealed that functional changes continued well after the effects of the biopsy should have dissipated. Furthermore, the period of these changes roughly approximated the length of the menstrual cycle. Although only a few optical studies of breast physiology in the menstrual cycle have been conducted, these studies have demonstrated that measurable functional changes exist in some patients.25, 26, 27 Mammographic density fluctuations resulting from the menstrual cycle appear to depend upon overall breast density, so that we expect considerable variation in these functional changes across patients.28 Studies have shown increases in breast tissue vascularity and density during the midluteal phase, as well as increases in breast volume during the end-luteal phase of the menstrual cycle.25, 26, 27, 28 These processes were observed in the biopsied breast through increases in hemoglobin, scatter power, and water, during the midluteal phase (postbiopsy day 37), as well as through an increase in water during the end luteal phase (postbiopsy day 44). Although the normal breast followed these trends in , , and bulk lipid, it did not follow in ctHHb or LN(A). The greater variation in DOS parameters in the biopsied breast suggests that the lesion was more sensitive to hormonal fluctuations brought on by the menstrual cycle than the normal breast tissue. This observation has important implications. Clearly, the timing of the menstrual cycle should be taken into account for diagnostic imaging, as is done for other imaging modalities. The same effect can have significant implications for longitudinal studies. For example, TOI decreases may not be due to reductions in angiogenesis, but instead due to menstrual-induced hormonal fluctuations. Alterations in lesion functional properties in response to hormonal variations may have further implications. The use of hormonal therapies (i.e., estrogen receptor targets, aromitase inhibitors) may necessitate a direct evaluation of lesion hormonal response. Biochemical changes in a lesion have been shown to be important for evaluating response to neoadjuvant chemotherapy,4 but hormonal response from endogenous and exogenous hormones, be they estrogen agonists or antagonists, may be equally important for making proper therapeutic choices. Further study will be required. 5.ConclusionsOur study illustrates that alterations of breast tissue biochemistry resulting from a biopsy and endogenous hormonal stimulation may be quantified using DOS. The effects of the biopsy in this patient subsided after approximately , which is generally expected during the wound-healing process. While patient healing response will vary, we expect that should be sufficient for the effects of a biopsy to not interfere with DOS and DOI. We note that for large lesions, which are typical in neoadjuvant chemotherapy, it may be possible to biopsy one region of the lesion and optically sample the remainder of the lesion. We further demonstrated that the menstrual cycle affects both normal and lesion optical properties. The hormonal sensitivity of a lesion may impact future studies of breast cancer therapeutic response to hormonal agents. AcknowledgmentsThis work was supported by the National Institutes of Health under grants Grant Nos. P41-RR01192 [Laser Microbeam and Medical Program (LAMMP)] and U54-CA105480 [Network for Translational Research in Optical Imaging (NTROI)], the California Breast Cancer Research Program, and the Chao Family Comprehensive Cancer Center (P30-CA62203). Beckman Laser Institute Programmatic support from the Beckman Foundation and the Medical Free Electron Laser Program (AFOSR) is gratefully acknowledged. The authors wish to thank Montana Compton for her assistance with organizing the clinical trial and the patient who cheerfully volunteered her time to participate in this study. ReferencesI. C. Smith, S. D. Heys, A. W. Hutcheon, I. D. Miller, S. Payne, F. J. Gilbert, A. K. Ah-See, O. Eremin, L. G. Walker, T. K. Sarkar, S. P. Eggleton, and K. N. Ogston,
“Neoadjuvant chemotherapy in breast cancer: significantly enhanced response with docetaxel,”
J. Clin. Oncol., 20
(6), 1456
–1466
(2002). 0732-183X Google Scholar
B. Fisher, J. Bryant, N. Wolmark, E. Mamounas, A. Brown, E. R. Fisher, D. L. Wickerham, M. Begovic, A. DeCillis, A. Robidoux, R. G. Margolese, A. B. Cruz Jr., J. L. Hoehn, A. W. Lees, N. V. Dimitrov, and H. D. Bear,
“Effect of preoperative chemotherapy on the outcome of women with operable breast cancer,”
J. Clin. Oncol., 16
(8), 2672
–2685
(1998). 0732-183X Google Scholar
E. R. Fisher, J. Wang, J. Bryant, B. Fisher, E. Mamounas, and N. Wolmark,
“Pathobiology of preoperative chemotherapy: findings from the National Surgical Adjuvant Breast and Bowel (NSABP) protocol B-18,”
Cancer, 95
(4), 681
–695
(2002). 0008-543X Google Scholar
A. Cerussi, D. Hsiang, N. Shah, M. Compton, R. Mehta, A. F. Durkin, and B. Tromberg,
“Predicting response to breast cancer neoadjuvant chemotherapy using diffuse optical spectroscopy,”
Proc. Natl. Acad. Sci. U.S.A., 104
(10), 4014
–4019
(2007). https://doi.org/10.1073/pnas.0611058104 0027-8424 Google Scholar
D. B. Jakubowski, A. E. Cerussi, F. Bevilacqua, N. Shah, D. Hsiang, J. Butler, and B. J. Tromberg,
“Monitoring neoadjuvant chemotherapy in breast cancer using quantitative diffuse optical spectroscopy: a case study,”
J. Biomed. Opt., 9
(1), 230
–238
(2004). https://doi.org/10.1117/1.1629681 1083-3668 Google Scholar
Q. Zhu, S. H. Kurtzma, P. Hegde, S. Tannenbaum, M. Kane, M. Huang, N. G. Chen, B. Jagjivan, and K. Zarfos,
“Utilizing optical tomography with ultrasound localization to image heterogeneous hemoglobin distribution in large breast cancers,”
Neoplasia, 7
(3), 263
–270
(2005). https://doi.org/10.1593/neo.04526 1522-8002 Google Scholar
R. Choe, A. Corlu, K. Lee, T. Durduran, S. D. Konecky, M. Grosicka-Koptyra, S. R. Arridge, B. J. Czemiecki, D. L. Fraker, A. DeMichele, B. Chance, M. A. Rosen, and A. G. Yodh,
“Diffuse optical tomography of breast cancer during neoadjuvant chemotherapy: a case study with comparison to MRI,”
Med. Phys., 32
(4), 1128
–1139
(2005). https://doi.org/10.1118/1.1869612 0094-2405 Google Scholar
N. Shah, J. Gibbs, D. Wolverton, A. Cerussi, N. Hylton, and B. J. Tromberg,
“Combined diffuse optical spectroscopy and contrast-enhanced magnetic resonance imaging for monitoring breast cancer neoadjuvant chemotherapy: a case study,”
J. Biomed. Opt., 10
(5), 51503
(2005). 1083-3668 Google Scholar
A. Cerussi, N. Shah, D. Hsiang, A. Durkin, J. Butler, and B. J. Tromberg,
“In vivo absorption, scattering, and physiologic properties of 58 malignant breast tumors determined by broadband diffuse optical spectroscopy,”
J. Biomed. Opt., 11
(4), 044005
(2006). https://doi.org/10.1117/1.2337546 1083-3668 Google Scholar
S. S. Gorin, J. E. Heck, B. Cheng, and S. J. Smith,
“Delays in breast cancer diagnosis and treatment by racial/ethnic group,”
Arch. Intern Med., 166
(20), 2244
–2252
(2006). 0003-9926 Google Scholar
A. J. Singer and R. A. Clark,
“Cutaneous wound healing,”
N. Engl. J. Med., 341
(10), 738
–746
(1999). https://doi.org/10.1056/NEJM199909023411006 0028-4793 Google Scholar
M. G. Tonnesen, X. Feng, and R. A. Clark,
“Angiogenesis in wound healing,”
J. Investig. Dermatol. Symp. Proc., 5
(1), 40
–46
(2000). 1087-0024 Google Scholar
F. Arnold and D. C. West,
“Angiogenesis in wound healing,”
Pharmacol. Ther., 52
(3), 407
–422
(1991). https://doi.org/10.1016/0163-7258(91)90034-J 0163-7258 Google Scholar
J. K. Kiecolt-Glaser, P. T. Marucha, W. B. Malarkey, A. M. Mercado, and R. Glaser,
“Slowing of wound healing by psychological stress,”
Lancet, 346
(8984), 1194
–1196
(1995). 0140-6736 Google Scholar
J. E. Greenwood, B. A. Crawley, S. L. Clark, P. R. Chadwick, D. A. Ellison, B. A. Oppenheim, and C. N. McCollum,
“Monitoring wound healing by odor,”
J. Wound Care, 6
(5), 219
–221
(1997). 0969-0700 Google Scholar
K. Hoffmann, K. Winkler, S. el-Gammal, and P. Altmeyer,
“A wound healing model with sonographic monitoring,”
Clin. Exp. Dermatol., 18
(3), 217
–225
(1993). 0307-6938 Google Scholar
T. H. Pham, O. Coquoz, J. B. Fishkin, E. Anderson, and B. J. Tromberg,
“Broad bandwidth frequency domain instrument for quantitative tissue optical spectroscopy,”
Rev. Sci. Instrum., 71
(6), 2500
–2513
(2000). https://doi.org/10.1063/1.1150665 0034-6748 Google Scholar
W. G. Zijlstra, A. Buursma, and W. P. Meeuwsen-van der Roest,
“Absorption spectra of human fetal and adult oxyhemoglobin, de-oxyhemoglobin, carboxyhemoglobin, and methemoglobin,”
Clin. Chem., 37
(9), 1633
–1638
(1991). 0009-9147 Google Scholar
L. Kou, D. Labrie, and P. Chylek,
“Refractive indices of water and ice in the spectral range,”
Appl. Opt., 32
(19), 3531
–3540
(1993). 0003-6935 Google Scholar
C. Eker,
“Optical characterization of tissue for medical diagnostics,”
Department of Physics, Lund Institute of Technology,
(1999). Google Scholar
J. R. Mourant, T. Fuselier, J. Boyer, T. M. Johnson, and I. J. Bigio,
“Predictions and measurements of scattering and absorption over broad wavelength ranges in tissue phantoms,”
Appl. Opt., 36
(4), 949
–957
(1997). https://doi.org/10.1364/AO.36.000949 0003-6935 Google Scholar
A. E. Cerussi, D. Jakubowski, N. Shah, F. Bevilacqua, R. Lanning, A. J. Berger, D. Hsiang, J. Butler, R. F. Holcombe, and B. J. Tromberg,
“Spectroscopy enhances the information content of optical mammography,”
J. Biomed. Opt., 7
(1), 60
–71
(2002). https://doi.org/10.1117/1.1427050 1083-3668 Google Scholar
D. Hom,
“Wound healing in relation to scarring,”
111
–123
(1998). Google Scholar
K. S. Midwood, L. V. Williams, and J. E. Schwarzbauer,
“Tissue repair and the dynamics of the extracellular matrix,”
Int. J. Biochem. Cell Biol., 36
(6), 1031
–1037
(2004). 1357-2725 Google Scholar
R. Cubeddu, C. D’Andrea, A. Pifferi, P. Taroni, A. Torriceili, and G. Valentini,
“Effects of the menstrual cycle on the red and near-infrared optical properties of the human breast,”
Photochem. Photobiol., 72
(3), 383
–391
(2000). https://doi.org/10.1562/0031-8655(2000)072<0383:EOTMCO>2.0.CO;2 0031-8655 Google Scholar
N. Shah, A. Cerussi, C. Eker, J. Espinoza, J. Butler, J. Fishkin, R. Hornung, and B. Tromberg,
“Noninvasive functional optical spectroscopy of human breast tissue,”
Proc. Natl. Acad. Sci. U.S.A., 98
(8), 4420
–4425
(2001). https://doi.org/10.1073/pnas.071511098 0027-8424 Google Scholar
B. W. Pogue, S. Jiang, H. Dehghani, C. Kogel, S. Soho, S. Srinivasan, X. Song, T. D. Tosteson, S. P. Poplack, and K. D. Paulsen,
“Characterization of hemoglobin, water, and NIR scattering in breast tissue: analysis of intersubject variability and menstrual cycle changes,”
J. Biomed. Opt., 9
(3), 541
–552
(2004). https://doi.org/10.1117/1.1691028 1083-3668 Google Scholar
E. White, P. Velentgas, M. T. Mandelson, C. D. Lehman, J. G. Elmore, P. Porter, Y. Yasui, and S. H. Taplin,
“Variation in mammographic breast density by time in menstrual cycle among women aged ,”
J. Natl. Cancer Inst., 90
(12), 906
–910
(1998). https://doi.org/10.1093/jnci/90.12.906 0027-8874 Google Scholar
|