
|
|
1.IntroductionDiffuse reflectance spectroscopy is a technique able to provide spectra that contain information about the chromophore content, mainly melanin and hemoglobin. In addition, spectral features are related to morphological changes at the cellular level, which have been exploited to discriminate benign from malignant tissue in different pathologies.1, 2, 3, 4 We have recently reported on studies using reflectance spectroscopy in a multispectral imaging technique focused on the computer-assisted diagnosis of melanoma.5, 6 The results derived from those studies did raise the following question. Could reflectance spectroscopy somehow provide information on the various steps of tumor progression from melanocytic lesion to dysplastic nevus, horizontal growth phase melanoma, and vertical growth phase melanoma?7 The physiological color of the skin is produced by a combination of different pigments, mainly melanin and hemoglobin. In melanocytic lesions, melanin is certainly the pigment that mainly determines the color. However, at wavelengths in the visible region, absorption spectra of blood and melanin overlap each other and it is a very hard task to establish the weight by which each pigment contributes to the reflectance spectra of a melanocytic lesion. In contrast, in the near-infrared region, at wavelengths longer than , absorption is dominated by melanin, and diffuse reflectance spectra may give information on the absorption spectrum of melanin and, virtually, its content and distribution in the lesion. Melanin is a very complex absorbing material and falls into two main classes: eumelanin, a black-to-dark-brown particle generally derived from dopa and found in skin, hair, eyes, and pheomelanin, a yellow-to-reddish-brown particle, generally derived from cysteinyldopa and found in red hair and red feathers. Eumelanin and pheomelanin may coexist in nature. Comprehensive studies have been recently reported on physical and chemical properties of melanin.8, 9, 10 Quantitative analyses of melanin in in vitro and in ex vivo tissues have been extensively studied mainly by means of high-performance liquid chromatography and of optical spectroscopy.11, 12, 13, 14, 15, 16, 17, 18, 19 In contrast, data on in vivo optical characteristics of melanin are scarcely reported. The first published works on the assessment of melanin in human skin in vivo using reflectance spectroscopy were reported in the 1980’s.20, 21 Since then, to our knowledge optical properties of melanin of in vivo pigmented lesions have been reported only recently.22, 23 Melanocytic nevi involve a combination of eumelanin and pheomelanin, and the degree of melanogenesis has been suggested as a reliable marker for differentiation of the melanocyte.16, 18, 24 The purpose of this study was two-fold: 1. to assess whether reflectance spectroscopy might somehow provide evidence of the existence of various steps of tumor progression from melanocytic lesion to dysplastic nevus, horizontal growth phase melanoma, and vertical growth phase melanoma, and 2. to evaluate the possible role that melanin might play in tumor progression. To this aim, a retrospective analysis was performed on 1671 multispectral images of in vivo pigmented skin lesions previously recruited in the framework of a study focused on the computer-assisted diagnosis of melanoma. The lesions were divided according to histological diagnosis into the following groups: common nevi (CN), dysplastic nevi (DN), in situ melanomas (IsM), invasive horizontal growth phase melanomas (HGPM), and vertical growth phase melanomas (VGPM). 2.Methods2.1.Study PopulationThis study involved a series of 1671 pigmented skin lesions on 1525 patients consecutively recruited at the Istituto Nazionale Tumori of Milan over a three-year period. The lesion selection was based on clinical and/or dermoscopic features that supported suspicion for melanoma. All the lesions were then subjected to surgical excision for hystopathological diagnosis. The slides were evaluated according to widely accepted criteria for histopathological diagnoses.25 Multispectral images of the 1671 lesions were acquired in vivo before surgery. If the lesion and the surrounding skin were hairy, to not interfere with reflectance measurement, hairs were shaved with a razor before acquiring the image. Among the 1671 lesions, 288 were histologically proven as primary melanomas. Melanomas were classified according to histology into three groups: IsM , HGPM , and VGPM . In addition, 424 lesions were histologically proven as DN and 957 as CN, mainly junctional and compound nevi. 2.2.Image Acquisition SystemAll measurements presented here were carried out using a spectrophotometric system (SpectroShade®, MHT, Verona, Italy) that allowed us to acquire multispectral images of the lesions. The system is mainly composed of an illumination assembly located inside a PC and an external detection device placed in a probe head. The principal components of the illumination assembly are a light source, a diffraction grating, which allows illumination at different wavelengths, and a bundle of optical fibers coupled to the probe head. The individual fibers are arranged in such a way to ensure an illumination as homogeneous as possible of the lesion and the surrounding normal skin. Images of the lesions were acquired at 11 different wavelengths ( bandwidth) between 483 and . All images acquired within a useful area of (spatial resolution of ) were stored in the PC. A lesion contour was evaluated at each wavelength and the correspondent lesion reflectance was obtained by averaging the content of all the pixels enclosed in the contour. Image analysis was performed by a dedicated software integrated in the computerized system with a 256 gray level contrast resolution. Further details on the image processing and lesion segmentation are reported elsewhere.26 2.3.Theoretical Model for Pigment AssessmentA proposal was reported for the separation of the absorption by melanin from that by hemoglobin.27 According to this model, the absorbance characteristics and estimation of human melanin in vivo were assessed by applying the logarithm base ten to the ratio of diffuse reflectance spectra from vitiligo-involved skin, divided by that of normal skin of the same individual.20, 21 Similarly, we evaluated the absorbance characteristics of melanin in melanocytic lesions by applying the logarithm base ten to the ratio of diffuse reflectance spectra from normal skin of the patient, divided by that of his/her pigmented lesion, i.e., according to the following equation, where is the absorbance of the lesion, is the diffuse reflectance of the lesion, and is the diffuse reflectance of the nearby skin. Absorbance spectra of the lesions were analyzed at wavelengths longer than , where melanin absorption usually dominates with respect to that of hemoglobin. Assuming that melanin absorption does not significantly deviate from linearity in the near-infrared region,28 a linear fit from was performed on the absorbance spectrum of each lesion according towhere and are the slope and the intercept, respectively, of the calculated straight line.If and are linearly correlated within each group of lesions, it follows that both are correlated to the absorber(s) concentration, and the absorber(s) is the same for all the lesions within its correspondent group.20 Although the blood absorption coefficient is usually 1 order of magnitude, at least, lower that that of melanin, an abnormal blood flow can be expected in melanocytic lesions, especially when melanomas are concerned.29, 30, 31 The presence of an increased vascularity relative to normal skin should not be neglected. 2.4.Modeling Diffuse Reflectance of Skin and LesionsTo simulate the diffuse reflectance from skin and lesion, we exploited the simple and practical model previously proposed.32 It has to be noted that the model was developed for analysis of diffuse reflectance measured with a -core optical fiber, and it may be not very accurate in the whole range of wavelengths for the imaging geometry employed in this study. According to the model, the diffuse reflectance is given by where is the reduced scattering coefficient spectrum, is the absorption coefficient spectrum, and and are empirical parameters. The optical parameters were related to the absorption and scattering properties of skin by the following equations: where is the blood fraction; is the hemoglobin oxygen saturation; and are the absorption coefficient spectra of oxyhemoglobin and deoxyhemoglobin, respectively,33 assuming Hb per liter of blood; and are the concentration [mg/ml] and the extinction coefficient spectra of eumelanin,8 respectively; and are the concentration [mg/ml] and the extinction coefficient spectra of pheomelanin,8 respectively; is the water fraction; and is the absorption coefficient spectrum of water.34 The power-law dependence of was derived from a previous work.35 The experimental data of and were fitted by an exponential function , resulting in and . Our choice for absorption spectra of eumelanin and pheomelanin can be considered somewhat arbitrary. Unfortunately, eumelanin and pheomelanin are not as well defined and characterized, as the correspondent absorption spectra. As a consequence, we used the data found in the literature8 that might allow us to extract representative spectra of the extinction coefficient. To mimic lesions with different contents of pheomelanin, eumelanin, and blood, the concentrations of pheomelanin and eumelanin were varied from in steps of 0.1, and blood fraction from 0.01 to 0.3 in steps of 0.01. Absorbance spectra of simulated lesions with different concentrations of eumelanin, pheomelanin, and blood fractions were calculated according to Eq. 1, where was the reflectance of a simulated melanin-free skin with . Then, those absorbance spectra were linearly fitted from according to Eq. 2, giving a couple for different concentrations of eumelanin, pheomelanin, and blood fraction.Two matrices of data were calculated at 30 different blood fractions, which were used to generate two look-up tables (LUTs). Figure 1 shows a 3-D representation of the resulting LUTs, and . For clarity, only the surfaces with a vascularity ratio of 1 and 30 have been drawn, and the differences related to the great vascularity is recognizable. At low values of total melanin concentration, e.g., , the values of slope and intercept are close to zero, but the effect of vascularity is not negligible. In fact, the relative difference between the two surfaces can reach up to 100% at very low melanin concentrations. 2.5.Pheomelanin and Eumelanin Content Assessment in In Vivo LesionsGiven the coordinate derived from the linear fit of the lesion absorbance spectrum, the content of eumelanin and pheomelanin at 30 values of blood fraction was assessed using the LUT-based inverse model. The uniqueness of the result, i.e., that an assessed value of pheomelanin corresponded to only one value of eumelanin and vice versa, was guaranteed by the monotonic trend of the LUTs. 3.ResultsFigure 2 shows the scatter plot of the slope versus the intercept of the straight line fitting of the absorbance spectrum from for each lesion. In very few cases only, linear fit ended with inconsistent results, e.g., a positive value of instead of being negative, as expected, and the correspondent lesions were discarded. The coefficient of each fit of the remaining lesions was greater than 0.9, thus confirming the assumption of Eq. 2. Of the recruited lesions, 99.4% of CN , 98.8% of DN , 100% of IsM , 98.6% of HGPM , and 99.5% of VGPM could be processed. The reason for those inconsistent results was due to failure in the lesion segmentation. It has to be noted that the coordinates of the barycenter of each scatter plot correspond to the slope and intercept resulting from the linear fit of the absorbance mean values of each group of lesions. Fig. 2Scatter plot of the slope versus the intercept of the straight line fitting of the absorbance spectrum from for each lesion. Each point represents one lesion. The dotted lines represent the 95% confidence level of the straight line fitted through all the points. The resulting slopes were , , , , and for (a) CN, (b) DN, (c) IsM, (d) HGPM, and (e) VGPM, respectively. The enlarged point represents the barycenter coordinate. (f) reports the slope of the straight line fit for the different groups.  Slope and intercept were of and for CN, and for DN, and for IsM, and for HGPM, and for VGPM. At 95% confidence level, the straight lines related to the mean absorbance of both CN and DN were significantly different from the straight lines of IsM, HGPM, and VGPM, indicating that absorbance of CN and DN is lower than that of the malignant lesions. Among the malignant lesions there was not a significant difference. The data of the scatter plots have been fitted with straight lines with high linear correlation ( ranging from 0.93 to 0.99). It has to be noted that and in the scatter plots have a bell-shaped frequency distribution centered close to the barycenter for all the groups of lesions except for IsM, whose frequency distribution of slopes and intercepts shows a bimodal trend. Figure 2f shows that the slope related to the fit of each correspondent group monotonically decreases in passing from benign to malignant lesions. Evaluation of eumelanin and pheomelanin level was feasible from the LUTs in 824 CN, 365 DN, 31 IsM, 59 HGPM, and 161 VGPM. Since we do not a priori know the actual vascularity in each lesion, a representation of eumelanin and pheomelanin content in each lesion as a function of different blood fractions would be basically impracticable. Figure 3 shows a representative content of eumelanin and pheomelanin considering the mean value of and in the scatter plots reported in Fig. 2 and neglecting the lesions where evaluation of melanin content was not feasible. The reported bars indicate the SE of melanin concentration when the ratio in vascularity from normal skin and lesion is varied from one to 30. Fig. 3Content of eumelanin and pheomelanin in the different groups of lesions. Data have been extracted from two look-up tables (see Methods) considering the mean value of and in the scatter plots of Fig. 2. Lesions where the evaluation of melanin content was not feasible from the look-up tables were not included in the calculation. The bars indicate the SE of melanin concentration where the ratio in vascularity from normal skin and lesion is varied from 1 to 30. 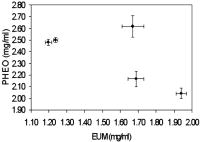 Neglecting IsM, there is a trend in the sequence related to an increase and decrease in eumelanin and pheomelanin content, respectively. Interestingly, the total content of the estimated melanin pigments remains basically unchanged in passing from DN to HGPM and to VGPM , whereas it is slightly greater in IsM . Figure 4 reports a comparison among the mean reflectances measured for the different groups of lesions, showing the existence of a great variability in the experimental data. The mean reflectances of CN and DN basically overlap each other, whereas malignant lesions show a lower reflectance. Modeled lesions of DN and VGPM with eumelanin and pheomelanin content of 1.20 and , and 1.94 and , respectively, are also shown, which basically mimic the in vivo mean reflectance of benign lesions and melanomas. The agreement is reasonably acceptable, considering the spread in the in vivo experimental data. In the region of , the discrepancy is within , whereas major differences, up to 20%, are between 600 and . Fig. 4Mean value of the diffuse reflectance of CN (◇), DN (△), IsM, (◼), HGPM (—), and VGPM (○). Bars (SD) have been reported for representative purposes only for DN and VGPM. The solid and dotted lines represent the simulated diffuse reflectance of DN and VGPM with pheomelanin and eumelanin content of 2.48 and , and 2.04 and , respectively.  4.DiscussionThe very high degree of correlation between slope and intercept of the straight line fit performed on the absorbance of each lesion (Fig. 2) suggests that the composition of the absorbers, mainly melanin pigments and blood, is on average the same for all the lesions within the correspondent group. This means that a change in the slope of the straight line is associated to a change in the relative concentration of blood and melanin pigments. That melanoma could be constituted by two different melanins was first reported one century ago.36 It is interesting to note that the trend of the slopes shown in Fig. 2f is surprisingly related to the transition , which represents a physical evidence that reflects the natural history of melanoma. The occurrence of a similar transition has been recently reported by evaluating the exponential dependence on wavelength of the melanin absorption spectrum , whose value was consistently greater for DN compared to melanomas, while values for IsM fell between melanomas and DN.22 Possible explanations for those differences were reported to be related either to an increased pheomelanin content in DN, which would yield higher values, or to eumelanin-rich composition, which would yield lower values. Our results (Fig. 3) show evidence that both explanations could be valid, since to a decrease in pheomelanin content there is a correspondent increase in eumelanin content in passing from benign to malignant lesions. The presence of tumor angiogenesis in the melanocytic lesions should not be neglected, especially because it plays a critical role in the development of melanoma. Counting microvessel density, as index of blood vascularity, vascular ratio between melanocytic lesions and normal skin has been reported in the range from 2, for common and dysplastic nevi, to 5 and up to 30 for different sets of melanomas.29, 31 Results reported in Fig. 3 were obtained by averaging melanin content at vascular ratios varied from 1 to 30 and, as a consequence, we are confident that the trend is not biased by blood content but it is reasonably related to a change in melanin composition. The finding that IsM is outside the trend is seemingly in contrast with the trend shown in Fig. 2f. However, the barycenter of the scatter plot of IsM lays in the valley of the bimodal distribution of and and therefore it is a figure not representative for the whole set of IsM lesions. The reason for the bimodal distribution remains obscure. Is the population of in situ melanomas composed by two different subpopulations? The understanding of the natural history of in situ melanoma and melanoma is very limited, and the natural history of some in situ lesions might be different from the invasive melanoma that has been questioned.6, 37 Evaluation of eumelanin and pheomelanin level in several lesions was not feasible from the LUTs in mainly two circumstances. In one case the lesions were clustered near the origin of the axes, for instance CN and DN; in the other case the lesions were randomly scattered, as in the case of VGPM. Analysis of the absorbance spectra of the clustered lesions showed that the curves were basically flat in the region, therefore resulting in very low values of after the fitting procedure. The reason for the flat spectra might be reasonably explained by the fact that those pigmented melanocytic lesions had a very low melanin content, e.g., , and a relatively great blood fraction. In the second case, the average absorbance of the 22 VGPM lesions, where calculation of melanin content was not feasible from the LUTs, was significantly greater than that of the remaining group. Melanin content and blood fraction in those lesions were estimated by the model used to generate the LUTs by enlarging the range of . Comparison between the modeled slopes and intercepts, and the experimental values of and , resulted in lesions with a vascularity ratio of 40 at least, a value much greater than that reported for different sets of melanomas.29, 31 Moreover, in the attempt to find out the existence of possible additional differences between the two groups, a comparison of Breslow’s thicknesses was performed. Interestingly, a significant difference was found, being and , the mean thickness of the 22 lesions and the remaining ones, respectively. It is not clear how an increase in thickness could lead to differences in absorbance and in pigment concentrations. A possible explanation is that the pigments in the subset of VGPM might not be regarded as a mere combination of pheomelanin and eumelanin, but that additional absorbers could be present. A possible source of additional absorbers that could justify the different absorbance might be related to the different vascular structure that thicker melanomas present with respect to the thinner ones. Abnormal blood flow has been detected in primary melanomas, indicating the occurrence of a biologically significant event.38 Finally, highly aggregated cells, such as lymphocytes, fibroblasts, and macrophages, are usually present in thick melanomas. The presence of such cells in the upper layer of skin could greatly affect scattering and/or absorption of light, which in turn affects the diffuse reflectance pattern of the tissue. In conclusion, our estimate of a great vascularity ratio in several lesions might not be merely due to the presence of a real great blood vascularity, since that figure might also include the contribution of additional absorbers. Our spectroscopic approach to evaluate in vivo the content of melanins in pigmented lesions is similar to that reported for assessing melanin content in skin.20 However, to our knowledge, an in vivo analysis of eumelanin and pheomelanin in melanocytic lesions, including melanoma, has never been re-ported. The only study we found in the literature on eumelanin and pheomelanin levels in ex vivo human melanoma tissues was that reported by Morishima and Fukuda,17 which showed that varying proportions of eumelanin and pheomelanin are present in human melanoma, even though the mean level of pheomelanin was not significantly different from that of eumelanin. Figure 4 shows a comparison between the mean reflectance measured for benign lesions and VGPM and two modeled lesions with eumelanin and pheomelanin contents corresponding to the mean value calculated for DN and VPGM (see Fig. 3). The agreement is reasonably acceptable, considering the spread in the in vivo experimental data, and that the reflectance model was not expressly developed for the geometry used. Further reasons for the not accurate agreement may be related to the fact that the natural variation of scattering properties of skin was not taken into account, and that pheomelanin and eumelanin absorption spectra are not so well characterized. The reliability on the evaluation of the amount of melanin pigments deserves the following comments. Pigment content is expressed in units of mg/ml, because in our lesion model, melanin pigments were added as though tissue was a liquid solvent. Although this model does not fully correspond to reality, nevertheless it allowed us to mimic the diffuse reflectance of pigmented lesions. Therefore, we are confident that a concentration of melanin in units of mg/ml might be equivalent to units of mg/g of tissue. Interestingly, our result reasonably agrees with the mean value of the total content of eumelanin and pheomelanin reported by Morishima and Fukuda.17 An interesting feature is that the total level of melanin pigments does not basically change from benign to malignant lesions. This finding would seem in contrast with results related to the absorbance spectra. In fact, absorbance of melanomas was greater than that of benign lesions and, as a consequence, there is expected to be an increased content in melanin pigments. A possible explanation is the same as already reported earlier, dealing with the scatter plot of VGPM and Breslow thickness. Furthermore, melanosomes in melanomas show a different fine structure and a range of abnormalities39 that might play a significant role in modifying the reflectance spectrum, acting as added scattering and absorbing centers to the normal pigmentation of benign nevi. Another factor that may be responsible for modifying melanin absorption is a variation in the eumelanin composition, e.g., in the ratio of the precursors DHI and DHICA of eumelanin. It is not clear why pheomelanin decreases and eumelanin increases in passing from benign to malignant lesions. Tyrosinase activity is thought to be a major regulatory step in melanogenesis, and it is widely accepted that increased tyrosinase activity is associated with an increased melanogenesis. However, in cultured human melanocytes as well as in human melanoma cell lines, no correlation between tyrosinase and melanin content was found.40, 41 The trend for a decrease and increase in pheomelanin and eumelanin content, respectively, in the sequence might be related to the melanin synthesis pathway within malignant melanocyte, reflecting a dysfunction in melanogenesis. At present, it remains unknown whether the effect is due to changes in the synthesis of melanins or to a degradation of pheomelanin, although it is widely accepted that biochemical properties of melanocyte are markedly altered in its malignant counterpart. The possibility is under investigation to determine the eumelanin and pheomelanin distribution in skin tissues for the study of melanogenesis and transformation of melanocytes from normal to malignant.42 In conclusion, this study shows the existence of an increasing trend in eumelanin content in passing from dysplastic nevi to invasive melanoma, which is counterbalanced by a decreasing trend in pheomelanin content. These results suggest the possibility that a decrease in pheomelanin and an increase in eumelanin levels might be correlated to the progression from dysplastic nevi to vertical growth phase melanomas, reflecting a possible hierarchy in the natural history of the early phases of the disease. The reasons for this finding remain unknown. Our results suggest that diffuse reflectance spectroscopy used to differentiate eumelanin and pheomelanin in in vivo lesions is a promising technique useful to develop better strategies for the characterization of the various melanocytic lesions, for instance, by monitoring melanin in a time-lapse study of a lesion that was supposed to be benign. AcknowledgmentsThis study was partially supported by the Lega Italiana per la Lotta contro i Tumori, Sezione di Milano, and by testamentary donation of Peraino Agata. ReferencesG. R. Mourant, I. J. Bigio, J. Boyer, R. L. Conn, T. M. Johnson, and T. Shimada,
“Spectroscopic diagnosis of bladder cancer with elastic light scattering,”
Lasers Surg. Med., 17 350
–357
(1995). https://doi.org/10.1002/lsm.1900170403 0196-8092 Google Scholar
G. C. Tang, A. Pradham, and R. R. Alfano,
“Spectroscopic differences between human cancer and normal lung and breast tissues,”
Lasers Surg. Med., 9 290
–295
(1989). https://doi.org/10.1002/lsm.1900090314 0196-8092 Google Scholar
S. Tomatis, C. Bartoli, A. Bono, N. Cascinelli, C. Clemente, C. Cupeta, and R. Marchesini,
“Spectrophotometric imaging of cutaneous pigmented lesions: discriminant analysis, optical properties and histological characteristic,”
Photochem. Photobiol., 42 32
–39
(1998). 0031-8655 Google Scholar
G. Zonios, L. T. Perelman, V. Backman, R. Manoharan, A. Nusrat, S. Shields, M. Fitzmaurice, J. Can Dam, and M. S. Feld,
“Diffuse reflectance spectroscopy of human adenomatous colon polyps in vivo,”
Appl. Opt., 38 6628
–6637
(1999). https://doi.org/10.1364/AO.38.006628 0003-6935 Google Scholar
M. Carrara, A. Bono, C. Bartoli, A. Colombo, M. Lualdi, D. Moglia, N. Santoro, E. Tolomio, S. Tomatis, G. Tragni, M. Santinami, and R. Marchesini,
“Multispectral imaging and artificial neural network: mimicking the management decision of the clinician facing pigmented skin lesions,”
Phys. Med. Biol., 52 2599
–2613
(2007). https://doi.org/10.1088/0031-9155/52/9/018 0031-9155 Google Scholar
R. Marchesini, A. Bono, S. Tomatis, C. Bartoli, A. Colombo, M. Lualdi, and M. Carrara,
“In vivo evaluation of melanoma thickness by multispectral imaging and artificial neural network. A retrospective study of 250 cases of cutaneous melanoma,”
Tumori, 93 170
–177
(2007). 0300-8916 Google Scholar
W. H. Clark Jr. and M. A. Tucker,
“Problems with lesions related to the development of malignant melanoma: common nevi, dysplastic nevi, malignant melanoma in situ, and radial growth phase malignant melanoma,”
Hum. Pathol., 29 8
–14
(1998). 0046-8177 Google Scholar
S. Jacques,
(2001) http://omlc.ogi.edu/spectra/melanin/index.html Google Scholar
T. Sarna and H. M. Swartz,
“The physical properties of melanins,”
The Pigmentary System, Oxford University Press, UK
(1988). Google Scholar
T. Sarna and R. C. Sealy,
“Photoinduced oxygen consumption in melanin systems. Action spectra and quantum yields for eumelanin and synthetic melanin,”
Photochem. Photobiol., 39 69
–74
(1984). 0031-8655 Google Scholar
R. P. Crippa, V. Cristofoletti, and N. Romeo,
“A band model for melanin deduced from optical absorption and photoconductivity experiments,”
Biochem. Biophys. Acta, 538 164
–170
(1978). Google Scholar
P. Meredith and T. Sarna,
“The physical and chemical properties of eumelanin,”
Pigment Cell Res., 19 572
–594
(2006). 0893-5785 Google Scholar
D. N. Hu,
“Methodology for evaluation of melanin content and production of pigment cells in vitro,”
Photochem. Photobiol., 83 1
–5
(2007). 0031-8655 Google Scholar
D. N. Hu, S. A. McCormick, S. J. Orlow, S. Rosemblat, and A. Lin,
“Regulation of melanogenesis by human uveal melanocytes in vitro,”
Exp. Eye Res., 64 397
–404
(1997). 0014-4835 Google Scholar
S. Ito and K. Jimbow,
“Quantitative analysis of eumelanin and pheomelanin in hair and melanomas,”
J. Invest. Dermatol., 80 268
–272
(1983). 0022-202X Google Scholar
S. Ito and K. Wakamatsu,
“Quantitative analysis of eumelanin and pheomelanin in humans, mice, and other animals: a comparative review,”
Pigment Cell Res., 16 523
–531
(2003). 0893-5785 Google Scholar
K. Jimbow, O. Ishida, S. Ito, Y. Hori, C. J. Witkop Jr., and R. A. King,
“Combined chemical and electron microscopic studies of pheomelanosomes in human red hair,”
J. Invest. Dermatol., 81 506
–511
(1983). 0022-202X Google Scholar
K. Jimbow, S. K. Lee, M. G. King, H. Hara, H. Chen, J. Dakour, and H. Marusyk,
“Melanin pigments and melanosomal proteins as differentiation markers unique to normal neoplastic melanocytes,”
J. Invest. Dermatol., 100 259S
–268S
(1993). 0022-202X Google Scholar
T. Morishima and E. Fukuda,
“Quantitative analysis of eumelanin and pheomelanin in human malignant-melanoma tissues,”
Arch. Dermatol. Res., 277 248
–250
(1985). 0340-3696 Google Scholar
T. G. Salopek, K. Yamada, S. Ito, and K. Jimbow,
“Dysplastic melanocytic nevi contain high level of pheomelanin: quantitative comparison of pheomelanin/eumelanin levels between normal skin, common nevi, and dysplastic nevi,”
Pigment Cell Res., 4 172
–179
(1991). 0893-5785 Google Scholar
K. Wakamatsu, D. N. Hu, S. A. McCormick, and S. Ito,
“Characterization of melanin in human iridal and choroidal melanocytes from eyes with various colored irides,”
Pigment Cell Melanoma Res., 21 97
–105
(2007). Google Scholar
N. Kollias and A. Baqer,
“Spectroscopic characteristics of human melanin vivo,”
J. Invest. Dermatol., 85 38
–42
(1985). https://doi.org/10.1111/1523-1747.ep12275011 0022-202X Google Scholar
N. Kollias and A. Baqer,
“On the assessment of melanin in human skin in vivo,”
Photochem. Photobiol., 43 49
–54
(1986). https://doi.org/10.1111/j.1751-1097.1986.tb05590.x 0031-8655 Google Scholar
G. Zonios, A. Dimou, I. Bassukas, D. Galaris, A. Tsolakidis, and E. Kaxiras,
“Melanin absorption spectroscopy: new method for noninvasive skin investigation and melanoma detection,”
J. Biomed. Opt., 13 014017
(2008). https://doi.org/10.1117/1.2844710 1083-3668 Google Scholar
G. Zonios and A. Dimou,
“Melanin optical properties provide evidence for chemical and structural disorder in vivo,”
Opt. Express, 16 8263
–8268
(2008). https://doi.org/10.1364/OE.16.008263 1094-4087 Google Scholar
P. A. Riley,
“Melanogenesis and melanoma,”
Pigment Cell Res., 16 548
–552
(2003). 0893-5785 Google Scholar
D. E. Elder and G. F. Murphy,
“Melanocytic tumors of the skin,”
Atlas of tumor pathology, 110
–119 Armed Forces Institute of Pathology, Washington DC
(1991). Google Scholar
S. Tomatis, M. Carrara, A. Bono, C. Bartoli, M. Lualdi, G. Tragni, A. Colombo, and R. Marchesini,
“Automated melanoma detection with a novel multispectral imaging system: results of a prospective study,”
Phys. Med. Biol., 30 1675
–1687
(2005). 0031-9155 Google Scholar
J. B. Dawson, D. J. Barker, D. J. Elllis, E. Grassam, J. A. Cotterill, G. W. Fisher, and J. W. Feather,
“A theoretical an experimental study of light absorption and scattering by in vivo skin,”
Phys. Med. Biol., 25 695
–709
(1980). https://doi.org/10.1088/0031-9155/25/4/008 0031-9155 Google Scholar
G. N. Stamatas, B. Z. Zmudzka, K. N. Kollias, and J. Z. Beer,
“Non-invasive measurements of skin pigmentation in situ,”
Pigment Cell Res., 17 618
–626
(2004). 0893-5785 Google Scholar
R. L. Barnhill, K. Fandrey, M. A. Levy, M. C. Mihm Jr., and B. Hyman,
“Angiogenesis and tumor progression of melanoma. Quantification of vascularity in melanocytic nevi and cutaneous malignant melanoma,”
Lab. Invest., 67 331
–337
(1992). 0023-6837 Google Scholar
J. Marcoval, A. Moreno, J. Graells, A. Vidal, J. M. Escribà, M. Garcia-Ramirez, and A. Fabra,
“Angiogenesis and malignant melanoma. Angiogenesis is related to the development of vertical (tumorigenic) growth phase,”
J. Clin. Pathol., 24 212
–218
(1997). 0021-9746 Google Scholar
J. G. Einspahr, T. L. Thomas, K. Saboda, B. J. Nickolof, J. Warneke, C. Curiel-Lewandrowski, J. Ranger-Moore, L. Duckett, J. Bangert, J. P. Fruehauf, and D. S. Alberts,
“Expression of vascular endothelial growth factor in early cutaneous melanocytic lesion progression,”
Cancer, 110 2519
–2527
(2007). 0008-543X Google Scholar
G. Zonios and A. Dimou,
“Modeling diffuse reflectance from semi-infinite turbid media: application to the study of skin optical properties,”
Opt. Express, 14 8661
–8674
(2006). https://doi.org/10.1364/OE.14.008661 1094-4087 Google Scholar
G. M. Hale and M. R. Querry,
“Optical constants of water in the wavelength region,”
Appl. Opt., 12 555
–563
(1973). https://doi.org/10.1007/BF00934777 0003-6935 Google Scholar
R. Marchesini, C. Clemente, E. Pignoli, and M. Brambilla,
“Optical properties of in vitro epidermis and their possible relationship with optical properties of in vivo skin,”
J. Photochem. Photobiol., B, 16 127
–140
(1992). https://doi.org/10.1016/1011-1344(92)80004-F 1011-1344 Google Scholar
M. Bakunin and G. Dragotti,
“Contributo alla conoscenza dei pigmenti melanici,”
Rendiconto dell’Accademia delle Scienze Fisiche e Matematiche, 10 222
–240 1904). Google Scholar
R. C. Burton,
“Malignant melanoma in the year 2000,”
Ca-Cancer J. Clin., 50 209
–213
(2000). 0007-9235 Google Scholar
A. Shivastava, L. E. Hughes, J. P. Woodcock, and E. J. Shedden,
“The significance of blood flow in cutaneous melanoma demonstrated by Doppler flowmetry,”
Eur. J. Surg. Oncol., 12 13
–18
(1986). 0748-7983 Google Scholar
H. Takahashi, T. Horikoshi, and K. Jimbow,
“Fine structural characterization of melanosomes in dysplastic nevi,”
Cancer, 56 111
–123
(1985). 0008-543X Google Scholar
J. Eberle, M. Wagner, and S. Macneil,
“Human melanoma cell lines show little relationship between expression of pigmentation genes and pigmentary behaviour in vitro,”
Pigment Cell Res., 11 134
–142
(1998). 0893-5785 Google Scholar
J. M. Naeyart, M. Eller, P. R. Gordon, H. Y. Park, and B. A. Gilchrest,
“Pigment content of cultured human melanocytes does not correlate with tyrosinase message level,”
Br. J. Dermatol., 125 297
–303
(1991). 0007-0963 Google Scholar
D. Fu, T. Y. T. E. Matthews, J. Grichnik, L. H. J. D. Simon, and W. S. Warren,
“Probing skin pigmentation changes with transient absorption imaging of eumelanin and pheomelanin,”
J. Biomed. Opt., 13 054036
(2008). https://doi.org/10.1117/1.2976424 1083-3668 Google Scholar
|


