
|
|
|
Recently, mouse models have been developed to mimic human neurological diseases. These models permit the controlled study of neurological diseases and are expected to yield clinically translatable insights into disease progression and treatment.1 Noninvasive techniques simplify the ability to perform longitudinal studies and are highly sought after to track brain function throughout disease advancement. Particularly promising are photoacoustic (PA) imaging techniques, which rely on the generation and detection of ultrasound (PA waves) via thermoelastic expansion of tissues that absorb short (nanosecond) laser pulses.2 Correspondingly, PA imaging techniques have overcome the effects of light scattering from the scalp and skull and produced high-resolution, noninvasive images of the in vivo mouse brain.3 Additionally, PA contrast is directly related to optical absorption. Optical-absorption contrast allows PA techniques to noninvasively assess blood oxygenation in single blood vessels by exploiting the oxygen-dependent absorption properties of hemoglobin,4, 5 which makes PA techniques attractive for monitoring brain activity through the endogenous “hemodynamic response”—changes in blood oxygenation, volume, and flow in local brain regions.5, 6, 7 We note that other techniques, such as micro position emission topography and micro single-photon-emission computed tomography, require exogenous contrasts to image brain function and exhibit inherently low spatial resolution (millimeter scale).8 Another noninvasive technique, functional magnetic resonance imaging (fMRI), which is capable of imaging brain function through the endogenous differences in magnetic properties of oxy- and deoxyhemoglobin,9 cannot distinguish between increased blood oxygenation or decreased blood volume.10, 11 PA tomography has been used to noninvasively image brain activity in the rat model,7 where the depth resolution was not optimized. In order to obtain high-resolution images of mouse brain function, we developed PA microscopy (PAM) that affords direct tissue measurements with notable depth and temporal resolution.12, 13 PAM has been used to obtain noninvasive, high-resolution images of the in vivo mouse brain3 but has yet to be used to image brain activity via the hemodynamic response. In this report, we track the real-time oxygenation dynamics of each of the selected multiple cortex vessels simultaneously in response to controlled perturbations of inhaled oxygen levels. These results demonstrate the ability of PAM to noninvasively assay the oxygen status of brain vessels and lay the groundwork for noninvasive imaging of brain activity via the hemodynamic response. Swiss Webster mice (Harlan Sprague Dawley Inc., ) were selected as the animal model in this study. As described in Ref. 3, all in vivo procedures were carried out in conformity with National Institutes of Health (NIH) guidelines and were in compliance with the Washington University Institutional Animal Care and Use Committee (IACUC). Details on components and operating principles of the PAM system can be found elsewhere.3, 12, 14 The maximum optical fluence at was . The system, fitted with a ultrasonic detector (bandwidth: 91%; NA: 0.64; focal length: ; depth of focus: ), exhibits lateral and axial resolutions of 70 and , respectively.3 Images were directly formed by converting the enveloped PA signals into a one-dimensional depth-resolved image (“A-line”) along the axis using the sound velocity in soft tissue . By raster scanning across the plane, volumetric images of the sample were acquired. Figure 1b shows a noninvasive, in vivo image of the mouse brain cortex vasculature for the region indicated in Fig. 1a at , a hemoglobin isosbestic point where optical absorption is independent of oxygenation status. This image was primarily used to locate major structures, such as the sagittal sinus and the coronal suture [Fig. 1b], to aid in identifying the vasculature associated with the somatosensory cortex (SC), a well-defined model used to study the hemodynamic response. After identifying several major SC vessels, a cross section of the vessels was obtained by line scanning [Fig. 1c, dotted line]. It is important to note that time-resolved PA imaging techniques can yield cross-sectional depth resolved images by line scanning, which was acquired in less than [Fig. 1c]. Fig. 1In vivo image of the mouse cortex vasculature. (a) Digital photograph of a prepared animal taken prior to imaging depicting the scanned region. (b) Noninvasive PA image of the mouse cortex vasculature. SS: sagittal sinus; CS: coronal suture. Unlabeled arrows indicate SC cortex feeding/draining vessels. Crossed arrow points in the rostral direction. Dotted white line indicates the area over which line scanning was performed. (c) B-scan image obtained from scanning along the white dotted line in (b). Colored arrows indicate the cross sections of the cortex vessels whose dynamic response to hypoxia and hyperoxia were tracked and plotted in Fig. 2. (Color online only.)  After identifying the vessels of interest, functional imaging was performed using two optical wavelengths: , a deoxyhemoglobin dominant wavelength, and , an oxygen-insensitive absorption wavelength of hemoglobin. A series of time-based images was obtained by acquiring sequential multiwavelength scans through continuous line scanning of the region indicated in Fig. 1b. The acquisition time for each multiwavelength scan was mainly limited by the time required to tune the dye laser wavelength. Throughout image acquisition, hyperoxic and hypoxic states were induced by alternating the inhaled oxygen levels delivered to the animal subject in the form of step changes between pure oxygen (100% to induce hyperoxia) and carbogen (5% , 5% , and 90% to induce hypoxia) and vice versa.4 The animal was exposed to each step change in oxygen concentration for , and a pulse oximeter was used to verify hyperoxic and hypoxic status. Experiments were performed with 100 and 5% baselines, respectively. Multiwavelength data were transformed into functional data through a ratiometric procedure commonly used to qualitatively track blood oxygenation in vivo.15 This procedure involved pixelwise normalization of the image acquired at (deoxyhemoglobin dominant) to the image acquired at , which served as an oxygen-insensitive reference. The end result was a time series of functional images. Although quantitative measurements were also possible,4, 9, 12 they require calibration for wavelength-dependent tissue optical attenuation,4, 5 which cannot be done minimally invasively in the brain. Dynamic oxygenation profiles for each vessel shown in Fig. 1c (colored arrows) were obtained by integrating over the full width at half-maximum of the image of each of the five vessels over the entire time series. Pure (100%) was used as a baseline, and the animal was subjected to three 5% steps with a return to baseline between successive hypoxic challenges. The resulting dynamic oxygenation profile for each of the five vessels is given in Fig. 2a, whereas the isosbestic measurement is shown in Fig. 2b. A close-up of the response curves corresponding to the forward and reverse response regions is shown in Fig. 2e to highlight the response transition phases. The initial step from hyperoxia (100% ) to hypoxia (5% ) occurred at time . After an additional of lag time, a significant (twofold greater than baseline fluctuations) increase in the ratiometric PA signal from each vessel was observed. The forward response time, characterized by the time required for the hypoxic response to rise from 10 to 90% of maximum, was . We note that no significant variations in forward response time were observed for each of the five vessels studied. Interestingly, the maximum values of the hypoxic response values significantly varied among the cortex vessels studied, but no significant correlation between maximum response and vessel diameter was observed. At , the hypoxic challenge was ended via a step exposure to 100% , which decreased the levels of deoxyhemoglobin in the cortex vessels, causing a decrease in the ratiometric PA signal. The reverse response time for this event, defined as the time required for the hypoxic response to decrease from 90 to 10% of the maximum, was . Our current system was not able to resolve any lag time associated with the transition from hypoxia to hyperoxia status. The repeated hypoxic challenges produced similar results in all cases. Fig. 2Dynamic vessel response profiles. Profiles acquired through a hypoxic challenge and shown in percent change of (a) ratiometric PA signals and (b) isosbestic PA signals. Each colored trace corresponds to the response profile from the respective cortex vessel indicated with the like-colored arrow in Fig. 1c. Dynamic vessel response profile acquired through a hyperoxic challenge and shown in percent change of (c) ratiometric PA signals and (d) isosbestic PA signals. (e) Close-up of parts of the dynamic vessel responses shown in a. (Color online only.) 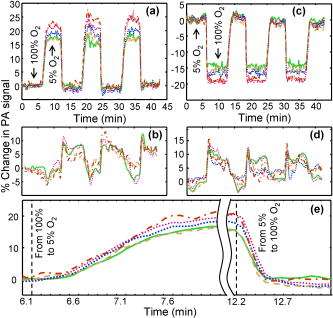 To our surprise, Fig. 2b appears to show that switching to the hyperoxic state elicits an increase in the PA signal, contrary to an expected decrease in blood flow during hyperoxia.16 This contradiction can be possibly explained as follows. The measured PA signal is proportional to both the light fluence on the vessel surface and the optical absorption coefficient in blood while weakly depending only on the vessel diameter.5 Here, we imaged only relatively large-diameter vessels. However, the optical attenuation in the skin, dura matter, and brain cortex strongly depends on the intervening volume of blood in much smaller vessels, where vasoconstriction is much higher. Correspondingly, a change in local fluence can overshadow a change of diameter or hemoglobin concentration in the imaged vessel. The same effect can adversely affect the dual-wavelength measurement of oxygenation. However, to change the experimental result qualitatively, optical absorption in blood at would have to be higher than that at , which corresponds to a physiologically unreasonable blood oxygenation level of less than 40% in the hyperoxic state. A similar experiment was performed using 5% as a baseline [Fig. 2c]. The forward response time was determined to be , and the reverse response time was , both of which agree well with the above experimental results. Furthermore, a similar lag time was observed between the transition from hyperoxia and hypoxia. Again, transitioning from 5 to 100% inhalation increased the PA signal at [Fig. 2d]. The results of the present work demonstrate the ability of PAM to track the oxygenation dynamics of each of multiple cortex vessels simultaneously in vivo. Furthermore, these data were also used to estimate the baseline standard deviation , which can be used to predict the detection limit of the current system. The limit of detection (LOD) is empirically defined as three times the standard deviation of the baseline signal . Thus, . We also note that a high degree of correlation was observed between the dynamic oxygenation profiles and the oxygen step-change profiles [Figs. 2a and 2c]. In summary, we have successfully demonstrated the ability of PAM to noninvasively track the oxygenation dynamics of multiple cortex vessels in vivo using hyperoxic and hypoxic challenges. The physiological responses observed under the hyperoxic and hypoxic challenges used in this work show the potential for PAM to be used to noninvasively monitor mouse brain activity via the hemodynamic response. The realization of this potential could provide a simple means to monitor the longitudinal effects of humanlike neurological disease on brain function via transgenic mouse models. ReferencesM. Hafezparast, A. Ahmad-Annuar, N. W. Wood, S. J. Tabrizi, and E. M. C. Fisher,
“Mouse models for neurological disease,”
Lancet Neurol., 1
(4), 215
–224
(2002). 1474-4422 Google Scholar
M. H. Xu and L. H. V. Wang,
“Photoacoustic imaging in biomedicine,”
Rev. Sci. Instrum., 77
(4), 041101
–041122
(2006). 0034-6748 Google Scholar
E. W. Stein, K. Maslov, and L. V. Wang,
“Noninvasive, in vivo imaging of the mouse brain using photoacoustic microscopy,”
J. Appl. Phys.,
(0021-8979) Google Scholar
H. F. Zhang, K. Maslov, M. Sivaramakrishnan, G. Stoica, and L. H. V. Wang,
“Imaging of hemoglobin oxygen saturation variations in single vessels in vivo using photoacoustic microscopy,”
Appl. Phys. Lett., 90
(5), 053901
–053903
(2007). 0003-6951 Google Scholar
M. Sivaramakrishnan, K. Maslov, H. F. Zhang, G. Stoica, and L. V. Wang,
“Limitations of quantitative photoacoustic measurements of blood oxygenation in small vessels,”
Phys. Med. Biol., 52 1349
–1361
(2007). https://doi.org/10.1088/0031-9155/52/5/010 0031-9155 Google Scholar
A. Grinvald, E. Lieke, R. D. Frostig, C. D. Gilbert, and T. N. Wiesel,
“Functional architecture of cortex revealed by optical imaging of intrinsic signals,”
Nature, 324
(6095), 361
–364
(1986). https://doi.org/10.1038/324361a0 0028-0836 Google Scholar
X. D. Wang, Y. J. Pang, G. Ku, X. Y. Xie, G. Stoica, and L. H. V. Wang,
“Noninvasive laser-induced photoacoustic tomography for structural and functional in vivo imaging of the brain,”
Nat. Biotechnol., 21
(7), 803
–806
(2003). https://doi.org/10.1038/nbt839 1087-0156 Google Scholar
R. S. Balaban and V. A. Hampshire,
“Challenges in small animal noninvasive imaging,”
ILAR J., 42
(3), 248
–262
(2001). 1084-2020 Google Scholar
G. Nair and T. Q. Duong,
“Echo-planar BOLD fMRI of mice on a narrow-bore magnet,”
Magn. Reson. Med., 52
(2), 430
–434
(2004). 0740-3194 Google Scholar
E. T. Ahrens and D. J. Dubowitz,
“Peripheral somatosensory fMRI in mouse at ,”
NMR Biomed., 14
(5), 318
–324
(2001). 0952-3480 Google Scholar
E. M. C. Hillman,
“Optical brain imaging in vivo: techniques, and applications from animal to man,”
J. Biomed. Opt., 12
(5), 051402
–051428
(2007). 1083-3668 Google Scholar
H. F. Zhang, K. Maslov, G. Stoica, and L. V. Wang,
“Functional photoacoustic microscopy for high-resolution, and noninvasive in vivo imaging,”
Nat. Biotechnol., 24
(7), 848
–851
(2006). https://doi.org/10.1038/nbt1220 1087-0156 Google Scholar
K. Maslov, G. Stoica and L. V. H. Wang,
“In vivo dark-field reflection-mode photoacoustic microscopy,”
Opt. Lett., 30
(6), 625
–627
(2005). https://doi.org/10.1364/OL.30.000625 0146-9592 Google Scholar
H. F. Zhang, K. Maslov, and L. V. Wang,
“In vivo imaging of subcutaneous structures using functional photoacoustic microscopy,”
Nat. Protocols, 2
(4), 797
–804
(2007). Google Scholar
V. Tuchin, Tissue Optics: Light Scattering Methods, and Instuments for Medical Diagnosis,
(2007) Google Scholar
K. Parthasarathi and H. H. Lipowsky,
“Capillary recruitment in response to tissue hypoxia and its dependence on red blood cell deformability,”
Am. J. Physiol., 277 H2145
–2157
(1999). 0002-9513 Google Scholar
|


