
|
|
1.IntroductionAdvances in molecular-specific optical contrast agents have recently shown promise for the detection of cancer and its precursors. Targeting agents that have been successfully used for optical detection of cancer biomarkers in preclinical models include antibodies,1, 2, 3, 4, 5, 6 growth factors,7, 8, 9, 10, 11 peptide analogs of extracellular ligands,12, 13, 14, 15 and enzymatically activatable polymers.16, 17, 18, 19, 20 The coupling of optical tags to these targeting agents allows molecular events to be monitored noninvasively in vivo.21 These molecular-specific optical contrast agents have the potential to provide dynamic, real-time information without the need for biopsy and associated patient discomfort. The use of optical contrast agents as topical probes for the screening of epithelial precancer has been hindered by the difficulty of delivering macromolecules through mucosal tissue. The molecular changes preceding cancer generally begin in the basal layers of epithelium,22 thus, early detection strategies require contrast agents be delivered at least several hun-dred microns deep. Studies of small molecule optical probes with tissue-permeant properties, such as fluorescent sugar derivatives23, 24, 25 and acriflavine,26, 27, 28 have highlighted the promise of using optical imaging to distinguish molecular changes in small populations of cells. The penetration of larger molecules through mucosal tissue, however, is substantially reduced for molecular weights above .29 Chemical modification strategies, including increasing lipophilicity,30, 31 conjugation with polymers,32, 33 and encapsulation in liposomes,34, 35, 36 have improved the penetration of molecules up to in size. Topical permeation enhancers, substances that temporarily reduce the impermeability of tissues, have been investigated for the delivery of larger molecules. Dimethyl sulfoxide (DMSO), for example, enhances the transdermal permeation of a variety of drugs by modifying the keratin structure and lipid composition of skin.37 Combinations of topical permeation enhancers have been shown to facilitate the transdermal penetration of proteins as large as .38, 39 Permeation enhancers shown to be effective in skin, however, have met little success in mucosal tissue.40 Studies utilizing various surfactant, lipid, and bile salt formulations have demonstrated enhanced mucosal penetration of only small molecules such as insulin and calcitonin .41 In our companion paper (Part 1), it was demonstrated that Triton-X100 can be used to permeabilize live cells in a sufficiently reproducible manner to facilitate intracellular labeling of cancer biomarkers. We hypothesized that the permeabilization properties of Triton-X100 would render it useful for the delivery of cell- and tissue-impermeant optical contrasts agents though mucosal tissue. To evaluate Triton-X100 as a topical permeation enhancer for contrast agent delivery, several key criteria were identified, including (i) uniform delivery of molecules up to in size, (ii) a controlled depth of permeation, and (iii) the capability to wash out unbound probes for high optical contrast. Because of the need for controlled local delivery rather than systemic delivery, new methodologies for the assessment of contrast agent delivery were developed. In this paper, we describe the use of Triton-X100 to deliver targeted and untargeted optical contrast agents in three different tissues. To translate Triton-X100 for tissue use, biopsies of reproducible dimensions are topically treated with a fixed volume of 0.5–2.5% Triton-X100. The concentration and duration of treatment, adjusted relative to the epithelial thickness and cell density, is selected to expose the cells to a final dose of /cell or less. Using this approach, transverse sections of bladder and oral mucosa specimens are probed with optically active contrast agents following Triton-X100 treatment to determine the extent of tissue permeation. Using confocal microscopy, the depth and rate of macromolecule penetration are evaluated as a function of optical probe size to determine under what conditions Triton-X100 treatment meets the design criteria. The delivery of molecular-specific optical contrast agents is tested in xenograft tumor specimens cotreated with Triton-X100 and compared to tissues treated with DMSO or saline solution. We demonstrate that Triton-X100 can facilitate simultaneous labeling of clinically relevant extracellular and intracellular biomarkers in a controlled, uniform manner. 2.Materials and Methods2.1.Cell LinesThe targeting of EGFR- and CyclinD1-specific optical contrast agents was evaluated using 1483 cells and xenograft tumors. This EGFR-positive cell line, derived from a patient with head and neck squamous cell carcinoma,42 was obtained from Dr. Reuben Lotan at the M.D. Anderson Cancer Center (Houston, Texas). The 1483 cells were cultured in Dulbecco’s Modified Eagle Medium: Nutrient Mix F-12® medium supplemented with L-glutamine (Invitrogen, Carlsbad, California) and 10% fetal bovine serum (Hyclone, Logan, Utah). 2.2.Tissue ModelsThree different tissue models were evaluated for permeability in the presence and absence of topical permeation enhancers. Porcine oral mucosa was selected as a model of stratified squamous epithelium. Heads of American Yorkshire pigs, aged , were obtained from a local slaughterhouse at the time of sacrifice. The buccal mucosa of the oral cavity and of underlying tissue was separated from the sur-rounding muscle layers via dissection. Guinea pig bladder mucosa was selected as a model of transitional epithelium. Whole bladders were excised from old female Hartley guinea pigs (Charles River Laboratories, Wilmington, Massachusetts) directly following animal sacrifice. Xenograft tumors, generated subcutaneously in mice, were selected as a model of squamous cell carcinoma for the study of cancer biomarker targeting. Briefly, 1483 cells ( viable cells in PBS) were implanted subcutaneously in the left and right posterior mammary fat pads of -old female Nu/Nu mice (Charles River Laboratories). When tumors reached diam, the animals were anaesthetized and sacrificed via cervical dislocation. All animals were cared for in accordance with institutional guidelines. The protocols were reviewed and approved by the Institutional Animal Care and Use Committee at Rice University. 2.3.Permeation of Fresh TissuesTo reproducibly permeate tissues for contrast-agent delivery, tissue biopsies of uniform surface area were topically treated with permeation enhancers. A -diam dermal punch (Miltex Inc., York, Pennsylvania) was used to produce cylindrical samples of oral and bladder mucosa. Subcutaneously generated tumors, grown as cylinders to the appropriate diameter, were cut in half to expose the tumor surface. The tissue cylinders were embedded vertically into 3% (vol/vol) ultrapure agarose (Invitrogen) to prevent the influx of permeation enhancers and contrast agents at the tissue margins. The Darcy permeability of 3% agarose has been reported as ,43 and the diffusivity of macromolecules through 3% agarose is limited.44 The apical surface of the epithelium was left free of agarose to facilitate topical labeling. In the case of the bladder tissue, the underlying muscle layers were sufficiently thick to allow the biopsies to be positioned horizontally in the agarose without stretching or bending. Two topical permeation enhancers, Triton-X100 and DMSO (Sigma-Aldrich, St. Louis, Missouri) diluted in phosphate buffered saline [(PBS), Sigma-Aldrich], were evaluated for their ability to permeate fresh tissue. PBS alone was used as a negative control. One milliliter of permeation-enhancing solution was topically applied to the apical surface each tissue biopsy for at . 2.4.Permeabilization Detection Using MacromoleculesTo determine whether Triton-X100–treated tissues are selectively permeable to macromolecules of a specific size, bladder biopsies were probed with fluorescent macromolecules of three sizes. The apical surface of the epithelium was topically treated for with 0.5% Triton-X100 (to yield a treatment dose of /cell, assuming full-thickness permeation) or PBS, washed once in PBS, and covered with a 1:1:1 mixture of rhodamine-dextran ( , Invitrogen), fluorescein-dextran ( , Invitrogen), and AlexaFluor647 IgG ( , Invitrogen), each diluted to a concentration of in PBS. Tissues were immersed with this solution for at and then imaged using fluorescence confocal microscopy at three different excitation wavelengths (described below). Images were collected in steps from the surface into the tissue. Following imaging, the tissues werewashed three times in cold PBS ( total) and reimaged to assess the removal of unbound macromolecules. A total of 10 bladders were evaluated in independent experiments. 2.5.Tracking the Time Course of Tissue PermeationTo monitor Triton-mediated permeation of bladder epithelium as a function of time, fresh biopsies were treated for different time intervals. The apical surface of the agarose-embedded punch biopsies were topically treated with 0.5% Triton-X100 for 0, 5, 10, 15, 30, or . Following the permeation treatment, the tissues were washed once in cold PBS and probed with the 1:1:1 mixture of fluorescent macromolecules described above. Confocal microscopy images were collected below the tissue surface to allow for optical sectioning of both the epithelium and underlying tissues. Each time point was evaluated in five independent experiments. 2.6.Determination of the Depth of PenetrationThe depth of Triton-mediated macromolecule penetration as a function of time and concentration was evaluated in cross sections of fresh oral mucosa. The apical surface of agarose-embedded punch biopsies were topically treated for with Triton-X100 concentrations ranging from 0 to 2.5%. These concentrations were selected to treat cells with up to /cell of Triton-X100. The permeabilized tissues were cross-sectioned using a Krumdieck tissue slicer (Alabama Research & Development, Munford, Alabama) and immersed for in the 1:1:1 mixture of fluorescent macromolecules. Confocal fluorescence images of the transverse sections were collected below the cut surface to avoid confounding effects due to damage at cut surface. The penetration depth for each size of macromolecule was evaluated by measuring the distance between the apical surface of the tissue and the leading edge of the fluorescent macromolecules using ImageJ v1.34 software (http://rsbweb.nih.gov/ij). Measurements were collected at intervals across four representative images in four independent experiments (16 images total per treatment condition). The rate of tissue permeation as a function of Triton-X100 concentration was determined from a linear least-squares fit to the data. 2.7.Comparison of Macromolecule Penetration in Normal and Cancer TissueTo determine whether the depth and rate of permeation varies between tissues, macromolecule penetration was assessed in fresh normal oral mucosa and squamous cell carcinoma. The apical surface of agarose-embedded oral biopsies and 1483 tumors were treated for with only 1% Triton-X100, 10% DMSO, or PBS. Following the permeation treatment, the tissues were cross-sectioned with a Krumdieck tissue slicer and probed with the 1:1:1 mixture of fluorescent macromolecules for . Confocal fluorescence images of the transverse sections were collected below the cut surface. The depth of penetration from the apical surface was assessed for each macromolecule at intervals across four representative images from four independent experiments (16 images total per treatment condition). The rate of tissue permeation was determined from a linear least-squares fit to the data. 2.8.Estimation of the Normalized Triton-X100 Concentration in TissueThe average dose of Triton-X100 per cell was determined as a function of treatment time and depth. Briefly, the average permeation depth was measured at different time intervals for tissues of known surface area treated with a fixed volume and concentration of Triton-X100. An average cell was approximated as a sphere in diameter based on confocal microscopy images. The measured volume of treated tissue was divided by the average cell volume to yield the number of treated cells. The concentration of Triton-X100 (in moles per milliliter) was divided by the number of treated cells to determine the normalized Triton-X100 concentration. 2.9.Cell Viability Assessment in Tissue PhantomsCell viability following Triton-X100 treatment was assessed in three-dimensional tissue phantoms. The optical properties of these phantoms have been validated in Ref. 45. Briefly, subconfluent monolayers of 1483 cells were treated with 0.05% trypsin-EDTA (Invitrogen), pelleted, and washed once with cold PBS. The cells were counted under light microscopy using a hemocytometer, pelleted, in resuspended in a collagen type I gel ( , Roche Diagnostics Corp, Indianapolis, Indiana) at concentration of . Then, aliquots were cured for at and then placed in prewarmed complete media, and later, the tissue phantoms were treated with of 0–5% Triton-X100 for at . The Triton-X100 concentrations were selected to yield a normalized concentration of /cell and above to permeabilize all cells. After treatment, the phantoms were washed and placed in fresh prewarmed media. Cell viability was assessed following Triton-X100 treatment. Prewarmed 3-(4,5-dimethylthiazol-2-yl)-2,5-diphenyl tetrazolium bromide (MTT, Sigma-Aldrich) was added to the supernatant for at a concentration of . In viable cells, reduction of the MTT reagent led to the intracellular deposition of a blue formazan product visible to the eye. The tissue phantoms were imaged whole and in cross section using light microscopy. 2.J.Synthesis and Validation of Molecular-Specific Contrast AgentsMouse antihuman antibodies targeted to epidermal growth factor receptor [(EGFR), clone 108; custom synthesized by the Baylor College of Medicine, Houston, Texas] and Cyclin D1 (clone 72-13G; Santa Cruz Biotechnology Inc., Santa Cruz, California) were reacted with AlexaFluor® 647 and AlexaFluor® 488 carboxylic acid succinimidyl esters using commercially available labeling kits (Invitrogen). The purified conjugates were suspended in PBS at a concentration of 1.0 and , respectively. Dye-labeled isotype controls were synthesized at the same concentrations. Prior to tissue labeling, the bioactivity and specificity of the conjugates wereconfirmed in live and fixed 1483 cells as described in Ref. 46, both in the presence and absence of Triton-X100. 2.K.Comparison of AntiEGFR Delivery Strategies in TumorsTo assess the ability of permeation enhancers to deliver molecular-specific optical contrast agents through tissue, subcutaneously generated 1483 xenograft tumors were for labeled for EGFR in the presence of 1% Triton-X100, 10% DMSO, or PBS. AntiEGFR-647 (1:50) was diluted in permeation enhancers and topically applied to the cut surface of agarose-embedded tumors for at . The labeled tissues were washed three times in cold PBS, sliced perpendicular to the surface using a Krumdieck tissue slicer, and counterstained for with 0.05% acriflavine-HCL (Sigma-Aldrich), a cell permeant nucleic acid dye. The depth and localization of EGFR labeling was assessed from confocal fluorescence images acquired below the cross section’s surface. A total of 10 tumors (5 mice) were evaluated. 2.L.Demonstration of Multitarget Labeling in TumorsTo demonstrate the feasibility of simultaneously targeting multiple cancer biomarkers in different cell compartments, 1483 xenograft tumors were simultaneously labeled with three tissue and/or cell impermeant probes. AntiEGFR-647 (1:50), antiCyclinD1-488 (1:10), and propidium iodide ( , Sigma Aldrich) were used to label cell membrane, cytoplasmic, and nuclear targets respectively. The contrast agents and isotype controls were diluted in 1% Triton-X100 and topically applied for . The labeled tissues were washed three times in cold PBS and sliced perpendicular to the surface using a Krumdieck tissue slicer. The localization of labeling was assessed from confocal fluorescence images acquired below the cross section’s surface. A total of 10 tumors (5 mice) were evaluated. 2.M.Confocal Image Acquisition and AnalysisAll images were obtained using a Carl Zeiss LSM 510 confocal microscope (Thornwood, New York) equipped with , , and lasers. Images were collected using photomultiplier tube detectors and Zeiss LSM 5 image examiner software. Samples were sequentially excited with each laser line, with power settings of 50, 100, and 100%, respectively. Fluorescence emission was collected using 500–530, 565–615, and bandpass filters, respectively. Tissue reflectance at was collected using a dichroic beam splitter. Images were acquired at using a 63X oil, 20X, or 10X objectives with a pinhole of 2.56 Airy units. For the nonspecific macromolecule permeation studies, the gain was held constant just below saturation level of the extracellular solution. In the molecular-specific targeting studies, the gain was held constant at 440 for antiEGFR-647 ( excitation), 650 for antiCyclin D1-488 ( excitation), 400 for propidium iodide ( excitation), and 535 for acriflavine-HCL ( excitation). 3.Results3.1.Permeabilization of Fresh Guinea Pig BladderThe ability of Triton-X100 to permeabilize guinea pig bladder mucosa was assessed using untargeted fluorescent macromolecules of three different sizes. Figure 1 shows representative confocal images of tissue biopsies topically treated for with 0.5% Triton-X100 or PBS, and then probed with a 1:1:1 mixture rhodamine-dextran, fluorescein-dextran, and Alexa647-IgG. The tissue reflectance images are shown on the left and the corresponding fluorescence images are shown to the right. The yellow/white lines indicate the basal boundaries of the epithelium. Because of the three-dimensional folding of the deflated bladder, it was possible to image the transitional epithelium in cross section using confocal microscopy at a depth of . In the reflectance images, the epithelium was distinguished from the underlying, more highly scattering tissues by its darker appearance. Triton-X100 treatment facilitated trans-epithelial penetration of all three sizes of molecules. The 3 and molecules successfully penetrated both the cytoplasm and nucleus of epithelial cells, whereas the molecules only penetrated the cytoplasm of epithelial cells. With several brief washes, a significant portion of the macromolecules were removed. In the PBS-treated controls, the macromolecule penetration was limited to one to two layers of superficial cells. Fig. 1Macromolecule penetration of guinea pig bladder epithelium following permeation treatment. Tissues were topically treated for with 0.5% Triton-X100 or PBS and then probed with a 1:1:1 mixture of rhodamine-dextran, fluorescein-dextran, and Alexa647-IgG. The yellow/white lines indicate the basal surface of the epithelium. In reflectance images, the epithelium was distinguished from the underlying tissues by its darker appearance. Following treatment with Triton-X100, trans-epithelial penetration was observed for all three sizes of molecules. After washing with PBS, the fluorescence intensity of the labeled tissue was significantly reduced. In PBS-treated controls, macromolecule penetration was limited to a few cells in the superficial layers. The scale bar represents .  The time course of tissue permeation with Triton-X100 treatment was tracked using confocal microscopy. Figure 2 shows representative images of biopsies treated with 0.5% Triton-X100 for 5, 10, and and then probed with fluorescent macromolecules of three sizes. At , the leading edge of permeabilized epithelium featured irregular borders. At , full-thickness epithelial permeation was observed in some epithelial regions. Individual, nonpermeabilized cells were easily distinguished by their dark appearance. At , trans-epithelial penetration was observed for all three sizes of molecules. With time, the overall fluorescence intensity of the epithelium increased to approach that of the exogenous solution; however, the nuclei of cells probed with molecules remained dark. Fluorescence in the underlying tissues was observed as early as and increased steadily with time. Fig. 2The time course of tissue permeation following treatment with 0.5% Triton-X100. Fresh guinea pig bladder biopsies were topically treated with 0.5% Triton-X100 for and then probed fluorescent molecules of three sizes. Representative confocal images, acquired below the tissue surface, are shown for the 5-, 10-, and time points. The yellow/white lines indicate the apical and basal surfaces of the epithelium. The depth and uniformity of permeation increased with treatment time. Differences were observed between the cell and tissue penetration of different size probe molecules. Fluorescence signal in stroma was observed as early as following Triton-X100 treatment. The scale bar represents .  3.2.Depth of Mucosal PermeationThe depth of Triton-mediated permeation was assessed in a model of porcine oral mucosa ranging in thickness from . Epithelial punch biopsies were topically treated with different concentrations of Triton-X100 (ranging from 0 to 2.5%) for different time intervals (ranging from ), sliced in cross section, and probed with fluorescent macromolecules. Representative confocal fluorescent images of macromolecule permeation as a function of time can be found in Fig 3 . Figure 4 demonstrates the relationship of treatment time and Triton-X100 concentration to the depth of tissue permeation. Triton-X100 treatment was found to produce very uniform, reproducible tissue permeation with well-defined borders parallel to the treatment surface. When the leading edge of macromolecule labeling was assessed at regular time intervals, the depth of penetration was found to increase at a steady, linear rate [Fig 4a]. The smaller probe molecules consistently showed deeper penetration than the molecules. Macromolecule penetration to a depth of was achieved in for molecules of or less, and in for molecules of . Fig. 3Permeation of the porcine oral mucosa following treatment with 1% Triton-X100. Triton-X100 was topically applied to the top surface of fresh tissue biopsies for , then the tissue was sliced, probed with fluorescent molecules of three sizes, and imaged in cross section. Representative confocal images, acquired below the cut surface, are shown for the 10-, 30-, and time points. Tissue permeation was characterized by a well-defined border that progressed deeper with time. The scale bar represents .  Fig. 4Permeation of normal oral mucosa as a function of time and Triton-X100 concentration. Normal porcine oral mucosa was topically treated with different concentrations of Triton-X100 for regular time intervals, sliced, and probed with fluorescent macromolecules of three sizes: (◼), (○), and (▲). The depth and rate of macromolecule penetration was determined from confocal fluorescence images of transverse tissue sections. (a) The relationship between the depth of permeation and duration of treatment with 1% Triton-X100. A steady, linear increase in permeation depth is observed with time. (b) Rate of tissue permeation as a function of Triton-X100 concentration. Increasing the Triton-X100 concentration increased the depth of tissue permeabilization; however, the extent of macromolecule penetration was limited by size.  Using a linear least-squares fit, the rate of tissue permeation was evaluated for a range of Triton-X100 concentrations [Fig. 4b]. Increasing the Triton-X100 concentration was found to increase the rate of tissue permeation; however, at concentrations of Triton-X100, little improvement in the rate of permeation was observed. Size-dependent differences in macromolecule penetration were observed for all concentrations of Triton-X100, although there was generally no significant difference between the penetration depth of 3- and macromolecules. Longer probe times were evaluated to confirm that the differences in penetration depth were not due to inadequate labeling time (data not shown). Furthermore, samples in which the keratin layer was mechanically removed showed no differences in the rate of permeation when compared to intact specimens (data not shown). 3.3.Comparison of Macromolecule Penetration in Normal and Cancer TissueTo determine whether the depth and rate of topical permeation varies between normal and abnormal tissue, macromolecule penetration following of topical permeation was evaluated in normal oral mucosa and tumor models. Figure 5 compares the depth and rate of macromolecule penetration in two tissue models using three different labeling solutions. The maximal penetration depth following of treatment with 1% Triton-X100 was found to be greater in squamous carcinoma tissue than normal epithelium [Fig. 5a]. Little permeation, deep, was observed in DMSO- and PBS-treated tissues. When the rate of macromolecule penetration following Triton-X100 treatment of was evaluated as a function of size, all sizes of macromolecules consistently penetrated more rapidly in carcinoma tissue than normal epithelium [Fig. 5b]. As previously observed, the rate of macromolecule permeation was highly reproducible and linear at all time points evaluated. The largest difference in penetration rate was observed for the molecules, although this size of molecule consistently penetrated more slowly than smaller molecules. Fig. 5Comparison of macromolecule penetration in normal oral mucosa and squamous cell carcinoma. Tissues were treated with 1% Triton-X100, 10% DMSO, or PBS, sliced, and then probed with fluorescent macromolecules of three sizes. The depth and rate of macromolecule penetration was determined from confocal fluorescence images of transverse tissue sections. (a) The maximal penetration depth following a treatment with permeation enhancers, measured using rhodamine-dextran. The maximal depth with Triton-X100 treatment was found to be greater for cancer tissue than normal epithelium. Little permeation was observed with DMSO- and PBS-treated controls. (b) The rate of macromolecule penetration by size with 1% Triton-X100 treatment. The rate of penetration was consistently more rapid in carcinoma tissue for all sizes of macromolecules evaluated. 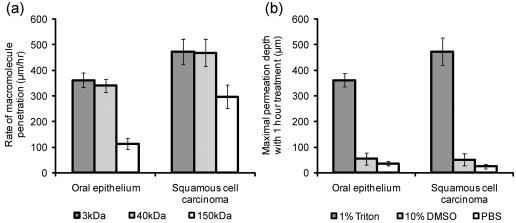 3.4.Relation of Triton-X100 Concentration to the Number of Treated CellsThe average dose of Triton-X100 per cell was estimated as function of treatment time and depth. Table 1 provides the normalized Triton-X100 concentration in terms of picomoles per cell. The calculations were based on an average cell volume, the known tissue surface area, and the measured permeation depth. In the case where only one cell layer was permeabilized ( deep), the Triton-X100 concentration per cell was on the order of /cell. As the Triton-X100 permeated deeper, the average concentration per cell was reduced. Full thickness permeation of the bladder epithelium with a 0.5% solution yielded an average of Triton-X100 per cell. A treatment of 1.0% Triton-X100 in thicker tissues further lowered the normalized concentration to 0.28–0.57 for oral mucosa tissue and 0.21–0.42 for squamous cell carcinoma tissue. Table 1Triton-X100 concentration per cell as a function of treatment time and depth.
3.5.Viability Assessment of Tissue PhantomsTissue phantoms were assayed for cell viability following treatment with different concentrations of Triton-X100. Figure 6 shows representative images of phantoms, containing five million cells each, treated with 0–5% Triton-X100 for and then coincubated with MTT reagent. The normalized Triton-X100 concentration per cell was determined from the number of cells incorporated into each phantom. Phantoms treated with 1% Triton-X100 or less ( /cell) demonstrated an intense blue color indicative of MTT reduction by viable cells. When imaged in cross section, these phantoms showed intense staining throughout. In contrast, phantoms treated with concentrations above 1% ( /cell) demonstrated an overall loss in color intensity as well as a lack of staining at the phantom periphery, suggestive of cell death at these higher Triton-X100 concentrations. Fig. 6Tissue phantoms assayed for viability after treatment with different concentrations of Triton-X100. Phantoms containing cells each were treated with Triton-X100 for , returned to media for , and then coincubated with a MTT reagent for . Blue color deposition is indicative of viable cells. Intense staining was observed in phantoms treated with 1% Triton-X100 or less ( /cell). Phantoms treated with Triton-X100 concentrations above 1% ( /cell) demonstrated an overall loss in color intensity and staining at the periphery.  3.6.EGFR Targeting in Cancer TissueTo determine whether Triton-X100 is useful for the delivery of molecular-specific optical contrast agents, subcutaneous tumors were labeled for EGFR in the presence of topical permeation enhancers. Freshly excised tumors were topically treated for with antiEGFR-647 diluted in 1% Triton-X100, 10% DMSO, or PBS. The labeled tissues were sliced in cross section, counterstained with acriflavine-HCL, and imaged perpendicular to the labeling surface. Figure 7 shows representative confocal fluorescence images of EGFR labeling in the presence of different topical permeation enhancers. The surface of the tissue where the contrast agent was applied appears at the top of each panel. EGFR labeling is denoted in red and acriflavine-HCL labeling in green. Treatment with 1% Triton-X100 facilitated the uniform delivery of antiEGFR-647 to a depth of . Washing of the tissue after contrast agent delivery yielded a honeycomb pattern of labeling consistent with that observed in vitro. EGFR labeling was reproducibly observed around all squamous cells to the full depth of contrast agent delivery. The intensity of labeling was similar to that observed in cell monolayers labeled in the presence and absence of Triton-X100 (data not shown). In contrast, EGFR labeling in DMSO- and PBS-treated tissues was limited to the superficial layers of cells ( deep). Fig. 7EGFR targeting in the presence of topical permeation enhancers. Subcutaneously generated 1483 tumors were topically labeled for with antiEGFR-647 (red) diluted in 1% Triton-X100, 10% DMSO, or PBS. The tissues were sliced and imaged perpendicular to the labeling surface, shown at the top. Tissues were counterstained with acriflavine-HCL (green) to highlight the tissue morphology. In Triton-X100 treated tissues, uniform EGFR labeling was observed around all squamous cells to a depth of . EGFR labeling in the DMSO- and PBS-treated controls was limited to the superficial cell layers. The scale bar represents . 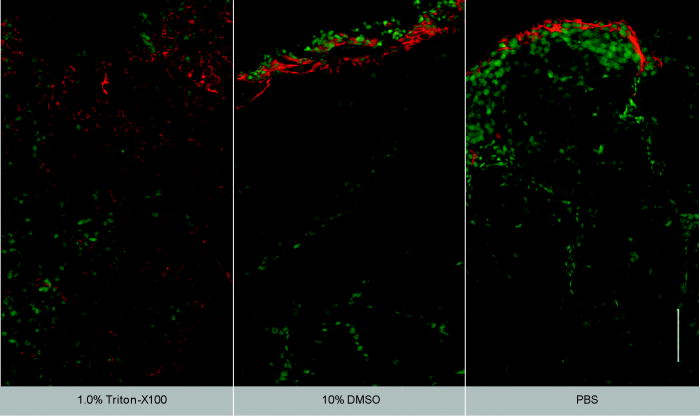 3.7.Multitarget Labeling in TumorsTo demonstrate the feasibility of delivering multiple optical contrast agents to different cell compartments, three different targeting moieties were topically applied to tumors in the presence of Triton-X100. The specificity and bioactivity of each targeting moiety was established in vitro prior to tissue labeling. No differences in targeting were observed with Triton-X100 co-treatment of live and fixed cells (data not shown). Figure 8 shows representative confocal images of freshly excised tumor tissue simultaneously labeled for EGFR, Cyclin D1, and nucleic acid content in the presence of 1% Triton-X100. The tissues were topically labeled, washed, sliced, and imaged perpendicular to the labeling surface. AntiEGFR-647 labeling (red) appeared in a characteristic honeycomb pattern. AntiCyclin D1-488 labeling (green) was diffusely spread through the cytoplasm of cancer cells. Propidium iodide labeling (orange) appeared in the nuclei of permeabilized cells. EGFR, Cyclin D1, and propidium iodide labeling always appeared together (overlay), suggesting that the labeling is limited to cells permeabilized by the Triton-X100 treatment. Little to no antibody labeling was observed when isotype controls and propidium iodide were administered in the presence of Triton-X100, suggesting that unbound contrast agents were sufficiently removed with the washing steps. No propidium iodide labeling was present in tissues treated with PBS instead of Triton-X100 (data not shown). Fig. 8Cotargeting of clinically relevant cancer biomarkers. Subcutaneously generated 1483 tumors were topically labeled for with three molecular-specific contrast agents diluted in 1.0% Triton-X100. The contrast agents were targeted to EGFR on the cell membrane (antiEGFR-647, red), Cyclin D1 in the cytoplasm (antiCyclin D1, green), and nucleic acids in the nucleus (propidium iodide, orange). After labeling, the tissues were washed, sliced, and imaged perpendicular to the labeling surface. The contrast agents were found to localize to the appropriate cell compartments. EGFR, Cyclin D1, and nucleic acid labeling always appeared together in treated tissue (overlay). The observed pattern of labeling was highly uniform and reproducible from sample to sample. Little to no labeling was observed in IgG-treated controls with Triton-X100 cotreatment, suggesting that the washing of the tissue was sufficient to remove unbound contrast agents. The scale bar represents .  4.DiscussionOptical contrast agents developed for cancer biomarker detection have demonstrated high specificity in cell and tissue models. Generally ranging in size from (peptides and affibodies) to (antibodies), most molecular-specific contrast agents have a limited ability to penetrate mucosal tissue. Chemical modification and encapsulation strategies to improve tissue penetration have only proven useful for molecules at the small end of the size spectrum.41 The topical delivery of tissue-impermeant contrast agents presents an interesting challenge because the success of tissue labeling is dependent on the efficiency and uniformity of contrast agent delivery. Furthermore, unbound contrast agents generally need to be washed out prior to imaging for high optical contrast. In this paper, we evaluate ability of Triton-X100 to deliver optical contrast agents that lack the appropriate physiochemical properties for unaided tissue permeation. Confocal microscopy studies of macromolecule penetration in the bladder mucosa were used to examine the uniformity of tissue permeabilization. The bladder mucosa is a particularly interesting model because the natural folding of the deflated bladder allows the epithelium to be imaged in cross section without the need for tissue slicing. In this model, we observed that a fixed volume of 0.5% Triton-X100 can deliver molecules up to in size across treated epithelium. By our estimate, the cells of the epithelium are receiving a treatment dose ranging from /cell as the Triton-X100 progresses through the tissue. Tissue permeation appears to primarily follow a transcellular route, appearing as a strong fluorescent signal within cells. In tissues probed with 3 and macromolecules, the fluorescence is uniform across the entire epithelium. In tissues probed with molecules, only the cell nuclei appear as dark spots. Extracellular fluorescence is evident between cells at the leading edge of the treatment, suggesting that Triton-X100 also facilitates paracellular delivery. Washing of the epithelium removes both intracellular and extracellular probes, yielding a uniformly dark tissue. Together, these observations indicate that Triton-X100 may be useful for the delivery of contrast agents targeted to both intracellular and extracellular biomarkers. Studies of Triton-X100 treatment in fresh oral mucosa specimens indicate that the depth of permeation can be controlled. The leading edge of permeation treatment was well defined at all concentrations examined, allowing measurement of penetration depth as a function time and concentration. The penetration depth increased linearly with treatment time for all sizes of probe macromolecules over a observation period. There was no apparent delay for the contrast agents to permeate through an intact keratin layer. The maximal rate of epithelial permeation increased with increasing Triton-X100 concentration. These trends were highly reproducible, varying from sample to sample. This data demonstrate that it is possible to regulate the depth of Triton-X100 treatment by adjusting the Triton-X100 concentration and treatment duration. The depth of labeling following treatment was determined by contrast agent size, with larger probes demonstrating shallower penetration at the same treatment concentration as smaller molecules. Interestingly, it does not appear advantageous to use Triton-X100 concentrations much above 1% because little improvement in the rate of permeation is observed between tissues treated with 1 and 2.5% Triton-X100. Differences were apparent in the permeation of tissues when compared to cell monolayers. In our companion paper (Part 1), we showed that cells can be permeabilized with /cell Triton-X100 and that nuclear penetration of 40 and molecules can be achieved with /cell Triton-X100. In tissue, nuclear penetration is limited to molecules of or less. Occasional nuclear penetration of molecules is observed at the surface of treated tissue and is generally limited to one to two cell layers. If we consider an oral biopsy treated with 1% Triton-X100 for , the normalized Triton-X100 concentration is in the range of /cell for approximately half of the treatment time. Enhanced nuclear permeation is not observed with higher Triton-X100 concentrations or changes in treatment time. Thus, it appears likely that Triton-X100 preferentially permeabilizes cell membranes in its movement through tissue and is not sufficiently concentrated locally for the generation of large nuclear pores. In tissue, the normalized Triton-X100 concentration changes with treatment time and depth, such that superficial cells are treated to higher doses of Triton-X100 than deeper cells. Nevertheless, cell viability experiments in tissue phantoms seem to indicate that in a three-dimensional environment, cells are more likely to remain viable at higher doses of Triton-X100. In phantoms, the viability cutoff is /cell, with cells at the periphery losing their ability to metabolize MTT at higher concentrations. These studies suggest that at Triton-X100 concentrations of /cell or less, cell viability is determined the mean concentration per cell rather than local concentration gradients. This leads us to speculate that tissues can be safely permeated with Triton-X100 as long as the treatment time and concentration are optimized to fall below a normalized concentration of /cell. Further studies are needed to determine whether this will hold true in vivo. Depth control will be advantageous for the use of topical contrast agents in humans. By limiting the penetration of optical contrast agents to a finite depth, the systemic delivery of contrast agents with undefined toxicity can be avoided. Because the mucosal epithelium is a renewable tissue, contrast agents adhering to epithelial cells will likely be shed with tissue turnover. For the optical detection of disease biomarkers, some compensation may be required for differences in permeation rate of normal and abnormal tissue. In the tissues studied here, however, a difference was observed between normal squamous epithelium and undifferentiated cancer tissue. Depth-sensitive optical imaging or spectroscopy devices could potentially be used to monitor the depth of permeation and determine when to halt the reaction by washing. The use of Triton-X100 as a topical permeation enhancer allows the delivery of optical contrast agents that lack the appropriate size and chemical properties for tissue penetration. Molecular-specific contrast agents as large as antibodies can be successfully delivered to both intracellular and extracellular targets using Triton-X100. In this paper, we demonstrate that three clinically relevant biomarkers of cancer can be simultaneously labeled with the topical co-administration with Triton-X100. The EGFR, which is located on the surface of cells, is thought to be a promising target because its expression is elevated in a variety of dysplastic and cancerous tissues.47, 48, 49 The overexpression of Cyclin D1, detected here in the cytoplasm, is associated with a poor prognosis in patients with head and neck tumors.50, 51, 52, 53 Measures of nuclear morphology, delineated here with propidium iodide, have been proposed as an objective measure of the transition from preneoplastic to neoplastic tissue.54 In vitro studies of cell labeling in the presence and absence of Triton-X100 have demonstrated that structure and availability of these biomarkers in live cells is similar to that fixed cells (data not shown). The targeting of these biomarkers with molecular-specific contrast agents in tissue yielded uniform, reproducible labeling in all transverse sections examined by confocal microscopy. The localization and intensity of tissue labeling was similar to that observed in vitro. In contrast, treatment with DMSO or PBS failed to enhance the penetration tissue-impermeant optical probes. The feasibility of translating Triton-X100 for in vivo use remains to be determined. In our companion paper, we demonstrated that Triton-X100–mediated permeabilization of cells is reversible and that cells retain their metabolic and proliferative capacities while recovering membrane integrity. Others have demonstrated that only concentrations of produce visible side effects in patch tests of human skin, consisting of transdermal water loss and erythema.55 It has been reported that two or more permeation enhancers applied together can act synergistically,56 suggesting that it may be possible to further reduce the effective Triton-X100 concentration by combining it with other topical agents. Tissue damage reported with the use of other surfactant-based permeation enhancers has generally been limited and reversible.57, 58, 59 The next step will be to characterize the safety, toxicity, biological activity, and reversibility of Triton-X100–mediated permeation at clinically useful doses in animal models. 5.ConclusionsThis paper demonstrates that Triton-X100 is a promising topical permeation enhancer for the mucosal delivery of tissue-impermeant optical contrast agents. Compared to other topical permeation enhancers, Triton-X100 can deliver a much broader size range of molecules. No chemical modification of optical contrast agents is needed, both targeted and untargeted molecules as large as can be delivered uniformly through normal and cancer tissue. The depth of tissue permeation can be modulated, allowing for epithelial containment of topical contrast agents. The coadministration of Triton-X100 with molecular-specific contrast agents facilitates the simultaneous labeling of cell membrane, cytoplasmic, and nuclear targets. Further work is needed to establish the safety of this approach for in vivo use. AcknowledgmentsWe thank Vivian Mack for her assistance with cell culture and animal care. This work was supported in part by an NIH BRP Grant (No. CA103830) and a training fellowship from the Keck Center Nanobiology Training Program of the Gulf Coast Consortia (NIH Grant No. 5 T90 DK071054-03). ReferencesS. Folli, P. Westermann, D. Braichotte, A. Pelegrin, G. Wagnieres, H. van den Bergh, and J. P. Mach,
“Antibody-indocyanin conjugates for immunophotodetection of human squamous cell carcinoma in nude mice,”
Cancer Res., 54
(10), 2643
–2649
(1994). 0008-5472 Google Scholar
B. Ballou, G. W. Fisher, J. S. Deng, T. R. Hakala, M. Srivastava, and D. L. Farkas,
“Cyanine fluorochrome-labeled antibodies in vivo: assessment of tumor imaging using Cy3, Cy5, Cy5.5, and Cy7,”
Cancer Detect. Prev., 22
(3), 251
–257
(1998). https://doi.org/10.1046/j.1525-1500.1998.0OA25.x 0361-090X Google Scholar
N. S. Soukos, M. R. Hamblin, T. F. Deutsch, and T. Hasan,
“Monoclonal antibody-tagged receptor-targeted contrast agents for detection of cancers,”
Proc. SPIE, 4259 115
–128
(2001). 0277-786X Google Scholar
N. S. Soukos, M. R. Hamblin, S. Keel, R. L. Fabian, T. F. Deutsch, and T. Hasan,
“Epidermal growth factor receptor-targeted immunophotodiagnosis and photoimmunotherapy of oral precancer in vivo,”
Cancer Res., 61
(11), 4490
–4496
(2001). 0008-5472 Google Scholar
Y. Koyama, T. Barrett, Y. Hama, G. Ravizzini, P. L. Choyke, and H. Kobayashi,
“In vivo molecular imaging to diagnose and subtype tumors through receptor-targeted optically labeled monoclonal antibodies,”
Neoplasia, 9
(12), 1021
–1029
(2007). 1522-8002 Google Scholar
Y. Koyama, Y. Hama, Y. Urano, D. M. Nguyen, P. L. Choyke, and H. Kobayashi,
“Spectral fluorescence molecular imaging of lung metastases targeting HER2/neu,”
Clin. Cancer Res., 13
(10), 2936
–2945
(2007). 1078-0432 Google Scholar
K. E. Adams, S. Ke, S. Kwon, F. Liang, Z. Fan, Y. Lu, K. Hirschi, M. E. Mawad, M. A. Barry, and E. M. Sevick-Muraca,
“Comparison of visible and near-infrared wavelength-excitable fluorescent dyes for molecular imaging of cancer,”
J. Biomed. Opt., 12
(2), 024017
(2007). https://doi.org/10.1117/1.2717137 1083-3668 Google Scholar
J. L. Kovar, W. M. Volcheck, J. Chen, and M. A. Simpson,
“Purification method directly influences effectiveness of an epidermal growth factor-coupled targeting agent for noninvasive tumor detection in mice,”
Anal. Biochem., 361
(1), 47
–54
(2007). 0003-2697 Google Scholar
J. L. Kovar, M. A. Johnson, W. M. Volcheck, J. Chen, and M. A. Simpson,
“Hyaluronidase expression induces prostate tumor metastasis in an orthotopic mouse model,”
Am. J. Pathol., 169
(4), 1415
–1426
(2006). https://doi.org/10.2353/ajpath.2006.060324 0002-9440 Google Scholar
S. Ke, X. Wen, M. Gurfinkel, C. Charnsangavej, S. Wallace, E. M. Sevick-Muraca, and C. Li,
“Near-infrared optical imaging of epidermal growth factor receptor in breast cancer xenografts,”
Cancer Res., 63
(22), 7870
–7875
(2003). 0008-5472 Google Scholar
K. L. Carraway 3rd and R. A. Cerione,
“Fluorescent-labeled growth factor molecules serve as probes for receptor binding and endocytosis,”
Biochemistry, 32
(45), 12039
–12045
(1993). 0006-2960 Google Scholar
C. H. Tung, Y. Lin, W. K. Moon, and R. Weissleder,
“A receptor-targeted near-infrared fluorescence probe for in vivo tumor imaging,”
ChemBioChem, 3
(8), 784
–786
(2002). 1439-4227 Google Scholar
S. Achilefu, R. B. Dorshow, J. E. Bugaj, and R. Rajagopalan,
“Novel receptor-targeted fluorescent contrast agents for in vivo tumor imaging,”
Invest. Radiol., 35
(8), 479
–485
(2000). https://doi.org/10.1097/00004424-200008000-00004 0020-9996 Google Scholar
A. Becker, C. Hessenius, K. Licha, B. Ebert, U. Sukowski, W. Semmler, B. Wiedenmann, and C. Grotzinger,
“Receptor-targeted optical imaging of tumors with near-infrared fluorescent ligands,”
Nat. Biotechnol., 19
(4), 327
–331
(2001). https://doi.org/10.1038/86707 1087-0156 Google Scholar
D. Citrin, T. Scott, M. Sproull, C. Menard, P. J. Tofilon, and K. Camphausen,
“In vivo tumor imaging using a near-infrared-labeled endostatin molecule,”
Int. J. Radiat. Oncol., Biol., Phys., 58
(2), 536
–541
(2004). 0360-3016 Google Scholar
R. Weissleder, C. H. Tung, U. Mahmood, A. Bogdanov Jr.,
“In vivo imaging of tumors with protease-activated near-infrared fluorescent probes,”
Nat. Biotechnol., 17
(4), 375
–378
(1999). https://doi.org/10.1038/7933 1087-0156 Google Scholar
C. H. Tung, U. Mahmood, S. Bredow, and R. Weissleder,
“In vivo imaging of proteolytic enzyme activity using a novel molecular reporter,”
Cancer Res., 60
(17), 4953
–4958
(2000). 0008-5472 Google Scholar
K. Marten, C. Bremer, K. Khazaie, M. Sameni, B. Sloane, C. H. Tung, and R. Weissleder,
“Detection of dysplastic intestinal adenomas using enzyme-sensing molecular beacons in mice,”
Gastroenterology, 122
(2), 406
–414
(2002). 0016-5085 Google Scholar
C. Bremer, C. H. Tung, A. Bogdanov Jr., and R. Weissleder,
“Imaging of differential protease expression in breast cancers for detection of aggressive tumor phenotypes,”
Radiology, 222
(3), 814
–818
(2002). 0033-8419 Google Scholar
M. Kamiya, H. Kobayashi, Y. Hama, Y. Koyama, M. Bernardo, T. Nagano, P. L. Choyke, and Y. Urano,
“An enzymatically activated fluorescence probe for targeted tumor imaging,”
J. Am. Chem. Soc., 129
(13), 3918
–3929
(2007). 0002-7863 Google Scholar
J. V. Frangioni,
“In vivo near-infrared fluorescence imaging,”
Curr. Opin. Chem. Biol., 7
(5), 626
–634
(2003). https://doi.org/10.1016/j.cbpa.2003.08.007 1367-5931 Google Scholar
R. Cotran, V. Kumar, and T. Collins, Robbins Pathologic Basis of Disease, W. B. Saunders, Philadelphia
(1999). Google Scholar
J. Levi, Z. Cheng, O. Gheysens, M. Patel, C. T. Chan, Y. Wang, M. Namavari, and S. S. Gambhir,
“Fluorescent fructose derivatives for imaging breast cancer cells,”
Bioconjugate Chem., 18
(3), 628
–634
(2007). 1043-1802 Google Scholar
R. O’Neil, L. Wu, and N. Mullani,
“Uptake of a fluorescent deoxyglucose analog (2-NBDG) in tumor cells,”
Mol. Imaging Biol., 7
(6), 388
–392
(2005). 1536-1632 Google Scholar
Z. Cheng, J. Levi, Z. Xiong, O. Gheysens, S. Keren, X. Chen, and S. S. Gambhir,
“Near-infrared fluorescent deoxyglucose analogue for tumor optical imaging in cell culture and living mice,”
Bioconjugate Chem., 17
(3), 662
–669
(2006). https://doi.org/10.1021/bc050345c 1043-1802 Google Scholar
T. J. Muldoon, M. C. Pierce, D. L. Nida, M. D. Williams, A. Gillenwater, and R. Richards-Kortum,
“Subcellular-resolution molecular imaging within living tissue by fiber microendoscopy,”
Opt. Express, 15
(25), 16413
–16423
(2007). https://doi.org/10.1364/OE.15.016413 1094-4087 Google Scholar
Y. Kakeji, S. Yamaguchi, D. Yoshida, K. Tanoue, M. Ueda, A. Masunari, T. Utsunomiya, M. Imamura, H. Honda, Y. Maehara, and M. Hashizume,
“Development and assessment of morphologic criteria for diagnosing gastric cancer using confocal endomicroscopy: an ex vivo and in vivo study,”
Endoscopy, 38
(9), 886
–890
(2006). 0013-726X Google Scholar
A. L. Polglase, W. J. McLaren, S. A. Skinner, R. Kiesslich, M. F. Neurath, and P. M. Delaney,
“A fluorescence confocal endomicroscope for in vivo microscopy of the upper- and the lower-GI tract,”
Gastrointest. Endosc., 62
(5), 686
–695
(2005). 0016-5107 Google Scholar
I. A. Siegel, K. T. Izutsu, and E. Watson,
“Mechanisms of non-electrolyte penetration across dog and rabbit oral mucosa in vitro,”
Arch. Oral Biol., 26
(5), 357
–361
(1981). 0003-9969 Google Scholar
V. H. Lee,
“Enzymatic barriers to peptide and protein absorption,”
Crit. Rev. Ther. Drug Carrier Syst., 5
(2), 69
–97
(1988). 0743-4863 Google Scholar
R. A. Hughes, I. Toth, P. Ward, S. J. Ireland, and W. A. Gibbons,
“Lipidic peptides. III: lipidic amino acid and oligomer conjugates of morphine,”
J. Pharm. Sci., 80
(12), 1103
–1105
(1991). 0022-3549 Google Scholar
H. A. Benson,
“Transdermal drug delivery: penetration enhancement techniques,”
Curr. Drug Delivery, 2
(1), 23
–33
(2005). Google Scholar
M. Thanou, J. C. Verhoef, and H. E. Junginger,
“Oral drug absorption enhancement by chitosan and its derivatives,”
Adv. Drug Delivery Rev., 52
(2), 117
–126
(2001). 0169-409X Google Scholar
V. Erjavec, Z. Pavlica, M. Sentjurc, and M. Petelin,
“In vivo study of liposomes as drug carriers to oral mucosa using EPR oximetry,”
Int. J. Pharm., 307
(1), 1
–8
(2006). 0378-5173 Google Scholar
H. Li, J. H. An, J. S. Park, and K. Han,
“Multivesicular liposomes for oral delivery of recombinant human epidermal growth factor,”
Arch. Pharmacal Res., 28
(8), 988
–994
(2005). 0253-6269 Google Scholar
F. S. Farshi, A. Y. Ozer, M. T. Ercan, and A. A. Hincal,
“In-vivo studies in the treatment of oral ulcers with liposomal dexamethasone sodium phosphate,”
J. Microencapsul., 13
(5), 537
–544
(1996). 0265-2048 Google Scholar
A. N. C. Anigbogu, A. C. Williams, B. W. Barry, and H. G. M. Edwards,
“Fourier transform raman spectroscopy of interactions between the penetration enhancer dimethyl sulfoxide and human stratum corneum,”
Int. J. Pharm., 125
(2), 265
–282
(1995). 0378-5173 Google Scholar
H. A. E. Benson,
“Transfersomes for transdermal drug delivery,”
Expert Opin. Drug Delivery, 3
(6), 727
–737
(2006). Google Scholar
P. N. Gupta, V. Mishra, P. Singh, A. Rawat, P. Dubey, S. Mahor, and S. P. Vyas,
“Tetanus toxoid-loaded transfersomes for topical immunization,”
J. Pharm. Pharmacol., 57
(3), 295
–301
(2005). 0373-1022 Google Scholar
J. Hao and P. W. Heng,
“Buccal delivery systems,”
Drug Dev. Ind. Pharm., 29
(8), 821
–832
(2003). 0363-9045 Google Scholar
F. Veuillez, Y. N. Kalia, Y. Jacques, J. Deshusses, and P. Buri,
“Factors and strategies for improving buccal absorption of peptides,”
Eur. J. Pharm. Biopharm., 51
(2), 93
–109
(2001). 0939-6411 Google Scholar
P. G. Sacks, S. M. Parnes, G. E. Gallick, Z. Mansouri, R. Lichtner, K. L. Satya-Prakash, S. Pathak, and D. F. Parsons,
“Establishment and characterization of two new squamous cell carcinoma cell lines derived from tumors of the head and neck,”
Cancer Res., 48
(10), 2858
–2866
(1988). 0008-5472 Google Scholar
K. J. Mattern, C. Nakornchai, and W. M. Deen,
“Darcy permeability of agarose-glycosaminoglycan gels analyzed using fiber-mixture and Donnan models,”
Biophys. J., 95
(2), 648
–656
(2008). 0006-3495 Google Scholar
E. M. Johnson, D. A. Berk, R. K. Jain, and W. M. Deen,
“Hindered diffusion in agarose gels: test of effective medium model,”
Biophys. J., 70
(2), 1017
–1023
(1996). 0006-3495 Google Scholar
K. Sokolov, J. Galvan, A. Myakov, A. Lacy, R. Lotan, and R. Richards-Kortum,
“Realistic three-dimensional epithelial tissue phantoms for biomedical optics,”
J. Biomed. Opt., 7
(1), 148
–156
(2002). https://doi.org/10.1117/1.1427052 1083-3668 Google Scholar
E. R. Hsu, E. V. Anslyn, S. Dharmawardhane, R. Alizadeh-Naderi, J. S. Aaron, K. V. Sokolov, A. K. El-Naggar, A. M. Gillenwater, and R. R. Richards-Kortum,
“A far-red fluorescent contrast agent to image epidermal growth factor receptor expression,”
Photochem. Photobiol., 79
(3), 272
–279
(2004). https://doi.org/10.1562/FR-03-15.1 0031-8655 Google Scholar
H. Modjtahedi and C. J. Dean,
“The receptor for EGF and its ligands: expression, prognostic value, and target for therapy in cancer,”
Int. J. Oncol., 4 277
–296
(1994). 1019-6439 Google Scholar
W. Yasui, H. Sumiyoshi, J. Hata, T. Kameda, A. Ochiai, H. Ito, and E. Tahara,
“Expression of epidermal growth factor receptor in human gastric and colonic carcinomas,”
Cancer Res., 48
(1), 137
–141
(1988). 0008-5472 Google Scholar
J. A. Vet, F. M. Debruyne, and J. A. Schalken,
“Molecular prognostic factors in bladder cancer,”
World J. Urol., 12
(2), 84
–88
(1994). 0724-4983 Google Scholar
A. Namazie, S. Alavi, O. I. Olopade, G. Pauletti, N. Aghamohammadi, M. Aghamohammadi, J. A. Gornbein, T. C. Calcaterra, D. J. Slamon, M. B. Wang, and E. S. Srivatsan,
“Cyclin D1 amplification and p16(MTS1/CDK4I) deletion correlate with poor prognosis in head and neck tumors,”
Laryngoscope, 112
(3), 472
–481
(2002). 0023-852X Google Scholar
J. A. Akervall, R. J. Michalides, H. Mineta, A. Balm, A. Borg, M. R. Dictor, Y. Jin, B. Loftus, F. Mertens, and J. P. Wennerberg,
“Amplification of cyclin D1 in squamous cell carcinoma of the head and neck and the prognostic value of chromosomal abnormalities and cyclin D1 overexpression,”
Cancer, 79
(2), 380
–389
(1997). 0008-543X Google Scholar
R. J. Michalides, N. M. van Veelen, P. M. Kristel, A. A. Hart, B. M. Loftus, F. J. Hilgers, and A. J. Balm,
“Overexpression of cyclin D1 indicates a poor prognosis in squamous cell carcinoma of the head and neck,”
Arch. Otolaryngol., 123
(5), 497
–502
(1997). 0003-9977 Google Scholar
R. Michalides, N. van Veelen, A. Hart, B. Loftus, E. Wientjens, and A. Balm,
“Overexpression of cyclin D1 correlates with recurrence in a group of forty-seven operable squamous cell carcinomas of the head and neck,”
Cancer Res., 55
(5), 975
–978
(1995). 0008-5472 Google Scholar
M. F. Mitchell, W. N. Hittelman, W. K. Hong, R. Lotan, and D. Schottenfeld,
“The natural history of cervical intraepithelial neoplasia: an argument for intermediate endpoint biomarkers,”
Cancer Epidemiol. Biomarkers Prev., 3
(7), 619
–626
(1994). 1055-9965 Google Scholar
F. van Ruissen, M. Le, J. M. Carroll, P. G. M. van der Valk, and J. Schalkwijk,
“Differential effects of detergents on keratinocyte gene expression,”
J. Invest. Dermatol., 110
(4), 358
(1998). https://doi.org/10.1046/j.1523-1747.1998.00155.x 0022-202X Google Scholar
B. Mollgaard,
“Synergistic effects in percutaneous enhancement,”
Pharmaceutical Skin Penetration Enhancement, 220
–242 Marcel Dekker, New York
(1993). Google Scholar
E. S. Swenson, W. B. Milisen, and W. Curatolo,
“Intestinal permeability enhancement: efficacy, acute local toxicity, and reversibility,”
Pharmacol. Res., 11
(8), 1132
–1142
(1994). 1043-6618 Google Scholar
E. K. Anderberg and P. Artursson,
“Epithelial transport of drugs in cell culture. VIII: Effects of sodium dodecyl sulfate on cell membrane and tight junction permeability in human intestinal epithelial (Caco-2) cells,”
J. Pharm. Sci., 82
(4), 392
–398
(1993). 0022-3549 Google Scholar
E. K. Anderberg, C. Nystrom, and P. Artursson,
“Epithelial transport of drugs in cell culture. VII: Effects of pharmaceutical surfactant excipients and bile acids on transepithelial permeability in monolayers of human intestinal epithelial (Caco-2) cells,”
J. Pharm. Sci., 81
(9), 879
–887
(1992). 0022-3549 Google Scholar
|


