|
|
1.IntroductionEnd-to-end nerve repair remains the treatment of choice for nerve grafting and regeneration in surgical nerve repair. However, complete functional recovery cannot be achieved in most cases. It is difficult to get accurate coaptation of the nerves with the same function. The nerve root can be divided into an anterior root that consists of motor fibers and a posterior root that consists of sensory fibers. If the anterior and posterior roots in a mixed cauda equina nerve cannot be matched and coaptated accurately during surgical nerve repair, the regenerated nerve fibers will fail to grow into the proper terminals, and the sensory and motor functions will be lost.1 Thus, correct intraoperative identification of anterior and posterior roots of cauda equina nerves is important. However, it remains a great challenge in mixed nerve repair. Currently, several methods have been developed to differentiate the two types of roots: anatomic identification,2, 3 electrophysiological stimulation,4, 5 radioisotopic method,6 histochemical method,7, 8, 9, 10 and immunohistochemical technology.1 Unfortunately, all of these methods share the common disadvantage that they take at least one hour or even more to finish the identification. It is urgent to develop a rapid and accurate technique to identify anterior and posterior roots. The method of near-infrared (NIR) diffuse reflectance spectroscopy used in this paper provides the feasibility and practicality for rapid (in several minutes) identification of anterior and posterior roots of cauda equina nerves. NIR spectroscopy is a nondestructive technique and is also a rapid and accurate method for a wide range of analytical applications.11 It can be used to identify and quantify many organic molecules from vibration absorptions at specific frequencies. This method is particularly effective in materials containing –CH, –OH, and –NH (and –SH) chemical functional groups, because the NIR spectroscopy region contains absorption bands corresponding to overtones and combinations of vibrations of these chemical groups.12, 13 NIR spectra contain a lot of information about chemical constituents and physicochemical properties of the samples.11, 12, 13, 14 Today, the NIR spectroscopy technique together with multivariate analysis is widely used not only in chemical, pharmaceutical, and food industries,12, 13, 14 but also in the field of noninvasive clinical diagnostics including the analysis of blood, brain trauma, tumor, skin, etc.15, 16, 17 Generally speaking, the tissue constituents of anterior and posterior roots of cauda equina nerves are almost the same, including proteins, neurotransmitters (i.e., substance P, acetylcholine, etc.), neuropeptide polysaccharides, phospholipids, peptidoglycans, and nucleic acids, but the quantity and distribution differ between the two root types. Although the differences are obscure and hard to understand, they are implicit in the NIR spectra. The aim of this study was to develop an NIR spectroscopy method to rapidly identify anterior and posterior roots of cauda equina nerves and to determine its feasibility for identifying anterior and posterior roots by using cluster analysis to extract the differences in NIR spectra. 2.ExperimentsForty nerves from four Beagle dogs were harvested and scanned by an NIR spectrometer. The collected spectra were than classified by clustering analysis, and the Fuminori enzyme-staining technique was used for comparison. The detailed process was as follows. 2.1.MaterialsAcetylthiocholine iodide and tetraisopropyl pyrophosphoramide were purchased from Sigma Chemicals (St. Louis, Missouri). Potassium ferricyanide and sodium citrate were purchased from Xilong Chemicals (Shantou, China). Copper sulfate was purchased from Zhengxing Chemicals (Shanghai, China). 2.2.Sample PreparationFour adult Beagle dogs were anesthetized generally by intraperitoneal ketamine injection and sacrificed by intravenous injection of air. Canalis vertebralis were opened, and both anterior and posterior roots of the cauda equina nerves were harvested. Twenty anterior roots and twenty posterior roots were collected and numbered H1 to H40. These specimens were immediately frozen with liquid nitrogen for preservation. 2.3.Near-Infrared Spectra MeasurementNIR spectra were measured using a multipurpose Fourier transform NIR (FT-NIR) spectrometer (MPA, Bruker Optics, Inc., Ettlingen, Germany) equipped with a PbS detector and a fiber optic probe. The fiber-optic probe consists of a core, a cladding with a lower refractive index, and a protective jacket. One hundred transmitting and one hundred receiving fibers with active areas of in diameter were packed into the optical fiber core randomly. The diameter of the tip of the bundle is . The spectra were collected with OPUS software (Bruker Optics, Inc.). Each anterior root and posterior root sample was cut to a length of after being thawed to room temperature and was put directly onto the top of the fiber-optic probe. The nerve sample covered only a portion of the probe tip. The fiber-optic probe was kept in the vertical up position to maintain the same contact pressure between the nerve sample and the fiber-optic probe in all measurements. The measurements were performed in air and room temperature . Each spectrum represented the average of 64 scans at a resolution of , over the wave number of . Each sample was scanned three times. The average spectrum of each sample was used for further analysis. 2.4.Data AnalysisCluster analysis was used to distinguish the anterior and posterior roots of the cauda equina nerves based on the differences in their NIR spectral features. The calculation was performed by OPUS/IDENT (version 5.0) multivariate statistical qualitative analysis software (Bruker Optics, Inc.). The spectra of the anterior and posterior roots were scaled by vector normalization before clustering. The Euclidean distance algorithm was used for intersample distance, and Ward’s algorithm was used for interclass distance. 2.5.Fuminori Enzyme Staining2.5.1.Preparation of the staining solutionThe staining solution was prepared by mixing the fresh stock solutions before staining. Final concentrations were acetylthiocholine iodide , phosphate buffer , sodium citrate , copper sulfate , potassium ferricyanide , and tetraisopropyl pyrophosphoramide . The pH of phosphate buffer was adjusted to 6.5. The final solutions were stored at for . Fuminori8 reported a rapid and easy preparation of solution using three bottles and tubes. Acetylthiocholine iodide and tetraisopropyl pyrophosphoramide (bottles B and C) were stocked as powders at , and solutions (bottle A and all tubes) were stocked at for more than . 2.5.2.Preparation of specimen and stainingThe specimens used in the Fuminori enzyme-staining were the same as the ones used in the measurement of the NIR spectra of the nerve. These specimens were immediately frozen by liquid nitrogen. From each specimen, 12 frozen sections with a thickness of were cut with a cryostat. The specimens were placed in 10% formal calcium solution and fixed for . The specimens were then washed three times for in distilled water. The 12 sections of each specimen were divided into six groups ( each) and stained by Fuminori enzyme-staining techniques. The sections were placed under a microscope and observed at times of 1, 2, 4, 6, 8, and after staining. 3.Results and Discussion3.1.Spectral Data Pretreatment MethodNIR spectroscopy was used to differentiate the anterior/posterior roots of cauda equina nerves based on the structural and biochemical differences of peripheral nerves as reflected by the variations in their NIR spectral patterns. Representative NIR spectra of five anterior roots and five posterior roots are shown in Fig. 1 . The spectra of the anterior and posterior roots were carefully examined, and it was found that there were not observable differences between the spectra of the anterior and posterior root samples. In this study, NIR spectroscopy was employed in combination with cluster analysis to classify the anterior and posterior roots. Several spectral pretreatment methods were tested for cluster analysis, including no preprocessing, vector normalization, first derivative, first derivative combined with vector normalization, second derivative, and second derivative combined with vector normalization. The different wave number ranges, which also affected the clustering accuracy of nerve samples, were selected for spectral preprocessing and the clustering algorithm. Table 1 shows the clustering accuracy of the preprocessing method over the representative wave number ranges. The results suggested that the first derivative was better than the second derivative, and vector normalization over the range of and was chosen as the optimal spectral data pretreatment method for this data set. The derivative technique is often used to process spectral data because it helps to separate overlapping absorption bands, remove baseline shifts, and increase apparent spectral resolution. But it adds noise to the spectra simultaneously and decreases the signal-to-noise ratio. The second derivative additionally removes baseline slope but further decreases the signal-to-noise ratio compared to the first derivative. Figures 2 and 3 show the difference between the two average spectra preprocessed by the first derivative and second derivative, respectively. First and second derivatives of the spectrum were calculated by using the Savitzky-Golay algorithm with nine smoothing points in OPUS. Vector normalization, a data enhancement algorithm, is always used for eliminating redundancy information and increasing the difference in samples to improve the predictive capability and robustness of the model. In order to include the strongest absorptions of the actual tissue but exclude water absorptions, the wave number bands at and were not selected for vector normalization. The difference between the two average spectra preprocessed by vector normalization over the range of and was more significant (shown in Fig. 4 ). Therefore, the clustering accuracy of the spectra preprocessed with vector normalization over the ranges of and was chosen as the optimum for this data set. Fig. 2Difference between two average spectra preprocessed by first derivative and vector normalization over the range of . 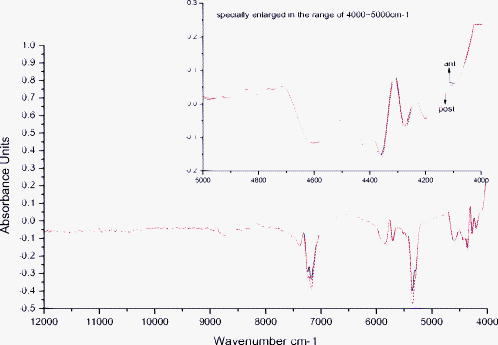 Fig. 3Difference between two average spectra preprocessed by second derivative and vector normalization over the range of . 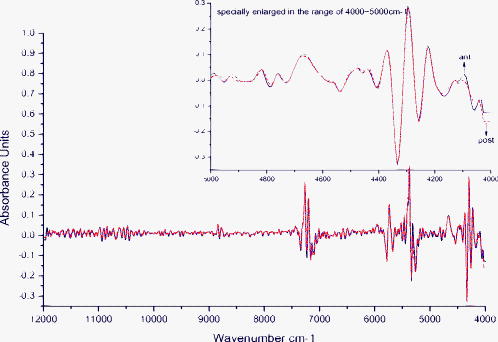 Fig. 4Difference between two average spectra preprocessed by vector normalization over the range of 11,988 to 7112 and .  Table 1Clustering accuracy of the preprocessing method over the representative wave number ranges.
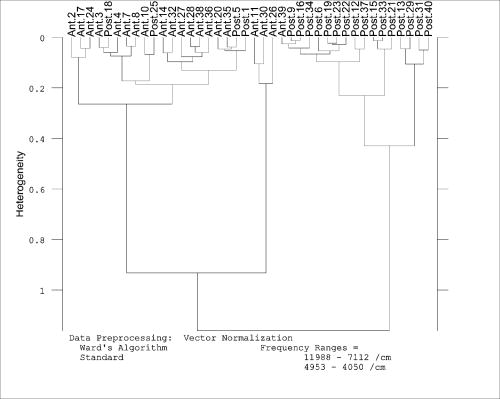
3.2.Cluster AnalysisCluster analysis was employed to identify the anterior and posterior roots of cauda equina nerves based on the differences of their spectral features. Several clustering algorithms were tried to calculate interclass distance in cluster analysis, including single linkage, complete linkage, average linkage, weighted average linkage, median algorithm, centroid algorithm, and Ward’s algorithm. The results showed that Ward’s algorithm was the optimal clustering algorithm for this data set. The Fuminori enzyme-staining technique was used to validate the accuracy of cluster analysis. Most of the anterior roots of cauda equina nerves showed clear red-brown particles after staining for , and all sections of anterior roots were colored completely after staining for . All sections of the posterior roots were still not colored after . Figure 5 shows the cluster analysis results. The dendrogram suggested that 19 of 20 anterior roots and 16 of 20 posterior roots were correctly classified—that is, the model correctly classified 35 nerves of the 40 cauda equina nerves, and the total accuracy ratio was 87.5%. The accuracy for the actual anterior root and actual posterior root were 95% and 80%, respectively. The results demonstrated that NIR spectroscopy in combination with cluster analysis methods could be used to classify anterior and posterior roots of cauda equina. It was suggested that NIR spectroscopy may provide a quick method to differentiate anterior/posterior roots in mixed cauda equina nerves. However, the data set may be too small to be representative of the range of biochemical and morphological properties of cauda equina nerves. A larger data set will be needed for the clustering model in further studies. 3.3.General DiscussionRapid, simple, and low-cost identification of anterior/posterior roots in mixed cauda equina nerves is still very difficult. Generally, the anterior root is the motor nerve and the posterior root is the sensory nerve. Acetylcholinesterase (AchE) staining can successfully identify motor and sensory nerves, but it requires at least for correct differentiation. The radioisotopic method requires or more to identify motor/sensory nerves, which may be more sensitive, while more expensive. Bright blue–labeled monoclonal (Blue-SAB) specifically reacts against the cell body and may be used to identify sensory fibers of nerve trunks by immunohistochemical technique. Unfortunately, these sophisticated methods are costly in both time and money, and they involve cumbersome preparation steps. Moreover, these identification methods are usually destructive experiments to the samples. These disadvantages make them difficult to get an immediate correct matching of anterior/posterior roots in mixed cauda equina nerves during the surgery operation. The most outstanding advantages of NIR spectroscopy over those conventional methods are little or no sample preparation and near real-time analysis. NIR spectroscopy is an extremely rapid method of measurement, with the capability of performing an analysis in about one minute. Unlike most of the conventional analytical methods, NIR spectroscopy is nondestructive and involves no chemicals. It can simultaneously determine numerous constituents or parameters, and the instrument can be transported to nearly any environment—that is, true portablility for fieldwork. Additionally, the NIR spectroscopy instrument is generally simple to operate. Despite the intuitive disadvantage of broad and overlapping absorption bands, sophisticated chemometric techniques can extract meaningful information from the complex NIR spectra. And the reproducibility of NIR method is much better than the other methods. The ability of NIR spectroscopy to differentiate samples involves detecting the differences in molecular vibrations of the examined species in the NIR region. A subtle difference in the constituents of a sample can lead to rapid characterization of the identity of that particular sample by giving a unique spectral fingerprint in the NIR region . The main difference between the motor and sensory fibers is that the acetylcholine is the neurotransmitter of motor fibers, while substance P is the neurotransmitter of sensory fibers. That difference can be detected by NIR spectroscopy, which makes it possible to classify motor/sensory fascicles using appropriate multivariate analysis tools along with NIR spectroscopy. In this study, the model of NIR spectroscopy in combination with cluster analysis correctly classified 87.5% of the anterior and posterior roots. For the classification, the overall accuracy of NIR spectroscopy was lower than the classical methods, such as the AchE staining method, radioisotopic method, and immunohistochemical technique, but it may be more feasible in practical surgical nerve repair due to its fast analysis without sample preparation. The authors believe that the overall accuracy of the proposed method will be increased by enlarging the sample size of nerves in the future. 4.ConclusionsThis study presented a rapid and effective method to identify anterior and posterior roots in mixed cauda equina nerves. The results showed unequivocally the potential of NIR spectroscopy for rapid, on-site and non destructive identification of the anterior and posterior roots. The accuracy of classification was 87.5% using the chemometric model (cluster analysis). Further studies based on a larger data set should be carried out to validate this method for the discrimination of anterior and posterior roots of cauda equina nerves. AcknowledgmentsThis work was supported both by the National Natural Science Foundation of China (Grant No. 30070767) and the Jiangsu Natural Science Foundation (Grant No. BK2005436) ReferencesX. S. Gu, Z. Q. Yan, W. X. Yan, and C. F. Chen,
“Rapid immuno staining of live nerve for identification of sensory and motor fasciculi,”
Chin. Med. J. (Beijing, Engl. Ed.), 105 949
–952
(1992). 0366-6999 Google Scholar
H. B. Williams and M. E. Jabaley,
“The importance of intraneural anatomy of the peripheral nerves to nerve repair in the forearm and hand,”
Hand Clin., 2 689
–707
(1986). 0749-0712 Google Scholar
G. P. Watchmaker, C. A. Gumucio, R. E. Crandall, M. A. Vannier, and P. M. Weeks,
“Fascicular topography of the median nerve: A computer based study to identify branching patterns,”
J. Hand Surg. [Am], 16A 53
–59
(1991). 0363-5023 Google Scholar
M. Deutinger, W. Girsch, G. Burggasser, A. Windisch, N. Mayr, and G. Freilinger,
“Clinical and electroneurographic evaluation of sensory/motor-differentiated nerve repair in the hand,”
J. Neurosurg., 78 709
–713
(1993). 0022-3085 Google Scholar
K. F. Kothbauer and K. Novak,
“Intraoperative monitoring for tethered cord surgery: An update,”
Neurosurg. Focus, 15
(2), E8
(2004). Google Scholar
Y. Hattori and K. Doi,
“Radioisotope technique to evaluate the motor functional status of donor nerve for upper extremity reconstruction,”
Tech. Hand. Up. Extrem. Surg., 8 189
–192
(2004). Google Scholar
M. Deutinger, W. Girsch, G. Burggasser, A. Windisch, D. Joshi, N. Mayr, and G. Freilinger,
“Peripheral nerve repair in the hand with and without motor sensory differentiation,”
J. Hand Surg. [Am], 18 426
–432
(1993). 0363-5023 Google Scholar
F. Kanaya,
“Mixed nerve suture facilitated by enzymestaining techniques,”
Tech. Hand. Up. Extrem. Surg., 6 140
–144
(2002). Google Scholar
M. Y. Macias, C. T. Lehman, J. R. Sanger, and D. A. Riley,
“Myelinated sensory and alpha motor axon regeneration in peripheral nerve neuromas,”
Muscle Nerve, 21 1748
–1758
(1998). 0148-639X Google Scholar
Y. Kawasaki, K. Yoshimura, K. Harii, and S. Park,
“Identification of myelinated motor and sensory axons in a regenerated mixed nerve,”
J. Hand Surg. [Am], 25 104
–111
(2000). 0363-5023 Google Scholar
G. Reich,
“Near-infrared spectroscopy and imaging: Basic principles and pharmaceutical applications,”
Adv. Drug Delivery Rev., 57 1109
–1143
(2005). 0169-409X Google Scholar
M. Ferrari, L. Mottola, and V. Quaresima,
“Principles, techniques, and limitations of near infrared spectroscopy,”
Can. J. Appl. Physiol., 29 463
–487
(2004). 1066-7814 Google Scholar
D. A. Burns and E. W. Ciurczak, Handbook of Near-Infrared Spectroscopy, 7
–18 Marcel Dekker, New York
(2001). Google Scholar
E. Bouveresse, C. Casolino, and C. de la Pezuela,
“Application of standardization methods to correct the spectral differences induced by a fibre optic probe used for the near-infrared analysis of pharmaceutical tablets,”
J. Pharm. Biomed. Anal., 18 35
–42
(1998). 0731-7085 Google Scholar
N. S. Eikje, Y. Ozaki, K. Aizawa, and S. Arase,
“Fibre optic near-infrared Raman spectroscopy for clinical noninvasive determination of water content in diseased skin and assessment of cutaneous edema,”
J. Biomed. Opt., 10 14013
(2005). 1083-3668 Google Scholar
J. D. Tobias,
“Cerebral oxygenation monitoring: Nearinfrared spectroscopy,”
Expert. Rev. Med. Devices, 3 235
–243
(2006). Google Scholar
K. R. Ward, R. R. Ivatury, R. W. Barbee, J. Terner, R. Pittman, I. P. Filho, and B. Spiess,
“Near infrared spectroscopy for evaluation of the trauma patient: A technology review,”
Resuscitation, 68 27
–44
(2006). 0300-9572 Google Scholar
|