|
|
1.IntroductionTumor oxygenation is a critical factor in determining the efficacy of radiation and chemotherapy in cancer. Hypoxia leads to genomic instability, and resistance to radiation, chemotherapy, and photodynamic therapy.1 It has also been recently demonstrated that intermittent hypoxia in particular can induce radiation resistance.2 The ability to monitor tumor oxygenation dynamically in vivo would thus be of tremendous importance in determining prognosis and potentially in guiding therapy in both preclinical and clinical studies. In vivo measurements of tissue oxygenation are most commonly performed using needle-based sensors, including polarographic electrodes, and fluorescence lifetime sensors, such as the OxyLite partial oxygen pressure system (Oxford Optronics, Wycombe, United Kingdom).3 These approaches are capable of providing accurate, absolute measurements of oxygen tension. However such devices have a number of limitations. They have a small sampling area on the order of (OxyLite) or (polarographic electrode).3 This can be an advantage if local information is desired, but it is difficult to generalize one or a few measurement points to a global picture of tumor physiology. These devices also require diffusion of oxygen into the sensor, which results in a stabilization period of around for the OxyLite sensor, which can cause difficulties when measuring dynamic changes in in a living subject, where fluctuating and motion artifacts could cause significant problems. The polarographic electrode consumes oxygen in order to measure it, which degrades sensitivity at low .4 The commercial system made for clinical use cannot be placed in a stationary position for this reason. Recessed tip probe designs minimize perturbation of the oxygen field and have rapid response times but are not commercially available.5 Optical spectroscopy presents an attractive means of noninvasively monitoring tissue oxygenation and metabolic parameters via diffuse reflectance and fluorescence spectroscopies. Diffuse reflectance spectra are acquired by illuminating the tissue and measuring the diffusely reflected light as a function of wavelength. This is affected by the absorption and scattering properties of the tissue (optical properties), whose dominant absorbers are typically oxygenated and deoxygenated hemoglobin. This measurement can thus give a measure of total blood volume and hemoglobin oxygen saturation. Fluorescence spectroscopy is sensitive to the intrinsic fluorescence properties of tissue associated predominantly with tryptophan, collagen, reduced nicotinamide adenine dinucleotide (NADH), and flavins; the latter two are electron carriers involved in cellular oxidative phosphorylation.6 A number of small animal tumor studies have been carried out to demonstrate that optical spectroscopy is capable of monitoring changes in tumor physiology in response to various perturbations to tumor oxygenation. Finlay and Foster7 demonstrated the use of diffuse reflectance spectroscopy for measuring hemoglobin saturation of murine tumors in response to carbogen and nitrogen breathing. They used a P3-diffusion approximation of light transport to extract optical properties from the diffuse reflectance spectra. In this study, the skin covering the tumor was surgically excised, and a fiber optic probe was placed in contact with the tumor. Diffuse reflectance measurements were used to monitor hemoglobin saturation in response to inhalation of hyperoxic and hypoxic gases. They showed that hemoglobin saturation changed as expected in response to these gases. Conover 8 compared hemoglobin saturation quantified from diffusion theory–based analysis of near infrared spectroscopy (NIRS) of a mouse tumor to cryospectrophotometry of tumor microvasculature. They found that the volume-averaged hemoglobin saturation was indicative of clinically relevant hypoxia, namely, when NIRS reported a hemoglobin saturation of 70% or more, less than 6% of the tumor volume was found to be below 10% saturation as imaged by cryospectrophotometry. Kim 9 investigated correlates between assessed by needle-based sensors and NIRS for carbogen inhalation, where they used a modified form of the Beer-Lambert law to derive relative changes in deoxyhemoglobin [Hb] and oxyhemoglobin from the NIRS data. They found that relative changes in correlated with tissue , although there was substantial interanimal heterogeneity.9 Xia 10 used the same technique to compare relative changes in the concentration of Hb and to magnetic resonance imaging oximetry with the FREEDOM (fluorocarbon relaxometry by echo-planar imaging for dynamic oxygen mapping) technique11 for hyperoxic gas inhalation. They were not able to apply the standard diffusion approximation to these data to extract absolute concentrations of Hb and , due to the small tumor size, but developed a technique by which they could estimate it in combination with the data. They found that changes in correlated with , and that the response time of was faster than that of . Finally, Liu 12 also investigated the use of NIRS to evaluate tumor vascular oxygenation and compared these to invasive measurements of for animals breathing hyperoxic gases. They found that increased in a biphasic manner during oxygenated gas inhalation. The needle sensor also followed in the same direction but had a slower response. This study seeks to build upon this previous work by systematically comparing hemoglobin saturation quantified via diffuse reflectance spectroscopy with tissue in a mouse tumor model. In addition, fluorescence redox ratios,13, 14 defined as fluorescence, which is reflective of cellular metabolism and oxygen consumption were quantified from fluorescence spectroscopy measurements. The relationship between the redox ratio and hemoglobin saturation were evaluated to determine if the results are consistent with expected trends. The diffuse reflectance and fluorescence spectra were evaluated using a scalable Monte Carlo model of reflectance and fluorescence, respectively. These models have been developed to extract the underlying absorption, scattering, and fluorescence properties from the measured diffuse reflectance and fluorescence spectra.15, 16 This allows the quantification of the underlying physiologic indicators, notably hemoglobin saturation, total hemoglobin concentration, as well as the contributions of NADH and flavin to tissue fluorescence. The latter allow calculation of the fluorescence redox ratio, which is indicative of the redox state of these electron carriers; in other words, as these compounds are oxidized, the redox ratio will increase, and as they are reduced, the redox ratio will decrease. These models have been validated using phantom studies, in which errors (under 10%) were reported for the extraction of absorption and scattering properties,15 as well as intrinsic fluorescence16 for a wide range of optical properties, representative of tissue in the UV-visible range. The unique features of these models include that they (1) are based on Monte Carlo modeling, and so are valid for a wide range of optical properties and small sampling volumes, and (2) are adaptable to a variety of fiber optic probe geometries or imaging modalities. In addition, the ability of this model to determine the hemoglobin saturation in phantoms has also been evaluated.17 Briefly, tissue simulating phantoms consisting of hemoglobin (absorber) and polystyrene spheres (scatterer) were characterized using diffuse reflectance spectroscopy with a fiber optic probe, similar to the one used in this study. The oxygen tension was varied using Baker’s yeast, and it was found that the hemoglobin saturation as a function of was retrieved to within for the whole range of saturations tested (0% to 100%). The goal of this study is to quantify and track changes in oxygenation in response to carbogen breathing in 4T1 breast tumors in nude mice using optical spectroscopy. Specifically, hemoglobin saturation and the optical redox ratio were measured and compared with oxygenation measures from a well-established method of measuring tumor , the OxyLite system. This enables future optical experiments to be put into context when comparing findings to previous studies using needle-based sensors. 2.MethodsMurine mammary carcinoma cells of the 4T1 cell line were injected into a set of 14 athymic NCr nu/nu mice (National Cancer Institute, FitzPatrick Cancer Center, Plattsburgh, New York). One million cells were injected into the flank of each mouse, and the tumors were allowed to grow until they reached a of diameter approximately (around ). Upon reaching this size, the mouse was anesthetized with pentobarbital and was placed on a warming blanket. The optical spectroscopy probe and OxyLite sensors were then positioned on the surface of the tumor, with the spectroscopy probe placed in contact with the surface of the skin overlaying the tumor, and two OxyLite sensors were inserted into the tumor on either side of the spectroscopy probe as shown in Fig. 1 . The optical spectroscopy probe was held in place using a clamp, and the OxyLite sensors were taped down during the experiment, while minimizing pressure on the tissue, which could reduce perfusion. A baseline reading was established for a period of at least to allow the OxyLite sensors to stabilize, and baseline spectroscopy measurements were then acquired. Then, the mouse was administered carbogen gas (95% , 5% ) at a rate of for the duration of the experiment. Diffuse reflectance measurements were then acquired every minute for the first , and every thereafter for up to or until the measurements stabilized. Fluorescence measurements were made at baseline and at the end of the experimental time period. At the end of the experiment, each mouse was sacrificed using an overdose of pentobarbital. Fig. 1Experimental setup used for these experiments. A single fiber optical probe was placed in contact with the skin overlaying the tumor, and two OxyLite sensors were placed on either side of it. 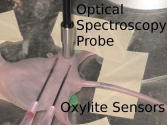 Optical spectroscopy measurements were made via a fiber optic probe coupled to a Skinskan (J.Y. Horiba, Edison, New Jersey) fluorometer, which have been described extensively in previous publications.15, 18 Briefly, the fiber optic probe consists of a central collection core of 31 fibers with a diameter of surrounded by an illumination ring, also with 31 fibers, having an outer diameter of (shown in Fig. 2 ). The Skinskan consists of a xenon arc lamp, double excitation/emission monochromators, and a photomultiplier tube (PMT) detector. Optical spectroscopy measurements were made by placing the fiber optic probe in direct contact with the tissue surface (no spacer was used). Two sets of optical measurements were made: (1) the diffuse reflectance spectra , and (2) the fluorescence emission spectra obtained at 350- and excitation, which excite NADH and flavin, respectively. Both were acquired with increments, with the PMT set to 950 or for the fluorescence and diffuse reflectance, respectively. Integration time of was used for the diffuse reflectance, and was used for the fluorescence measurements. Calibration was carried out daily by normalizing the diffuse reflectance data wavelength by wavelength to a reflectance puck measurement (Labsphere, Inc., North Sutton, New Hampshire) made with the probe in flush contact. The fluorescence was calibrated to a rhodamine standard, measured in a quartz cuvette. The dark current of the PMT was subtracted from all measurements, and the background signal measured in water was found to be negligible. Fig. 2Probe geometry used in this study, showing the arrangement of illumination and collection fibers. 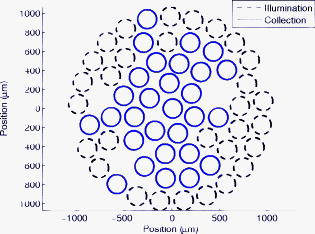 Concurrent with optical measurements, tissue was determined using the OxyLite sensor. This system consists of a needle-based sensor consisting of a platinum-based fluorophore enclosed in a silicone matrix. This fluorophore is quenched by oxygen, and the resulting change in lifetime is used to quantify . This sensor was inserted into the superficial region of the tumor at a depth of approximately , to correspond roughly to the sensing depth of the optical spectroscopy measurement. The diffuse reflectance data were then processed using a Monte Carlo–based model of diffuse reflectance to extract the physiological information related to absorption and scattering properties of the tissue.15 Briefly, the model works by constraining the absorption and scattering to specific known absorbers and scatterers in the tissue. The absorption and reduced scattering coefficients can then be calculated based on the spectral properties of the absorbers and scatterers. The optical properties are then input into a Monte Carlo model of diffuse reflectance to determine what the collected diffuse reflectance would be given those optical properties for the specific measurement geometry employed. A nonlinear least squares algorithm is then used to minimize the difference between measured and simulated diffuse reflectance spectra, and the resulting absorber and scatterer properties are returned as the output of the algorithm. In this case, three absorbers were used: and Hb and a baseline absorption spectrum, corresponding to the absorption of skin in the absence of blood and melanin.19 Scattering was approximated using Mie theory, using a single size scatterer having a range of sizes between 0.35 and , which has previously been shown to closely approximate the scattering properties of a distribution of scatterer sizes expected in biological samples.15 Hemoglobin saturation was then used to quantify the tissue oxygenation. To maximize the sampling depth of the method, and minimize any influence of skin on these measurements, diffuse reflectance fits were performed over the range of to extract the absorption properties. This has been found to correspond to a range of optical properties for which effects of skin are negligible on the diffuse reflectance measurement.20 For fluorescence data, the full range of was used to enable characterization of optical properties at the excitation and emission wavelengths of the fluorescence spectra acquired. This leads to a reduced penetration depth at the shorter wavelengths. The possible influence of skin on these measurements is discussed in detail in Sec. 4 The fluorescence data were processed using another Monte Carlo–based model of fluorescence to separate the effects of absorption and scattering from the measured fluorescence spectra.16 Briefly, this algorithm uses Monte Carlo simulations, incorporating the excitation wavelength optical properties, to model the path light takes from the light source to the fluorophore. The intrinsic fluorescence properties then determine how much of this light will be converted to fluorescence. Finally, another Monte Carlo simulation, incorporating the emission wavelength optical properties, determines how much of this generated fluorescence returns to the tissue surface to be collected by the optical probe. Using a process described in detail elsewhere,16 it is possible to separate the intrinsic fluorescence properties from the simulated effects of absorption and scattering, to yield a quantity that is proportional to the product where is the extinction coefficient of the fluorophore at the excitation wavelength, is its concentration, is its quantum yield, and is the emission probability for the fluorophore at the collected emission wavelength. The redox ratio was than taken as the average of , , and . is the intrinsic fluorescence emission at excitation, emission, which corresponds to the flavin fluorescence emission maxima, and corresponds to the NADH emission maxima, emission. These values were averaged from three independent data points to minimize measurement noise and to enable calculation of standard deviations. This overestimates the measurement errors because the fluorescence emission is not quite flat over these ranges, but this provides upper bounds on these errors. Wilcoxon signed rank (paired) and rank sum (unpaired) tests were used to test for statistical significance for all end points.3.ResultsFigure 3 shows representative fits from a single mouse at (a) baseline and (b) after carbogen breathing. It can be seen that the alpha and beta bands of hemoglobin absorption at around 540 and appear more distinct in Fig. 3b, which is indicative of greater oxygenation. This corresponds to an increase in saturation from approximately 28% to 57%, as retrieved from the diffuse reflectance model. It can be seen that the fit provides a good approximation of the measured diffuse reflectance. Fig. 3Representative diffuse reflectance fits at (a) baseline and (b) after carbogen breathing. A single absorption minimum seen at around in (a) is indicative of Hb, while dual absorption minima seen at around 540 and in (b) are indicative of . 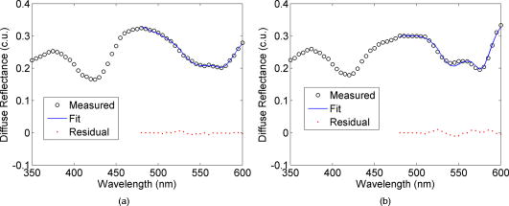 Figure 4 shows the raw and intrinsic fluorescence spectra for (a) NADH and (b) flavin fluorescence. Each raw or intrinsic spectrum is normalized to the mean value obtained over the entire spectrum for the raw or intrinsic baseline scan, respectively, in order to put the data on the same scale. It can be seen that the intrinsic fluorescence corrects for absorption by hemoglobin apparent in the raw NADH spectra at around emission. Also, the magnitude of the flavin fluorescence is significantly altered upon correction for absorption and scattering, highlighting the importance of correcting for these effects. Fig. 4Raw and extracted intrinsic fluorescence spectra showing the (a) and (b) emission spectra. Significant deviations in line shape due to absorption can be seen to be corrected for particularly for the emission spectrum around the vicinity of the Soret band of hemoglobin absorption . Spectra are normalized to their mean value. 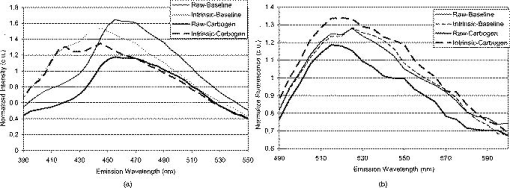 Figure 5 shows the tissue obtained from each of the OxyLite probes and hemoglobin saturation for a representative animal, with carbogen breathing beginning at and continuing for the duration of the experiment. It can be seen that the hemoglobin saturation shows a more rapid response to the administration of carbogen at , which was found to be typical of other mice as well. One OxyLite probe (top panel) showed no change in upon administration of carbogen, which was a common occurrence. Another interesting time course, which demonstrates measurement of fluctuant hypoxia, is shown in Fig. 6, where it can be seen that both the hemoglobin saturation and show similar fluctuations, with changes in hemoglobin saturation again preceding those of the OxyLite probe (most closely tracking probe 1). Fig. 5Representative time course data for showing for each of the two OxyLite probes (top two panels) and the hemoglobin saturation. The animal was provided carbogen continuously after , as indicated by the dashed line. Hemoglobin saturation and for one of the OxyLite probes (middle panel) can be seen to increase with carbogen breathing. The other OxyLite probe shows no change upon carbogen breathing. This corresponds to mouse 8. 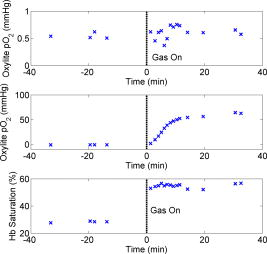 Fig. 6Time course demonstrating the measurement of fluctuant hypoxia for the two OxyLite probes (top two panels) as well as hemoglobin saturation. This corresponds to mouse 7. 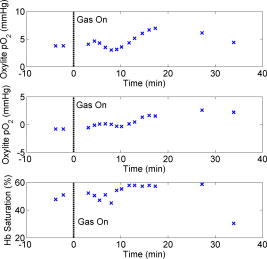 Figure 7 shows baseline and stabilized carbogen breathing measurements. All measurements were generally stabilized after of carbogen breathing, so measurements were averaged after this time point to produce the carbogen-breathing data points. Error bars show the standard deviation from these repeated measurements (typically at least five measurements), except for the case of the redox ratio, which shows the mean and standard deviation over a specific wavelength range (see Sec. 2). For the set of 14 animals, a significant increase was seen in for the paired test only, using readings averaged for two probes, increasing from Hg to (paired: , unpaired: ). Significant increases in hemoglobin saturation were also seen, with saturation increasing from a baseline value of to upon carbogen breathing (paired: unpaired: ). Hemoglobin concentration also increased significantly upon carbogen breathing using a paired test . Figure 7d shows the fluorescence redox ratio before (black) and after (white) carbogen administration, obtained for a subset of the animals in this study. In the presence of oxygen, the redox ratio would be expected to increase,13 as is shown for eight of the nine cases. For the case where the redox ratio did not increase, it is interesting to note that the hemoglobin saturation also showed only a small change upon carbogen administration (mouse 5), so the data are consistent using two independent measures of tumor physiology. A paired signed rank test indicates that there is a significant increase in redox ratio upon administration of carbogen . Fig. 7The (a) hemoglobin saturation, (b) total hemoglobin, (c) reported by the OxyLite system, and (d) redox ratio data for each of the mice in this study. The data were averaged for the baseline (black) and carbogen-breathing (white) levels. In panel (c), data from both sets of OxyLite probes are shown, when available. For mice 1 to 3 only a single OxyLite probe was used; for mice 11, 13, and 14, two probes were used, but one reported an error code during the experiment. The remaining mice have two OxyLite readings reported both before and after carbogen breathing. Error bars show standard deviations obtained from repeated measurements. 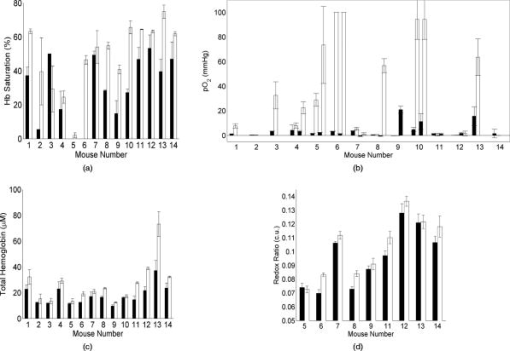 Finally, the dynamics by which the hemoglobin saturation and redox ratio change upon perturbation were investigated and are shown in Fig. 8 . For the final 4 animals (animals 15 to 18), the redox ratio was measured more frequently (4 to 5 times). For these animals, the Spearman rank correlation with hemoglobin saturation measured at the same time was calculated for each animal. This yielded a correlation coefficient of , for the four animals, indicating that the dynamics of the change in these parameters are similar for each of these measurements. However, when these measurements are pooled for this subset of animals, the correlation coefficient is only 0.5, indicating that the redox ratio is influenced by other factors than just tissue oxygenation. In other words, there is interanimal variability related to other factors than blood oxygenation that confound the correlation between fluorescence redox and hemoglobin saturation. In Fig. 8, it can be seen that for individual animals, there is a strong linear correlation, but that there is significantly more scatter when all observations are pooled. Fig. 8A scatter plot of hemoglobin saturation and fluorescence redox ratio for the final four animals in this study for which more detailed measurement of fluorescence redox ratio was obtained. It can be seen that individual animals show strong linear correlations (average correlation of 0.9), but that the overall correlation is less strong, yielding an overall correlation coefficient of 0.5. 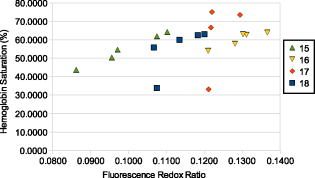 4.DiscussionThe results presented here demonstrate that optical spectroscopy is capable of providing highly reliable information regarding tissue physiology. In fact, it compared favorably with an established approach—that of the OxyLite sensor—that has been used previously to monitor tumor physiology in a number of preclinical and clinical studies (e.g., Ref. 21, 22). A key limitation of the OxyLite sensor is its small sampling region, which makes it highly sensitive to positioning, and for cases where the OxyLite is positioned in a poorly perfused or necrotic microenvironment, it accurately reports close to 0 throughout the experiment, as can be seen in around half of the cases [Fig. 7a]. In fact, the two OxyLite sensors frequently reported that differed from one another by a factor of 2 or more, highlighting the difficulty of using a few needle-based sensors such as these as an indicator of global tumor oxygenation due to the high degree of heterogeneity within a tumor. This sensitivity to positioning would make longitudinal studies of tumor oxygenation difficult using needle-based sensors. The optical measurement of hemoglobin saturation, however, showed more consistent results across all animals [see Fig. 7b]. Fluorescence redox ratio also showed consistent relative changes upon administration of carbogen. An advantage of using this metric is that it is indicative of changes in metabolic activity caused by factors other than tissue oxygenation, such as metabolite availability and mitochondrial membrane potential, thus providing complementary information. It was found that the dynamic changes in the redox ratio were consistent with that of hemoglobin saturation , which is indicative of the fact that each of these parameters is responding to the same perturbation in this experiment. However, the interanimal variability in the tumor microenvironment may lead to differences in substrate availability or hypoxic preconditioning that may influence metabolic activity. This is reflected by the fact that interanimal correlation of hemoglobin saturation and redox ratio was low (0.5). Such measurements could be useful in preclinical and clinical studies examining the effects of a therapy, where longitudinal measurements could allow comparison before and after treatment. The saturation values are rather higher than would be expected given the values reported by the needle electrodes. This is likely due to the fact that hemoglobin saturation is representative of blood oxygenation levels, while the needle electrodes are reflective of tissue . Thus the needle electrodes would be more likely to be located distal to a blood vessel where is lower. Another potential source of discrepancy is that the needle electrode may in some cases be located deeper than the optical sampling depth, which would make it more likely to sample hypoxic/necrotic regions. One potential concern is the ability of the optical probe to sample the tumor through the skin. The reflectance fits were restricted to wavelengths longer than in extracting the absorption properties in order to maximize probing depth, because absorption in tissue is lower at longer wavelengths. This removes the Soret band, but there is still much structure in the range (alpha and beta bands) to distinguish and Hb. Phantoms studies using hemoglobin have shown that the accuracy with which the hemoglobin concentration can be extracted is not diminished using a more limited wavelength range.15 Shorter wavelengths had to be used, however, to characterize the fluorescence properties of tissue (in this case, fits were performed over ). This has some impact on interpretation of the hemoglobin saturation and redox ratio data, because the hemoglobin saturation reported will tend to reflect a deeper sensing volume, where the tissue is likely to be more hypoxic. Monte Carlo simulations of fluorescence indicate that the median probing depth (i.e., median depth of origination for collected fluorescence), ranges from for the range of optical properties representative of those encountered in this study, as determined by the reflectance fits. The outer diameter of this probe is approximately , which gives a probing volume on the order of . Typical thickness of skin in these mice is based on histological sections, with the tumors grown subcutaneously (they were directly beneath the skin). This would suggest that effects of the skin on the measurement could be significant (particularly for high absorption and low scattering). We are currently developing on an optimized probe geometry with a larger source-detector separation, which will minimize any such artifact. Another related concern is the use of a homogeneous model, when skin and tumor layers are likely to have different optical properties. A two-layer model could be employed in the future, but this would significantly complicate the modeling, and would likely require a more complex measurement geometry to enable the effective separation of the optical properties of two layers: using multiple source detector separations, or angularly resolved measurements, for example.23 In addition, there is heterogeneity within each tissue type, with hemoglobin not being distributed homogeneously, and variations in tissue scattering and absorption throughout the tissue volume due to morphological/physiological differences throughout the tumor. In the simplified homogeneous case, extracted optical properties represent some composite average of the two layers, and the best approach may be to design a probe that maximizes sampling volume, thus weighting this average more toward the deeper tumor tissue. Finally, the temporal kinetics of these measurements indicate that changes in hemoglobin saturation precede that of tissue , as assessed by the OxyLite probe, as has been previously reported.12 Part of this discrepancy could be attributed to the longer response time of the OxyLite sensor to changes in oxygenation ( stabilization time), but this response could also be due in part to the time for oxygen to diffuse into tissue. Our primary goal in this work is to use optical spectroscopy to monitor changes in response to traditional therapies, such as chemotherapy and radiation, which would be expected to occur over relatively long time frames, but in investigations looking at fast dynamic changes in oxygenation, this could be a potential source of error that would require further investigation. In conclusion, it has been demonstrated that optical spectroscopy can successfully monitor changes in tissue oxygenation in response to a perturbation. Future work will incorporate such measurements into preclinical and clinical studies examining the effects of antiangiogenic therapy, chemotherapy, and radiation therapy upon tumor physiology, both as an indicator of therapeutic efficacy, and ultimately as a means of guiding therapy toward the most efficacious treatment regimen. AcknowledgmentsThis work was funded was provided by the National Institutes of Health through grants 1R01CA100559-01A1 and R01CA40355, and Department of Defense Era of Hope Postdoctoral Fellowship W81XWH-07-1-0355, and Era of Hope Scholar Award W81XWH-05-1-0363. We would also like to acknowledge James Provenzale, MD, for helpful discussions. ReferencesP. Vaupel and L. Harrison,
“Tumor hypoxia: causative factors, compensatory mechanisms, and cellular response,”
Oncologist, 9
(Suppl 5), 4
–9
(2004). 1083-7159 Google Scholar
P. Martinive,
“Preconditioning of the tumor vasculature and tumor cells by intermittent hypoxia: implications for anticancer therapies,”
Cancer Res., 66
(24), 11736
–11744
(2006). https://doi.org/10.1158/0008-5472.CAN-06-2056 0008-5472 Google Scholar
R. D. Braun,
“Comparison of tumor and normal tissue oxygen tension measurements using OxyLite or microelectrodes in rodents,”
Am. J. Physiol. Heart Circ. Physiol., 280
(6), H2533
–H2544
(2001). 0363-6135 Google Scholar
G. Schneiderman and T. K. Goldstick,
“Oxygen fields induced by recessed and needle oxygen microelectrodes in homogeneous media,”
Adv. Exp. Med. Biol., 75 9
–16
(1976). 0065-2598 Google Scholar
G. Schneiderman and T. K. Goldstick,
“Oxygen electrode design criteria and performance characteristics: recessed cathode,”
J. Appl. Physiol., 45
(1), 145
–154
(1978). 0021-8987 Google Scholar
N. Ramanujam,
“Fluorescence spectroscopy in vivo,”
Encyclopedia of Analytical Chemistry, 20
–56 John Wiley and Sons, Ltd., New York
(2000). Google Scholar
J. C. Finlay and T. H. Foster,
“Hemoglobin oxygen saturations in phantoms and in vivo from measurements of steady-state diffuse reflectance at a single, short source-detector separation,”
Med. Phys., 31
(7), 1949
–1959
(2004). https://doi.org/10.1118/1.1760188 0094-2405 Google Scholar
D. L. Conover,
“An evaluation of near infrared spectroscopy and cryospectrophotometry estimates of haemoglobin oxygen saturation in a rodent mammary tumour model,”
Phys. Med. Biol., 45
(9), 2685
–2700
(2000). https://doi.org/10.1088/0031-9155/45/9/318 0031-9155 Google Scholar
J. G. Kim,
“Interplay of tumor vascular oxygenation and tumor pO2 observed using near-infrared spectroscopy, an oxygen needle electrode, and 19F MR pO2 mapping,”
J. Biomed. Opt., 8
(1), 53
–62
(2003). https://doi.org/10.1117/1.1527049 1083-3668 Google Scholar
M. Xia,
“Tumour oxygen dynamics measured simultaneously by near-infrared spectroscopy and 19F magnetic resonance imaging in rats,”
Phys. Med. Biol., 51
(1), 45
–60
(2006). https://doi.org/10.1088/0031-9155/51/1/004 0031-9155 Google Scholar
S. Hunjan,
“Tumor oximetry: demonstration of an enhanced dynamic mapping procedure using fluorine-19 echo planar magnetic resonance imaging in the Dunning prostate R3327-AT1 rat tumor,”
Int. J. Radiat. Oncol., Biol., Phys., 49
(4), 1097
–108
(2001). https://doi.org/10.1016/S0360-3016(00)01460-7 0360-3016 Google Scholar
H. Liu,
“Near-infrared spectroscopy and imaging of tumor vascular oxygenation,”
Methods Enzymol., 386 349
–378
(2004). 0076-6879 Google Scholar
B. Chance,
“Oxidation-reduction ratio studies of mitochondria in freeze-trapped samples. NADH and flavoprotein fluorescence signals,”
J. Biol. Chem., 254
(11), 4764
–4771
(1979). 0021-9258 Google Scholar
B. Chance,
“Mitochondrial NADH as the bellwether of tissue O2 delivery,”
Adv. Exp. Med. Biol., 566 231
–242
(2005). 0065-2598 Google Scholar
G. M. Palmer and N. Ramanujam,
“Monte Carlo-based inverse model for calculating tissue optical properties. Part I: Theory and validation on synthetic phantoms,”
Appl. Opt., 45
(5), 1062
–1071
(2006). https://doi.org/10.1364/AO.45.001062 0003-6935 Google Scholar
G. M. Palmer and N. Ramanujam,
“Monte-Carlo-based model for the extraction of intrinsic fluorescence from turbid media,”
J. Biomed. Opt., 13
(2), 024017
(2008). https://doi.org/10.1117/1.2907161 1083-3668 Google Scholar
J. E. Bender,
“A robust Monte Carlo model for the extraction of biological absorption and scattering in vivo,”
IEEE Trans. BME, Google Scholar
G. M. Palmer,
“Monte Carlo-based inverse model for calculating tissue optical properties. Part II: Application to breast cancer diagnosis,”
Appl. Opt., 45
(5), 1072
–1078
(2006). https://doi.org/10.1364/AO.45.001072 0003-6935 Google Scholar
R. Huang and S. Jacques,
“Skin Optics Summary,”
(2006) http://omlc.ogi.edu/news/jan98/skinoptics.html Google Scholar
Unpublished data. Google Scholar
K. G. Brurberg,
“Fluctuations in pO2 in irradiated human melanoma xenografts,”
Radiat. Res., 165
(1), 16
–25
(2006). 0033-7587 Google Scholar
K. L. Blackwell,
“Human recombinant erythropoietin significantly improves tumor oxygenation independent of its effects on hemoglobin,”
Cancer Res., 63
(19), 6162
–6165
(2003). 0008-5472 Google Scholar
Q. Liu, and N. Ramanujam,
“Experimental proof of the feasibility of using an angled fiber-optic probe for depth-sensitive fluorescence spectroscopy of turbid media,”
Opt. Lett., 29
(17), 2034
–2036
(2004). https://doi.org/10.1364/OL.29.002034 0146-9592 Google Scholar
|

