|
|
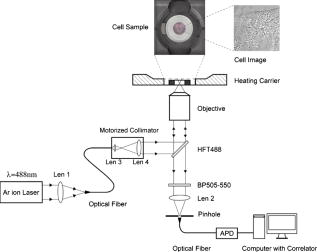
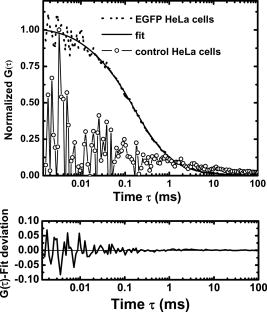
1.IntroductionNucleoplasmic rheology has become a subject of growing interest in the field of nanomedicine, which applies nanoscale devices to repairing genetic defects, delivering therapeutic agents, detecting viruses, and killing cancer cells at the molecular level.1, 2 Designing these nanoscale devices is commonly based on biomolecules such as DNA, RNA polymerase, and DNA helicase in the nucleoplasm.3, 4 Knowledge of nucleoplasmic rheology can help clarify the dynamics of intranuclear molecules, thereby advancing nanomedicine. This study focuses on nucleoplasmic viscosity, one of the important parameters that quantify rheological characteristics in the nucleus. Nucleoplasmic viscosity produces friction forces that must be overcome by intranuclear molecules. Its effect on the motion of molecules should be taken into account especially when designing motors for nanorobots.5 Several traditional methods exist for the measurement of nucleoplasmic viscosity.6, 7, 8, 9 However, they have limitations such as photodamage of living cells, relatively low resolution, and strict requirements. Invasion is a serious problem in living cell measurement, since it can lead to a deviation from normal levels of nucleoplasmic viscosity. Thus, there remains a need for reliable and noninvasive techniques to measure nucleoplasmic viscosity in living cells. Fluorescence correlation spectroscopy (FCS) is particularly attractive for this application. First introduced by Magde, FCS is a single-molecule technique that has been widely used in biological research and nanoscale science.10, 11, 12, 13, 14, 15, 16 Through a time correlation analysis of spontaneous intensity fluctuations, this technique with enhanced green fluorescence protein (EGFP) as a probe is capable of determining fluid viscosity according to the Stokes-Einstein equation.17 FCS has several advantages over traditional methods. The most attractive advantage is its noninvasive nature. Low laser intensity does not lead to significant photobleaching in FCS.18 Other methods, such as fluorescence recovery after photobleaching (FRAP), require high laser intensity (up to ), which produces free radicals and photodamage to living cells.19 A second advantage of FCS is its high temporal resolution; it is capable of monitoring very fast processes on the nanosecond scale compared with FRAP, which operates on the millisecond scale. A third advantage of FCS is its relative convenience of measurement; it works even on the nanomolar scale, about 5% of that in FRAP measurement. In addition, fluorescence anisotropy (FA) measurement is limited to fluorescent objects with excited-state lifetimes comparable to their rotational correlation time, whereas FCS has no such requirement.12 In summary, FCS is a noninvasive tool of high temporal resolution for convenient measurements in living cells. Previous investigations have focused on nucleoplasmic viscosity of asynchronized cells. It is uncertain whether there are differences in nucleoplasmic viscosity among the G1, S, and G2 phases. This is an important issue because it relates to molecular mechanisms during the cell cycle. In this study, we examined the use of FCS with EGFP as a probe to determine the nucleoplasmic viscosity of living cells. Moreover, we investigated the nucleoplasmic viscosity of cells synchronized in the G1, S, and G2 phases. We verified the qualitative relationship of the nucleoplasmic viscosity and cytoplasmic viscosity in both HeLa and ASTC-a-1 cells, which should be beneficial to the dynamic analysis of nucleocytoplasmic transport. 2.Materials and Methods2.1.Cell Culture, Transient Expressions and SynchronizationHuman epithelial carcinoma cells (HeLa) and human lung adenocarcinoma cells (ASTC-a-1) were cultured at in Dulbecco’s modified Eagle’s medium (DMEM, Invitrogen Company, Carlsbad, California) supplemented with 10% fetal calf serum and antibiotics. Cells were seeded into a coverslip-bottomed small chamber before all measurements. Transfections of HeLa and ASTC-a-1 cells were carried out by Lipofectamine2000 reagent (Invitrogen Company, Carlsbad, California) with EGFP plasmid (Clontech, Heidelberg, Germany) according to the manufacturer’s instructions. The following procedures were used to arrest HeLa cells at specific stages of the cell cycle. Cells enriched in G1 were obtained by treatment with mimosine (Sigma, St. Louis, Missouri Ohio) at for (Refs. 20, 21). HeLa cells were treated with thymidine (Amresco, Solon, Ohio) for , thymidine-free media for , and additionally with thymidine for to arrest the cell cycle at the G1/S boundary.22, 23 Then cells were washed twice with PBS and released into the S phase by incubation in fresh normal media again for , during which the measurement was performed. Cultures with a high percentage of cells in the G2 phase (95%) were obtained by incubating monolayer cultures at the S phase with colchicine between 6 and after removing the second thymidine block.24 Ultrapure water ( , ELGA, High Wycombe, Bucks, England) was added into PBS to achieve hypoosmotic testing solutions. Cells were exposed to osmotic challenge for before testing. 2.2.Preparations for Aqueous Solution with EGFPEGFP-expressing and nontransfected cells grown in culture flasks were washed three times with ice-cold PBS, added to ice-cold buffer ( TrisHCl pH 8.0, NaCl, 1% Triton X-100, PMSF), and then shaken on ice for . Cells swollen in this buffer were recover into a Eppendorf tube and then centrifuged for at . Before measurements, the sample was diluted to with ultra-pure water ( , ELGA, High Wycombe, Bucks, England), and EGFP in aqueous solution was obtained. Glycerin was added into the EGFP aqueous solution to obtain different viscosities: 0.6, 0.7, 1.0, 1.9, 2.9, and . The pH value of the solution was adjusted to . 2.3.Instrumentation and MeasurementLiving cell images were acquired by a confocal laser scanning microscope (LSM 510/ConfoCor 2) combination system (Zeiss, Jena, Germany) equipped with a water objective (C-Apochromat corr.). EGFP (the quantum yield is 0.60 and the peak wavelengths of excitation and emission spectrum are and , respectively25) was excited at with an argon-ion laser, and its fluorescence emission was recorded through a IR bandpass filter. FCS measurements were performed on a ConfoCor2 fluorescence correlation spectrometer (Carl Zeiss, Jena, Germany), which has been described previously.26, 27 The optical path is shown schematically in Fig. 1 . Samples were placed on the stage of the inverted microscope. In our experiments, the line from an argon-ion laser was used to excite Rhodamine 6G dye or EGFP. The excitation light was reflected by the main dichroic beamsplitter (HFT488) and focused on the focal plane within the sample by an objective (C-Apochromat corr.). The emitted fluorescence via the objective was transmitted through the splitter HFT488. Residual laser excitation light and Raman scattered light were removed by an additional bandpass filter (BP505-550), and photon counts were focused on actively quenched avalanche photodiodes (APD, EG&G, Norfolk County, Massachusetts). A computer station was used to control the instrument and calculate the autocorrelation data of the photoelectron pulses. The Rhodamine 6G–water solution was measured at room temperature for calibration. In addition, the EGFP aqueous solution and cell samples were placed in the heating carrier of the microscope (CTI-Controller 3700, Carl Zeiss, Germany), which controls the temperature and provides an environment of saturated humidity and 5% . Aqueous solution measurements were conducted at and living cell measurements at . All FCS measurements in living cells were performed after LSM images of a cell were taken, following the protocol as described previously.28 The position of the LSM images was determined by adjusting the focusing drive of the microscope when the cross section of the scanned fluorescent cell became the largest. Three types of images were obtained at the same time: fluorescent image, bright-field image, and merged image. Positions in the nucleoplasm were chosen in these LSM images of a cell. Particularly in weakly fluorescent cells, bright-field and merged images made it easy to discriminate the nucleolus from the nucleoplasm and to choose the positions in the nucleoplasm. In order to keep the same height of focus above the coverslip, different positions of a cell were chosen at the same position, and cells with similar size were chosen in the comparative measurements. In order to avoid photodamaging the cells, the laser intensity from the objective varied from during measurements. Autocorrelation curves from the solution were averaged for five successive -long measurements, and those from living cells were averaged for five successive -long measurements. To minimize the cell-to-cell variability and to provide valid statistical analysis, we measured sufficient number of cells (more then 40 cells for each phase of cell cycle) grown in different dishes on different days. 2.4.FCS AnalysisIn an FCS measurement, of the fluorescence around the average due to any dynamic process can be characterized by a normalized autocorrelation function (ACF): The following fitting formula is the standard expression for the 3-D two-component diffusion model:where denotes the triplet fraction of fluorescent dyes or the average fraction of molecules in the nonfluorescent state,29 is the relaxation time of the respective preceeding fraction, refers to the characteristic diffusion time during which the ’th species molecule stays in the excitation volume with an axial to lateral dimension ratio (namely, the structure parameter ), is the mean number of molecules in the excitation volume, and is the fraction of the second species. Equation 2 becomes a one-component diffusion model as . The relationship between the diffusion coefficient and the lateral dimension can be described as;30 and are determined by fitting the diffusion of free Rhodamine 6G to Eq. 2 with . Assuming that the diffusion coefficient for Rhodamine 6G in water is at (Refs. 31, 32, 33), was obtained in our calibration measurement as .The viscosity of fluids can be calculated according to the Stokes-Einstein equation: where is the Boltzmann constant, is the absolute temperature, is the solvent viscosity, is the hydrodynamic radius of the molecule, is the molecular weight, is the Avogadro constant, and is the mean density of the molecule.Molecular weight and mean density for EGFP are and , respectively,34 and hydrodynamic radius is acquired according to Eq. 5. As a result, the viscosity of fluids can be obtained using the diffusion time of EGFP by FCS and by Eq. 3 and Eq. 4. The influence of EGFP protonation had been taken into account when using Eq. 2, the correction part of which, , describes the influence of protonation below pH 8.0 as pointed out by the authors of the previous study.29 3.Results3.1.FCS Analysis of EGFP Diffusion in Aqueous SolutionThe first step undertaken in this study was the analysis of the EGFP diffusion in aqueous solution with various viscosities using FCS. This investigation helps to establish the practical use of FCS in measuring nucleoplasmic viscosity. Figure 2a shows the normalized autocorrelation curves of EGFP-expressing cells in an aqueous solution and nontransfected cells as control at . The former fits well to the one-component diffusion model by Eq. 2, while the latter does not show any correlation to autofluorescence. This finding indicates that the EGFP gene is normally expressed in the cell. We found that the diffusion coefficient of EGFP in aqueous solution was at with a relative standard deviation (RSD) of about 3.5%. Previous study using FRAP showed that the value of EGFP in PBS solution is at room temperature with an RSD of about 13% (Ref. 35), and it can be calculated as at in terms of the classical Stokes-Einstein relation [Eq. 4]. Therefore, the smaller RSD value of our result indicates the stability of this method. In addition, the deviation of the mean in our measurements from the previous value likely results from different sample compositions due to different methods of solution preparation. Fig. 2FCS measurements of EGFP diffusion in aqueous solution. (a) Normalized autocorrelation curves of EGFP-expressing cells and of nontransfected cells in aqueous solution. The autocorrelation curve (●) of EGFP solution fits well to the one-component model (—○–). The autocorrelation curve (—○—) of the solution of nontransfected cells does not show any correlation. (b) Normalized autocorrelation curves of EGFP-glycerin solution with various viscosities: 0.6 (—◼—), 0.7 (—○—), 1.0 (—▲—), 1.9 (—△—), 2.9 (—★—), and (—◻—) at . (c) The diffusion coefficient for EGFP in glycerin solutions of different viscosities at . The line (—) shows that the experimental data fit well to a linear function with , compared with the theoretical equation (---) at . 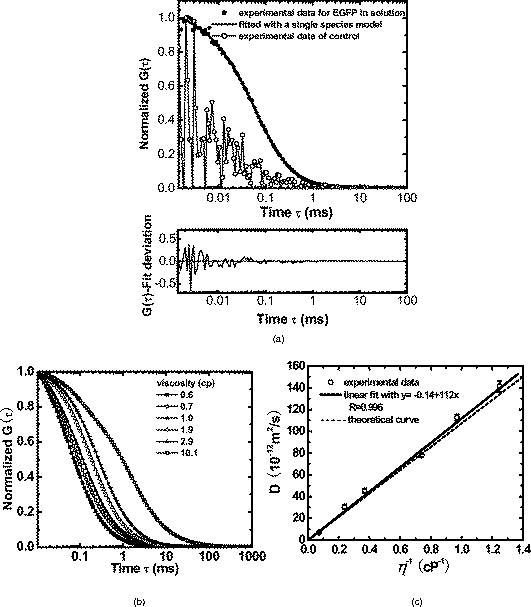 According to Eq. 4, the value of EGFP is linearly proportional to the reciprocal of viscosity at the same temperature ( at ). Therefore, the value of EGFP in glycerin solution with various viscosities was measured at to determine whether our measurement was consistent with the principle discussed earlier. Figure 2b presents the normalized autocorrelation curves of EGFP in glycerin solution. is plotted as a function of , and the experimental data fit the linear function , as shown in Fig. 2c. There is a minor deviation in slope from the expected result of . This discrepancy may be due to the fact that EGFP is not an ideal sphere with a fixed radius, whereas the EGFP protein is often considered to be an ideal sphere for model simplification.28 The values and corresponding RSD of EGFP in glycerin solution with different viscosities are summarized in Table 1 . The results show that a smaller diffusion coefficient of detected molecules corresponds to a larger RSD, which is consistent with Koppel’s theory.36 Taken together, the analysis of EGFP mobility in aqueous solution indicates that FCS is able to determine fluid viscosity. Table 1Diffusion coefficients of EGFP in glycerin solution of different viscosities and the corresponding RSDs (T=30°C) . Data are mean±S.D.
3.2.Nucleoplasmic Viscosity of Living Interphase Cells3.2.1.FCS analysis of nucleoplasmic viscosity of living HeLa and ASTC-a-1 cellsPrevious studies have suggested that small molecules can diffuse freely and rapidly in the nucleoplasm.28, 37, 38, 39 Seksek found that the diffusion coefficient of small molecules in cells relative to that in water was independent of their size.37 Pack also found no significant difference by FCS for of ( to : different levels of oligomeric EGFP with molecular weights of 60, 90, 120, and , respectively).28 These results show that molecules with a molecular mass can diffuse freely in the nucleoplasm. EGFP is a -protein without specific biological function in living cells. Moreover, Guigas recently have reported that GFP showed normal diffusion in nucleoplasm and cytoplasm because the anomality of GFP was found to be about 1 in the two compartments using the anomalous diffusion model.40 Therefore, we used EGFP as a probe and applied the free diffusion model in FCS analysis of nucleoplasmic viscosity. Weakly fluorescent cells were selected in order to satisfy the requirement of nanomolar concentration in FCS measurement. of each cell was the average of data from several randomly selected positions in the nucleus. In our experiments, most of the autocorrelation curves from EGFP-expressing cells fit well to the one-component diffusion model, while autofluorescence from nontransfected cells did not show any correlation, as shown in Fig. 3 . This result further suggests that the transport of EGFP is purely Brownian in the nucleus, as is expected.41, 42 In a few of our experiments, the two-component model provided better fits to the autocorrelation function, as reported by some previous studies.28 These findings indicate that the nucleus contains regions where EGFP molecules diffuse with different mobilities. This is because there are some subcellular organelles such as nucleoskeleton or some fixed nuclear compartments,28, 38, 43 which trap some EGFP molecules and make them stay longer in the excited volume.44 Only the fast fraction of EGFP molecules that are not trapped by subcellular organelles can freely diffuse in nucleoplasm. In the case of the two-component model, we chose the diffusion time only from the fast fraction to calculate . of HeLa and ASTC-a-1 cells were determined to be and , respectively, about three to four times as viscous as water at . This result is consistent with previous studies using traditional methods.7, 28, 37 Photoactivation analysis also suggested that the apparent nucleoplasmic viscosity of normal rat kidney cells was about 3.1 times higher than water viscosity at (Ref. 7). In addition, we found that in the two-component model, the average over fast and slow fractions of HeLa cells was , higher than Braga’s FRAP result of (Ref. 45). The reason is possibly that FRAP provides the averaged diffusion coefficient of EGFP, with fast and slow rates diffusing from the outside to the inside of the excited volume. Our results further indicate that the free diffusion model is suited for the FCS analysis of nucleoplasmic viscosity and that FCS measurement is reliable. 3.2.2.Nucleoplasmic viscosity of living cells in different physiological conditionsTo determine whether FCS could be used to detect differences in intracellular fluid viscosity, we measured of living cells under different physiological conditions (Fig. 4 ). Figure 4a displayed the representative autocorrelation curves of a cell at and warmed to (outset) and of cells exposed to hypotonic media versus normal media (inset). The correlation function obtained at showed a broad distribution, and the correlation function obtained in hypotonic media covered a shorter lag time when compared with their respective control groups. Quantitative analysis showed that was reduced by 31 to 36% when cells were exposed to hypotonic media (HeLa: ; ASTC-a-1: ) and increased by 28 to 52% when cells were cooled from [Fig. 4b]. The Student’s -test using SPSS version 13.0 software also suggested that the of cells in different media was significantly different from that in normal media at . These results agree with previous findings.6, 9 Lang found that the nucleoplasmic diffusion coefficient increased by 45 to 85% between 10 and through FRAP analysis.6 Fushimi and Verkman showed that cytoplasmic viscosity of Swiss 3T3 cells increased by from by FA measurement.9 Our results indicate that FCS is capable of detecting changes in nucleoplasmic viscosity when cells are under different physiological conditions. Fig. 4Nucleoplasmic viscosity of living HeLa and ASTC-a-1 cells in different physiological conditions. (a) Representative normalized autocorrelation curves of EGFP in the nucleoplasm of an ASTC-a-1 cell at and cooled to ; normalized autocorrelation curves of EGFP in the nucleoplasm of HeLa cells in PBS (---) and in normal medium as control (—) (inset). (b) Nucleoplasmic viscosity of HeLa cells in PBS or at low temperature versus that in normal medium at as control; nucleoplasmic viscosity of ASTC-a-1 cells in ultrapure water or at low temperature versus that in normal medium at as control (inset). Values are ; (standard error of mean) asterisks (*) indicate a significant difference compared with respective controls .  3.2.3.Nucleoplasmic viscosity of HeLa cells synchronized in the G1, S, and G2 phasesTo investigate the nucleoplasmic viscosity of HeLa cells within the cell cycle, we synchronized HeLa cells in the G1, S, and G2 phases and then measured nucleoplasmic viscosity in each phase. Our results showed that of HeLa cells in the G1, S, and G2 phases were (48 cells), (61 cells), and (44 cells), respectively . in the S phase was about 7.9% smaller than that in the G2 phase. The corresponding autocorrelation curves are shown in Fig. 5a . Statistical analysis with the Student’s -test also suggests that the difference in between the S and G1 phases is statistically significant , while the difference between the G1 and G2 phases is not significant . We also found a similar qualitative relationship of cytoplasmic viscosity among these three phases [Fig. 5b; see also Sec. 3.2.4]. Therefore, the viscosity of the aqueous domain in HeLa cells is smallest in the S phase. Fig. 5Nucleoplasmic viscosity of HeLa cells synchronized in the G1, S, and G2 phases. (a) The normalized autocorrelation curves of EGFP in the nucleoplasm of HeLa cells synchronized in the G1 (—), S (⋯), and G2 phase (○), respectively. (b) Histograms for nucleoplasmic viscosity and cytoplasmic viscosity of HeLa cells. G1 phase: 48 cells (nu), 20 cells (cyto); S phase: 61 cells (nu), 22 cells (cyto); G2 phase: 44 cells (nu), 25 cells (cyto); asynchronization: 48 cells (nu), 20 cells (cyto). These data are ; nu: nucleoplasmic viscosity; cyto: cytoplasmic viscosity. Asterisks (*) indicate statistically significant differences between and or differences of between the S phase and G1 (G2) phase, .  The changes of intracellular water relative content and ion concentration within the cell cycle may be the main reason why nucleoplasmic viscosity reduces to its lowest value compared to the G1/G2 phase. It has been shown that permeability to water peaks at the initiation of the S phase and progressively decreases after mitosis and that the volume of cell water is the highest during the S phase and the early G2 phase.46 The inward current of and was found to be the highest in the early G1 phase and the lowest in the S phase.47, 48 These evidences qualitatively support our results. However, additional efforts should be made in the future to determine whether it is a general conclusion that intracellular fluid viscosity becomes the lowest in the S phase. It is an important subject in cell biology, which will provide a reference to biologists engaging in investigation on cell cycle biology. Our current study demonstrated that FCS was a potentially reliable technique to investigate intracellular fluid viscosity in a specific cell phase or under different physiological conditions. It is very important to analyze the molecular and cellular changes during different cell cycle transition in foundational biological and medical research fields. For example, telomerase activity has been detected in the vast majority of human tumors, but only in a few normal somatic cells.49 Its activity is regulated in a cell cycle–dependent manner. Maximum telomerase activity was detected in the S phase, with barely detectable levels observed at the G2/M phase.50 However, traditional methods of cell cycle analysis would inevitably impair the living cells. The most common cell cycle analysis method, flow cytometry, needs propidium iodide (PI) to stain sample cells. PI intercalates into double-stranded nucleic acids; it is excluded by viable cells but can penetrate cell membranes of dying or dead cells.51 Therefore, this routine cell cycle analysis method would lead directly to the death of sample cells and certainly affect further mechanism studies on these same sample cells. Primary sample cells derived directly from patients or possible cases are generally difficult to obtain and have not been subcultured for fear of affecting the accurate studies of the tumorigenesis mechanism. In this situation, FCS is capable of resolving the problem. To understand the relationship between functional proteins and the nuclear microenvironment, it is helpful to analyze the mobility of standard protein molecules with well-defined hydrodynamic properties as well as functional nuclear proteins or labeled macromolecules.52, 53 FSC is useful to this kind of study. The characteristics of FCS (fast, accurate, and noninvasive) demonstrated in our study indicate its promising application in biological and medical foundational studies. 3.2.4.Comparison of nucleoplasmic viscosity and cytoplasmic viscosityFCS was applied to compare with in ASTC-a-1 and HeLa cells. Statistical analysis shows that the average of ASTC-a-1 cells is , about 7.9% smaller than (Table 2 ) and that there are significant differences between and of G1, S, G2, or asynchronizied HeLa cells [ ; Fig. 5b]. We also found similar results when comparing with of the same HeLa cell. Table 2 shows the ratio of to , 1.1 to 1.2, obtained respectively from single HeLa cells in the G1, S, and G2 phases. As shown in Fig. 6, the lag time of the correlation curve in the nucleoplasm was longer than that in the cytoplasm of the same HeLa cells, indicating that it took EGFP longer to go through the excitation volume in the nucleoplasm. These results demonstrated that nucleoplasmic viscosity is higher than cytoplasmic viscosity. Fig. 6The normalized autocorrelation curves of EGFP in the nucleoplasm (◼) and in the cytoplasm (○) of the same HeLa cell. Both curves fit well to the one-component model (—). 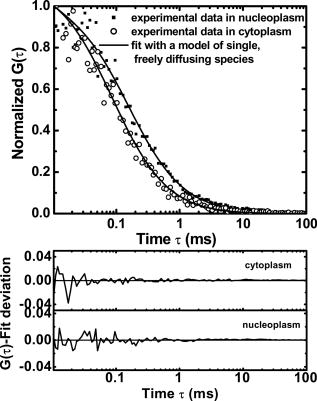 Table 2Comparison between nucleoplasmic viscosity and cytoplasmic viscosity of HeLa cells synchronized in the G1, S, and G2 phases and of ASTC-a-1 cells. Data are mean±S.D.
Guigas recently found that the cytoplasm is more viscoelastic than the nucleoplasm.40 They showed that nanoprobes diffused anomalously (the anomaly, , is in the range of 0.5 to 0.6) within the cytoplasm and nucleoplasm because macromolecules crowding greatly hindered their movement, while green fluorescent protein (GFP) with smaller size diffused normally because the crowding was a less important factor on this scale, consistent with our current work. Therefore, the elastic response subsides and the two compartments appear solely viscose when GFP is used as a probe. In terms of the Guigas finding that cytoplasmic viscoelasticity is higher than nucleoplasmic viscoelasticity, our result further supports the Guigas conclusion that cytoplasm has a higher degree of macromolecule crowding than nucleus.40 4.ConclusionIn this study, FCS was applied to noninvasively determine nucleoplasmic viscosity of living cells. To our best knowledge, this is the first report on nucleoplasmic viscosity of living cells synchronized in the G1, S, and G2 phases. In living cell measurements, we found that the nucleoplasm of HeLa and ASTC-a-1 cells was three to four times as viscous as water, a finding in agreement with previous results by traditional methods. Moreover, we examined the practical use of FCS in detecting changes of nucleoplasmic viscosity of cells under different physiological conditions such as hypotonic exposure and low temperature. We found that intracellular fluid viscosity reached its minimum during the S phase in HeLa cells. Last, we showed that nucleoplasmic viscosity was higher than cytoplasmic viscosity. It is obvious that these spatiotemporal differences of intracellular fluid viscosity should be taken into account in the dynamic analysis of biomolecules in the cell cycle or nucleocytoplasmic transport. In summary, this study suggests that FCS can provide a reliable estimation of rheological characteristics in the nucleus and that it is a noninvasive tool to quantify the dynamics of biomolecules in vivo, which is useful in applications of nanotechnology to medicine and biology. AcknowledgmentsThis research is supported by the National Natural Science Foundation of China (30470494, 30627003, 30670507) and the Natural Science Foundation of Guangdong Province (7117865, F051001). ReferencesC. A. Haberzettl,
“Nanomedicine: destination or journey?,”
Nanotechnology, 13 R9
–R13
(2002). https://doi.org/10.1088/0957-4484/13/4/201 0957-4484 Google Scholar
S. M. Moghimi, A. C. Hunter, and J. C. Murray,
“Nanomedicine: current status and future prospects,”
FASEB J., 19 311
–330
(2005). https://doi.org/10.1096/fj.04-2747rev 0892-6638 Google Scholar
K. Kubik-Bogunia and M. Sugisaka,
“From molecular biology to nanotechnology and nanomedine,”
BioSystems, 65 123
–138
(2002). https://doi.org/10.1016/S0303-2647(02)00010-2 0303-2647 Google Scholar
C. M. Niemeyer,
“Nanotechnology: tools for the biomolecular engineer,”
Science, 297 62
–63
(2002). https://doi.org/10.1126/science.1073843 0036-8075 Google Scholar
A. A. G. Requicha,
“Nanorobots, NEMS, and Nanoassembly,”
Proc. IEEE, 91 1922
–1933
(2003). https://doi.org/10.1109/JPROC.2003.818333 0018-9219 Google Scholar
I. Lang, M. Scholz, and R. Peters,
“Molecular mobility and nucleocytoplasmic flux in hepatoma cells,”
J. Cell Biol., 102 1183
–1190
(1986). https://doi.org/10.1083/jcb.102.4.1183 0021-9525 Google Scholar
J. Beaudouin, F. Mora-Bermúdez, T. Klee, N. Daigle, and J. Ellenberg,
“Dissecting the contribution of diffusion and interactions to the mobility of nuclear proteins,”
Biophys. J., 90 1878
–1894
(2006). https://doi.org/10.1529/biophysj.105.071241 0006-3495 Google Scholar
Y. Tseng, J. S. Lee, T. P. Kole, I. Jiang, and D. Wirtz,
“Micro-organization and visco-elasticity of the interphase nucleus revealed by particle nanotracking,”
J. Cell. Sci., 117 2159
–2167
(2004). https://doi.org/10.1242/jcs.01073 0021-9533 Google Scholar
K. Fushimi and A. S. Verkman,
“Low viscosity in the aqueous domain of cell cytoplasm measured by picosecond polarization microfluorimetry,”
J. Cell Biol., 112 719
–725
(1991). https://doi.org/10.1083/jcb.112.4.719 0021-9525 Google Scholar
E. L. Elson and D. Magde,
“Fluorescence correlation spectroscopy. 1. Conceptual basis and theory,”
Biopolymers, 13 1
–27
(1974). https://doi.org/10.1002/bip.1974.360130102 0006-3525 Google Scholar
D. Magde, W. W. Webb, and E. L. Elson,
“Thermodynamic fluctuations in a reacting system—measurement by fluorescence correlation spectroscopy,”
Phys. Rev. Lett., 29 705
–708
(1972). https://doi.org/10.1103/PhysRevLett.29.705 0031-9007 Google Scholar
O. Krichevsky and G. Bonnet,
“Fluorescence correlation spectroscopy: the technique and its applications,”
Rep. Prog. Phys., 65 251
–297
(2002). https://doi.org/10.1088/0034-4885/65/2/203 0034-4885 Google Scholar
Z. Wang, J. V. Shah, M. W. Berns, and D. W. Cleveland,
“In vivo quantitative studies of dynamic intracellular processes using fluorescence correlation spectroscopy,”
Biophys. J., 91 343
–351
(2006). 0006-3495 Google Scholar
S. A. Tatarkova, A. K. Verma, D. A. Berk, and C. J. Lloyd,
“Quantitative fluorescence microscopy of macromolecules in gel and biological tissue,”
Phys. Med. Biol., 50 5759
–5768
(2005). https://doi.org/10.1088/0031-9155/50/23/024 0031-9155 Google Scholar
C. R. Sabanayagam and J. R. Lakowicz,
“Fluctuation correlation spectroscopy and photon histogram analysis of light scattered by gold nanospheres,”
Nanotechnology, 18 335402
–335408
(2007). https://doi.org/10.1088/0957-4484/18/35/355402 0957-4484 Google Scholar
J. M. Moran-Mirabal, A. J. Torres, K. T. Samiee, B. A. Baird, and H. G. Craighead,
“Cell investigation of nanostructures: zero-mode waveguides for plasma membrane studies with single molecule resolution,”
Nanotechnology, 18 195101
–195110
(2007). https://doi.org/10.1088/0957-4484/18/19/195101 0957-4484 Google Scholar
K. M. Berland, P. T. C. So, and E. Gratton,
“Two-photon fluorescence correlation spectroscopy: method and application to the intracellular environment,”
Biophys. J., 68 694
–701
(1995). 0006-3495 Google Scholar
V. Vukojević, A. Pramanik, T. Yakovleva, R. Rigler, L. Terenius, and G. Bakalkin,
“Study of molecular events in cells by fluorescence correlation spectroscopy,”
Cell. Mol. Life Sci., 62 535
–550
(2005). https://doi.org/10.1007/s00018-004-4305-7 1420-682X Google Scholar
A. Partikian, B. Ölveczky, R. Swaminathan, Y. Li, and A. S. Verkman,
“Rapid diffusion of green fluorescent protein in the mitochondrial matrix,”
J. Cell Biol., 140 821
–829
(1998). https://doi.org/10.1083/jcb.140.4.821 0021-9525 Google Scholar
S. A. Didichenko, C. M. Fragoso, and M. Thelen,
“Mitotic and stress-induced phosphorylation of HsPI3K-C2a targets the protein for degradation,”
J. Biol. Chem., 278 26055
–26064
(2003). 0021-9258 Google Scholar
T. Krude,
“Mimosine arrests proliferating human cells before onset of DNA replication in a dose-dependent manner,”
Exp. Cell Res., 247 148
–159
(1999). 0014-4827 Google Scholar
T. Taniguchi, I. Garcia-Higuera, P. R. Andreassen, R. C. Gregory, M. Grompe, and A. D. D. Andrea,
“S-phase-specific interaction of the Fanconi anemia protein, FANCD2, with BRCA1 and RAD51,”
Blood, 100 2414
–2420
(2000). 0006-4971 Google Scholar
H. Gao, X. B. Chen, and C. H. McGowan,
“Mus81 endonuclease localizes to nucleoli and to regions of DNA damage in human S-phase cells,”
Mol. Biol. Cell, 14 4826
–4834
(2003). 1059-1524 Google Scholar
A. A. Al-Bader, A. Orengo, and P. N. Rao,
“G2 phase-specific proteins of HeLa cells,”
Proc. Natl. Acad. Sci. U.S.A., 75 6064
–6068
(1978). 0027-8424 Google Scholar
R. Y. Tsein,
“The green fluorescent protein,”
Annu. Rev. Biochem., 67 509
–544
(1998). https://doi.org/10.1146/annurev.biochem.67.1.509 0066-4154 Google Scholar
R. Rigler, Z. Foldes-Papp, F. J. Meyer-Almes, C. Sammet, M. Volcker, and A. Schnetz,
“Fluorescence cross-correlation: a new concept for polymerase chain reaction,”
J. Biotechnol., 63 97
–109
(1998). https://doi.org/10.1016/S0168-1656(98)00079-0 0168-1656 Google Scholar
K. Saito, I. Wada, M. Tamura, and M. Kinjo,
“Direct detection of caspase-3 activation in single live cells by cross-correlation analysis,”
Biochem. Biophys. Res. Commun., 324 849
–854
(2004). 0006-291X Google Scholar
C. Pack, K. Saito, M. Tamura, and M. Kinjo,
“Microenvironment and effect of energy depletion in the nucleus analyzed by mobility of multiple oligomeric EGFPs,”
Biophys. J., 91 3921
–3936
(2006). 0006-3495 Google Scholar
U. Haupts, S. Maiti, P. Schwille, and W. W. Webb,
“Dynamics of fluorescence fluctuations in green fluorescent protein observed by fluorescence correlation spectroscopy,”
Proc. Natl. Acad. Sci. U.S.A., 95 13573
–13578
(1998). https://doi.org/10.1073/pnas.95.23.13573 0027-8424 Google Scholar
P. Schwille and E. Haustein,
“Fluorescence correlation spectroscopy: an introduction to its concepts and applications,”
(2004) http://www.biophysics.org/education/schwille.pdf Google Scholar
K. Weisshart, V. Jungel, and J. S. Briddon,
“The LSM 510 META-Confocor 2 system: an integrated imaging and spectroscopic platform for single-molecule detection,”
Curr. Pharm. Biotechnol., 5 135
–154
(2004). https://doi.org/10.2174/1389201043376913 1389-2010 Google Scholar
Z. Petrásek and P. Schwille,
“Precise measurement of diffusion coefficients using scanning fluorescence correlation spectroscopy,”
Biophys. J., 94 1437
–1448
(2008). 0006-3495 Google Scholar
P.-O. Gendron, F. Avaltroni, and K. J. Wilkinson,
“Diffusion coefficient of several rhodamine derivatices as determined by pulsed field gradient—nuclear magetic resonance and fluorescence correlation spectroscopy,”
J. Fluoresc., 18 1093
–1101
(2008). https://doi.org/10.1007/s10895-008-0357-7 1053-0509 Google Scholar
C. Zeiss,
“Biophysical fundamentals of FCS,”
Applications Manual LSM 510-Confocor 2 Fluorescence Correlation Spectroscopy, 62
–90
(2001) Google Scholar
R. Swaminathan, C. P. Hoang, and A. S. Verkman,
“Photobleaching recovery and anisotropy decay of green fluorescent protein GFP-S65T in solution and cells: cytoplasmic viscosity probed by green fluorescent protein translational and rotational diffusion,”
Biophys. J., 72 1900
–1907
(1997). 0006-3495 Google Scholar
D. E. Koppel,
“Statistical accuracy in fluorescence correlation spectroscopy,”
Phys. Rev. A, 10 1938
–1945
(1974). https://doi.org/10.1103/PhysRevA.10.1938 1050-2947 Google Scholar
O. Seksek, J. Biwersi, and A. S. Verkman,
“Translational diffusion of macromolecule-sized solutes in cytoplasm and nucleus,”
J. Cell Biol., 138 131
–142
(1997). https://doi.org/10.1083/jcb.138.1.131 0021-9525 Google Scholar
T. Misteli,
“Protein dynamics: implications for nuclear architecture and gene expression,”
Science, 291 843
–847
(2001). https://doi.org/10.1126/science.291.5505.843 0036-8075 Google Scholar
R. D. Phair and T. Misteli,
“High mobility of proteins in the mammalian cell nucleus,”
Nature (London), 404 604
–609
(2000). https://doi.org/10.1038/35007077 0028-0836 Google Scholar
G. Guigas, C. Kalla, and M. Weiss,
“The degree of macromolecular crowding in the cytoplasm and nucleoplasm of mammalian cells is conserved,”
FEBS Lett., 581 5094
–5098
(2007). 0014-5793 Google Scholar
Y. Chen, J. D. Müller, Q. Ruan, and E. Gratton,
“Molecular brightness characterization of EGFP in vivo by fluorescence fluctuation spectroscopy,”
Biophys. J., 82 133
–144
(2002). 0006-3495 Google Scholar
Z. Wang, J. V. Shah, Z. Chen, C. Sun, and M. W. Berns,
“Fluorescence correlation spectroscopy investigation of a GFP mutant-enhanced cyan fluorescent protein and its tubulin fusion in living cells with two-photon excitation,”
J. Biomed. Opt., 9 395
–403
(2004). https://doi.org/10.1117/1.1646416 1083-3668 Google Scholar
A. I. Lamond and W. C. Earnshaw,
“Structure and function in the nucleus,”
Science, 280 547
–553
(1998). https://doi.org/10.1126/science.280.5363.547 0036-8075 Google Scholar
M. Wachsmuth, W. Waldeck, and J. Langowski,
“Anomalous diffusion of fluorescent probes inside living cell nuclei investigated by spatially resolved fluorescence correlation spectroscopy,”
J. Mol. Biol., 298 677
–689
(2000). https://doi.org/10.1006/jmbi.2000.3692 0022-2836 Google Scholar
J. Braga, J. M. P. Desterro, and M. Carmo-Fonseca,
“Intracellular macromolecular mobility measured by fluorescence recovery after photobleaching with confocal laser scanning microscopes,”
Mol. Biol. Cell, 15 4749
–4760
(2004). https://doi.org/10.1091/mbc.E04-06-0496 1059-1524 Google Scholar
A. M. DuPre and H. G. Hempling,
“Osmotic properties of Ehrlich ascites tumor cells during the cell cycle,”
J. Cell Physiol., 97 381
–396
(1978). https://doi.org/10.1002/jcp.1040970313 0021-9541 Google Scholar
N. Ullrich and H. Sontheimer,
“Cell cycle–dependent expression of a glioma-specific chloride current: proposed link to cytoskeletal changes,”
Am. J. Physiol., 273 C1290
–C1297
(1997). 0002-9513 Google Scholar
A. Takahashi, H. Yamaguchi, and H. Miyamoto,
“Change in current of HeLa cells with progression of the cell cycle studied by patch-clamp technique,”
Am. J. Physiol., 265 C328
–C336
(1993). 0002-9513 Google Scholar
H. W. Sharma, J. A. Sokoloski, J. R. Perez, J. Y. Maltese, A. C. Sartorelli, C. A. Stein, G. Nichols, Z. Khaled, N. T. Telang, and R. Narayanan,
“Differentiation of immortal cells inhibits telomerase activity,”
Proc. Natl. Acad. Sci. U.S.A., 92 12343
–12346
(1995). 0027-8424 Google Scholar
X. Zhu, R. Kumar, M. Mandal, N. Sharma, H. W. Sharma, U. Dhingra, J. A. Sokoloski, R. Hsiao, and R. Narayanan,
“Cell cycle–dependent modulation of telomerase activity in tumor cells,”
Proc. Natl. Acad. Sci. U.S.A., 93 6091
–6095
(1996). 0027-8424 Google Scholar
A. Kolstad and M. Tuck,
“Propidium iodide staining for sub-G1 analysis: hypotonic lysis method,”
(1999) http://www.med.umich.edu/flowcytometry/PDF%20files/HYPOpi.pdf Google Scholar
R. D. Phair, P. Scaffidi, C. Elbi, J. Vecerová, A. Dey, K. Ozato, D. T. Brown, G. Hager, M. Bustin, and T. Misteli,
“Global nature of dynamic protein-chromatin interactions in vivo: three-dimensional genome scanning and dynamic interaction networks of chromatin proteins,”
Mol. Cell. Biol., 24 6393
–6402
(2004). https://doi.org/10.1128/MCB.24.14.6393-6402.2004 0270-7306 Google Scholar
A. S. Verkman,
“Solute and macromolecule diffusion in cellular aqueous compartments,”
TIBS, 27 27
–33
(2002). https://doi.org/10.1016/S0968-0004(01)02003-5 0968-0004 Google Scholar
|