
|
|
1.IntroductionIn the past decade new technologies and tools have emerged that address the special imaging needs and challenges of studying the biology of cancers and tumor cells in living tissue. These new systems include a variety of intravital and orthotopic in vivo models, along with new ways of fluorescently labeling cells and blood vessels.1, 2, 3, 4, 5, 6 New imaging instruments have been introduced, such as the multiphoton (2-P) microscope in particular, which due to the increased tissue penetration of near IR light, facilitates the noninvasive acquisition of high resolution 3-D images of living cells within deeper layers of intact organs. The multiphoton system creates a well defined and compact subfemtoliter 2-P excitation volume, thus greatly reducing photodamage, and obviating the need for a spatial filter (namely, confocal pinhole), which optimizes light gathering. In addition, light interference from above and below the plane of focus, the so-called “light flare,” is virtually eliminated, resulting in improved signal to noise over confocal systems.7, 8, 9, 10, 11, 12, 13, 14, 15, 16 In the context of intravital imaging, there also is considerable potential in using oxygen, pH, and electrophysiology microelectrodes, together with injection micropipettes, sampling micropipettes, mechanical strain sensors, and micromanipulators. However, many multiphoton systems are derived from standard inverted or upright fluorescence microscopes that have a microscope stand, epifluorescent illuminator, objective mounts, objective dimensions, and objective working distances that do not necessarily allow adequate space for cell physiology hardware. The inverted configuration makes the optical guidance of microdevices into samples awkward if not impossible. Moreover, many commercially available multiphoton systems are very costly and operate in descanned mode (i.e., emitted sample light passes back through the scanning mirrors), limiting sample depth penetration to between 100 and . Therefore, we report here the construction of an upright, long-working-distance multiphoton microscope, with enough space to operate hardware for organ and cell physiology and still be able to acquire high resolution images of tumor and host cells deep (at least ) within tissues. We reconfigured, for multiphoton imaging, a Nikon FN1 upright, dedicated electrophysiology microscope, and a Nikon C1 confocal scanhead. Our goal was to use an existing electrophysiology platform that could readily and economically be adapted in the same way by other laboratories. The FN1 microscope has a simple, compact body design to allow more stage space and it is fitted with a retractable objective mount. Importantly, the long-working-distance objectives ( WD) have a comparatively narrow bore, which is important for sample navigation and electrophysiology.15 Objectives were selected on the basis of high numerical aperture, with good UV and IR light transmission characteristics.15 The number of two-photon events within the focal point is highly dependent on the objective lens numerical aperture (NA), where is the two-photon absorption cross-section, is the average power of the laser, is the repetition rate of the laser source, is the pulse duration, and NA is the numerical aperture of the microscope objective lens.16The microscope redesign was optimized to maximize the efficiency of laser beam introduction, emitted light acquisition for high signal to noise, and the instrument was coupled to a powerful ( peak output) IR laser. The reconfigured microscope was validated with optical tests, and in vivo imaging was performed on live material using a novel orthotopic externalized pancreas tumor mouse model and live externalized murine lymph nodes. To demonstrate its potential role and utility, the whole-mouse imaging capabilities of the extended-working-distance multiphoton system were compared to an Olympus OV100 small animal variable magnification fluorescence imaging system.17 The 2-P microscope described here imaged the interaction between tumor cells, motile host cells, and blood vessels at high resolution. Moreover, the instrument was used to image live, externalized murine lymph nodes containing fluorescently labeled T-cells. Those imaging experiments involved placing a petri dish, temperature electrode, and two relatively bulky perfusion nozzles and their mounts on the microscope stage, illustrating the space advantage offered by this system. The instrument was able to image down to in dense lymph nodes. Thus, it compares favorably with previous reports of nondescanned systems as well as descanned systems in terms of deep imaging of labeled cells within murine lymph nodes.16, 18, 19, 20, 21 For example, Celli and Busso20 reported imaging labeled T-cells in mouse lymph nodes to a depth of with a nondescanned system. Miller 21 reported tracking individual T-cells up to from the capsular surface of a mouse lymph node, also using a nondescanned system. 2.Materials and Methods2.1.Construction of Multiphoton MicroscopeThe multiphoton microscope was constructed in-house using a Nikon FN-1 intravital upright microscope as the base system [Fig. 1a ]. The redesign was fairly extensive to maximize signal acquisition. The left side of the microscope body, at the level of the filter cube mounting turret, was cut out. A mounting cube fitted with a long-pass dichroic mirror for 2-P ( LP) was secured in the turret, and positioned so that light emitted from the excited sample would be reflected off the dichroic mirror and pass through the center of the cut opening in the microscope stand. The dichroic mirror allowed the excitation light to pass through to the sample, and was secured approximately above the objective back aperture. This location ensured that the photo-multiplier tube (PMT) detectors would be positioned as close to the back focal plane of the objective as was feasible, thereby gathering as much light as possible.15 The emitted light was not descanned, as this process has been demonstrated to reduce signal to noise by as much as 60%.11, 12, 22, 23 A detector box was fabricated from anodized aluminum and held square with the microscope opening using a metal stand bolted to the air table surface. The detector box [Fig. 1b] contained a slider apparatus that accommodated two Nikon filter cube mounts, and two side-on photomultiplier tubes (PMTs, Hammamatsu R928). The cube mounts contained an IR blocking filter ( short pass, Chroma Technology, Rockingham, Vermont) to prevent stray IR radiation from the laser entering the detector, and a simple lens in front of a red/green beamsplitter (long-pass dichroic mirror) and a red and a green filter. The lens was positioned to project the image of the back focal onto the surface of the PMTs with negative magnification. The microscope was mounted on a Newport Corporation air vibration table, and the entire multiphoton system, including final stage laser, was enclosed in black-vinyl-coated cloth to minimize light leaks. Moreover, the PMTs and mounts were enclosed in lightproof metal foil, vinyl cloth, and optical tape. It was found that these steps were critical for blocking light and improving signal to noise by approximately 25%. Fig. 1(a) Photograph of the Nikon FN-1 intravital physiology microscope modified into a long-working-distance multiphoton system. The laser light path and primary mirrors are indicated in the image. (b) Light detector assembly. The slider, containing cubes fitted with a dichroic (beamsplitting) mirror and two filters, moves within the housing, allowing a selection of cubes. Light passes through the positioned cube and enters the PMT detectors. (c) The stage of the FN-1 with perfusion nozzles and mounts, a petri dish, and a temperature thermistor probe. There is still plenty of room on the stage for more equipment and for the use of probes by the experimenter.  The FN1 mechanical stage was replaced with a motorized Prior Proscan® stage (Prior Scientific, Rockland, Massachusetts). The Prior stage occupied more room than the original stage, thus the condenser was removed so that the stage could be lowered sufficiently to allow placement of a live mouse under the objective lens. Figure 1c is a photograph of the FN1 stage with a perti dish, perfusion nozzles and mounts, and a thermistor probe. This image illustrates the ample stage space offered by this instrument. Introduction of the beam into the scanhead was simple and direct without any fiber optics and with a minimum of optical components (Fig. 2 ). A Nikon confocal system CS-1 scanhead was used, and the manufacturer’s built-in optics for compatibility with fiber optic laser input were entirely bypassed. This was done to avoid broadening the incident laser beam pulses due to group velocity dispersion, which would have resulted in a less well-defined 2-P excitation volume in the sample. Laser beam pulse broadening results in a significantly reduced 2-P event probability. As described by McConnell16 in his excellent discussion, laser pulse broadening is given by, where is the optical path length, is the input pulse duration, and is the broadened output pulse duration. The dispersion is caused by all optical components in the laser path, especially the objective lens, which is optically complex.Fig. 2Schematic of the multiphoton system. The laser beam was expanded and directly introduced into the scanhead. Light emitted from the sample was immediately diverted to the light detectors (PMTs) to minimize divergence and loss of signal amplitude. 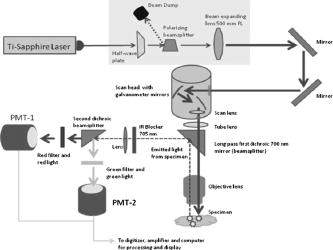 Care was taken to ensure that the smallest, sharpest diffraction-limited spot was created on the sample by each objective, ultimately resulting in a higher photon flux in a symmetrical focal volume. Therefore, a long focal length lens was positioned between the laser and the scanhead to expand the beam so that it slightly overfilled the back aperture of the microscope objectives. As a matter of convenience, the scanhead was mounted on top of the microscope, above the eyepieces. The laser was a Spectra-Physics “MaiTai” Ti-sapphire unit that required little adjustment, and was able to generate robust power levels up to . The laser was tunable between 690 and , with a pulse duration, which is of sufficient duration to obviate the need for optical compensation to address beam broadening effects. The laser power was continuously adjustable using a half-wave plate and polarizing beamsplitter (Fig. 2). The half-wave plate was mounted to a remote controlled stepping motor, allowing fine adjustments to beam intensity without introducing scatter and a broadening of the desired sharp Gaussian shape of the laser beam. 2.2.Multiphoton Image AcquisitionA series of simple optical imaging tests was applied to ensure that the multiphoton microscope was operating effectively. Initially, to ensure that the laser beam was passing through the objective lenses without excessive power loss and attendant beam broadening, the transmission through each objective was measured. The power of the laser in microwatts was taken at the back aperture and at the objective using a laser power meter (LaserCheck®, Coherent, Auburn, California). To determine whether the microscope was actually acquiring 2-P images, a fluorescent slide was imaged at the surface and at various depths using both the 2-P, and for comparison, a proven, commercially available confocal microscope (Nikon TE2000). Both instruments used a Nikon CS-1 scanhead. The incident laser power was measured with a meter, and the logarithm of each measured value was plotted against the logarithm of the corresponding fluorescence signal amplitude. The line slope for a two-photon process should be approximately two (i.e., ), and the slope for the confocal data should be one, i.e., a linear relationship.24 To determine retention of frequency information with deeper imaging, fast Fourier transform (FFT) power spectrum was applied to the images acquired with a lens at the surface of the fluorescent slide and at . For comparison, the Fourier analysis was done with images acquired with both the multiphoton and confocal microscopes. The 2-D discrete Fourier transform, given by, and the frequency versus amplitude power spectrum given bywere applied using Matlab (Mathworks Incorporated, Natick, Massachusetts) operating on a PC, where is the discrete Fourier transform with dimensions ; is the number of points, is the number e to an exponential involving complex numbers, (rows), (columns), and where is the power spectrum.To determine that the 2-P microscope could acquire light very deep within a sample, an imaging phantom was made. This agar standard comprised red fluorescent spheres ( , Invitrogen Corp., Carlsbad, California) imbedded in 6% agar (Bactone) with milk proteins and lipids added (1 to 2%). To define the degree of light attenuation by the gel phantom, which includes both absorption and scattering components, small samples of the gel and brain tissue were positioned directly in the path of a laser (Verdi-V5, Coherent Inc., Santa Clara, California). A silicon PIN light detector (Newport 818-SL, Newport Corp., Irvine, California) was placed 4.5 behind the sample and connected to an optical power meter (Newport 1830-C). A beam was directed into the sample and the amount of light leaving the sample was detected at 0, 90, and to the incident beam. The attenuation coefficients based on the light path were calculated according to: where is the detected light, is the initial light intensity, is the absorption or scattering coefficient, and is the thickness of the material in centimeter.For in vivo imaging, the pancreas of live mice was imaged using dry, and , , and water dipping lenses. The phosphate buffered saline (PBS) for the dipping lenses was contained by a square trough, made with a standard sized coverglass with a -high stainless steel border. The trough was placed over the externalized pancreas. The objective lens was moved across the area by moving the motorized stage holding the animal. Live externalized lymph nodes were dissected free from deeply anesthetized mice and affixed to the bottom of a Petri dish that was irrigated with warmed and aerated PBS. 2.3.OV100 ImagingThe Olympus OV100 Small Animal Imaging System (Olympus Corporation, Tokyo, Japan), described in detail elsewhere,17 containing an MT-20 light source (Olympus Biosystems, Planegg, Germany) and DP70 charge-coupled device (CCD) camera (Olympus Corporation, Tokyo, Japan) was used for dual-color imaging of an externalized pancreas. The OV100 covers a range of magnification, from ( imaging area) to . Four individually optimized objectives, paracentered and parfocal, provide a 106-fold magnification range for seamless imaging of the entire pancreas to the cellular level without disturbing the animal. The optics and antireflective coating ensure optimal imaging of multiplexed fluorescent reporters in small animal imaging models. High-resolution images were captured directly on a PC and processed in Adobe Photoshop®. 2.4.Imaging of In Vivo Samples2.4.1.Animal careAthymic male nude and C57 mice were maintained in a barrier facility under pathogen-free conditions. All surgical procedures and intravital imaging were conducted in accordance with approve University of California, San Diego, Animal Care Program protocols, and within the guidelines of the National Institutes of Health Guide for the Care and Use of Animals. 2.4.2.Orthotopic injection of tumor cellsThe human pancreatic cancer cell lines FG, FGM, FGβ3, and XPA–1 were maintained in RPMI 1640, and stably expressed either the DSRed-2 red fluorescent protein (RFP) or green fluorescent protein (GFP). Prior to implantation into the pancreas of healthy male nude mice, cells were harvested and resuspended in serum-free RPMI at 100,000 cells per microlite. The animals were anesthetized using a 50% ketamine, 38% xylazine, and 12% maleate mixture injected intramuscularly (i.m.) at a dose of , and the tail of the pancreas was gently exposed. A Hamilton Syringe (Hamilton Company, Reno, Nevada) was used to inject of the prepared cell suspension into the pancreatic tail. The peritoneum and skin were then closed using 6-0 ethibond sutures (Ethicon, Somerville, New Jersey). 2.4.3.Imaging of the pancreasAfter the implanted tumor cells were allowed to grow for , mice were again fully anesthetized, kept warm, and the tail of the pancreas and spleen were gently exposed with careful attention paid to maintaining meticulous hemostasis throughout the dissection. The pancreatic tail with the tumor was then stabilized away from the animal’s body between a glass slide and cover slip, and maintained in a moist environment via repeated irrigation with sterile saline. A saline-filled clear glass trough was placed over the pancreas and a dipping lens was inserted into the saline for imaging. 2.4.4.Preparation of T-cells for lymph node inoculationOT-II TCR transgenic (Tg) mice were bred to the CD45.1 congenic background. The OT-II TCR is specific for a chicken ovalbumin peptide 323-339 complex. Wild-type C57BL/6 mice ( of age) were purchased from Charles River Laboratories (Frederick, Maryland). Donor OT-II CD4 T cells from the secondary lymphoid tissues (axillary, brachial, cervical, inguinal, mesenteric lymph nodes, and spleen) were purified by CD4 T cell negative selection using magnetic microbeads (Miltenyi Biotec, Auburn, California). The purified cells ( pure) were labeled with 5,6-carboxyfluorescein diacetate succinimyl ester (CFSE, Molecular Probes, Eugene, Oregon) with 0.1% BSA for at and injected into the tail vein at cells per C57BL/6 recipient mouse. 2.4.5.Imaging of lymph nodesMice were euthanized by asphyxiation and inguinal lymph nodes were removed for microscopy. Lymph nodes were secured on the bottom of a petri dish with a thin film of VetBond (3M) and maintained at by perfusing the chamber with warm PBS. Perfusion nozzles and a temperature thermistor probe (VWR® Snap-In Module Thermometer, VWR, West Chester, Pennsylvania) were secured in the petri dish; PBS was recirculated and maintained at with a water bath. A water dipping lens was advanced into the PBS over the lymph node for imaging. 3.Results3.1.Optical Tests of the Multiphoton Microscope3.1.1.Confirmation of 2-P imagingPrior to engaging in biological imaging, we conducted some simple tests and imaging exercises to ensure that the microscope was operating satisfactorily as a 2-P instrument. Two-photon excitation is a quadratic process, very dependent on incident photon flux, as two excitation photons are needed to cause a single emission. In contrast, single photon excitation is a linear process. Accordingly, a fluorescent plastic slide was imaged with escalating doses of laser power with both confocal and multiphoton microscopes. As indicated by Fig. 3a, the confocal logarithmic plot of laser power versus emitted light intensity did yield a line with a slope of close to one , as predicted for a confocal system.24 The multiphoton plot yielded a slope of 2 [Fig. 3b], which is expected for the 2-P quadratic relationship between emitted fluorescence intensity and excitation beam intensity.24, 25 These data demonstrate that our microscope was in fact operating properly as a two-photon instrument.24 3.1.2.Imaging depth performanceThe ability of the multiphoton instrument to penetrate an agar-milk gel phantom impregnated with fluorescent beads was evaluated using a dry lens and a dipping lens. For comparison the same dry lens was fitted to a confocal microscope and tested with the same sample of fluorescent agar-milk gel standard. Before confocal and 2-P imaging of the gel standard, however, the optical attenuation (absorption and scattering) characteristics of the phantom were compared with freshly extracted mouse brain tissue. Mouse brain was used as the biological comparison for the gel because its composition is relatively consistent, and this tissue has been extensively imaged with 2-P systems. Hence, such a biological reference for the agar-milk gel standard provides some indication of how a 2-P system might perform in general. Tumor tissue, on the other hand, is highly heterogenous and variable, even between implanted tumors of the same line. Table 1 indicates the attenuation coefficient for the gel standard and mouse brain tissue with the light detector at various angles from the incident laser beam. The brain had a higher coefficient of attenuation , versus , but for the scattering conditions, the values were closer. Importantly, in the backscattering condition where absorption would be expected to contribute less to attenuation, the raw values and the attenuation coefficient between the gel and brain were comparatively close, differing by only 12%. Therefore, the agar-milk gel standard did approximately mimic the scattering characteristics of brain tissue. In this context it is significant that with the near IR, where many confocal and all 2-P measurements are made, absorption is much less of a factor than scattering.26 Hence the gel phantom should suffice for assessing the performance of a 2-P instrument. Table 1Attenuation of 532-nm 5-mW laser light by a gel phantom and mouse brain.
The multiphoton microscope was able to acquire emitted light from deep within the gel standard. Figure 4 is a plot of average grayscale intensity of light emitted from the gel-imbedded fluorescent microspheres versus depth. The data reveal that the signal intensity for the confocal dropped off immediately and steeply after imaging depth, while the same dry lens on the 2-P instrument acquired emitted light approximately three-fold deeper, almost to with relatively little signal loss. The dipping lens and the dry lens, when mounted on the 2-P instrument, exhibited similar performance. However, the dipping lens was able to acquire images of fluorescent beads to about depth, albeit with diminished signal intensity. The 2-P intensity increase, observed between 50 and , is interesting. It is possible that this effect may be due to the redirecting of emitted photons by scattering. These photons enter the PMT, resulting in an increased signal. This could be an advantage of nondescanned imaging, as a descanned system may allow the scattered photons to diverge before entering the PMT. Fig. 4A plot of average grayscale intensity versus sample imaging depth. The confocal signal intensity, using a dry lens, fell steeply after imaging depth. The same dry lens on the 2-P instrument penetrated the sample approximately three-fold deeper, almost to . The dipping lens and the dry lens, when mounted on the 2-P instrument, exhibited similar performance, although the dipping lens was able to acquire images of fluorescent beads to about depth.  To obtain additional evidence that a small 2-P excitation volume developed at increased sample depth along with retention of signal quality, a 2-D Fourier transform (2-D FFT) was performed on the images acquired at different sample depths. Note from Fig. 5a that confocal image power spectra contained a spectrum of frequencies for the slide surface with a central peak and side lobes (arrows in figure). The emission spectrum of the slide was measured independently and found to have a peak and broad shoulder and tail, encompassing nearly . Therefore, a range of frequencies is expected in the power spectrum. Figure 5b is the same plot for image data acquired at depth, and there was considerable contraction of the frequency profile with a disappearance of the side lobes (arrows). The comparable multiphoton data, shown in Figs. 5c and 5d, reveal a sharply defined peak (arrows) with distinct frequency lobes (white arrows) both at the surface and also at . The multiphoton power spectra remained relatively constant regardless of sample imaging depth, while the initial confocal profile was lost at the deeper imaging position. Fig. 5The power spectra (square of Fourier transform) of the images taken of a comparatively broad emission spectrum (approximately ) red fluorescent slide at its surface and at a focal depth of are shown. The vertical axis denotes relative power while the two horizontal axes represent spatial frequency. (a) and (b) show the surface and spectra, respectively, for confocal microscope images. Note the peak and frequency side lobes, indicated by white arrows. (c) and (d) show the same for the multiphoton microscope. Note that the multiphoton spectra remain constant regardless of imaging depth, with no loss of side lobes (arrows), while the confocal spectra reveal a loss of information. 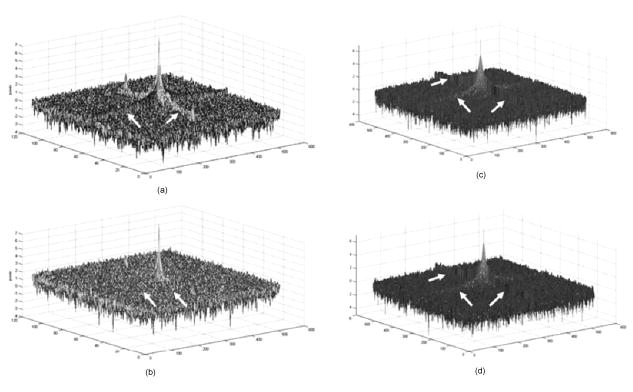 3.1.3.Light transmission of long-working-distance objectivesThe microscope objectives used with the rebuilt 2-P microscope were long-working-distance lenses intended for intravital and wet biological work. However, a significant number of microscope objectives are not designed specifically for use with a Ti-sapphire laser. Therefore, we sought to determine the approximate transmission characteristics of the lenses, as significantly reduced transmission has been demonstrated to cause detrimental broadening of the laser pulse.27, 28 Such distortion of the original beam from the sharp temporal Gaussian can markedly reduce 2-P efficiency, depth penetration, and image quality.16 The transmission for all lenses tested remained relatively constant between 750, 800, and and the , , and lenses exhibited good IR transmission,15 in excess of 75%, at (Table 2 ). As expected, the lens exhibited acceptable but substantially lower IR transmission, most likely because of significant overfilling of the back aperture of the objective. The loss of laser power through the scanhead alone was about 25%, and with the scanhead and the long-pass dichroic mirror combined, the loss was about 36% of the incident laser power. This indicates that light emitted from the sample would be considerably attenuated if returned through the dichroic mirror and the scanhead. The loss in signal would be further increased by divergence of emitted light from the sample traveling to the scanning mirrors (descanning). These observations are consistent with other reports that indicate that operating a multiphoton microscope in descanned mode leads to a significant loss of incident light signal.11, 12, 22, 25 Therefore, the final design of the microscope described in the present report incorporated a nondescanned configuration to optimize signal to noise. Table 2Transmission of IR delivered by 120-fs pulsed Ti-sapphire Gaussian laser beam expanded to 4-mm with a 500-mm FL lens and passed through a half-wave plate, polarizing beamsplitter, and Nikon CS-1 scanhead. The percent transmission is expressed as intensity of light at the sample plane divided by intensity of light entering the back aperture of the objective. Each value is the mean of three readings.
3.2.In Vivo Imaging3.2.1.Intravital image quality with live subjectsUsing a range of magnifications with the 2-P microscope and the OV100, it was possible to capture the considerable extent of the vasculature associated with the tumor, including the characteristic tortuous tumor blood vessels. The high resolution imaging afforded with the multiphoton microscope, at multiple magnification settings, allowed individual cell interactions with blood vessels to be imaged with a high degree of detail [Figs. 6a and 6b ]. Fig. 6Multiphoton images taken at (a) and (b) . (a) shows green-labeled (GFP) human pancreatic (FG-RFP) cells growing in the living pancreas of the nu/nu mouse. Tumor blood vessels can be seen in red . The image in (b) is digitally zoomed showing details of XPA-1–RFP pancreatic tumor cells that appear red. The vessels in (b) were labeled with IV injected FITC-lectin. Note the engagement of the cells with the blood vessel (B ). Cellular detail in (b) is excellent, considering that this image was acquired between 75- and solid-tumor depth within the pancreas of a live animal. (Color online only)  We found that the best imaging of the tumor in terms of detail and depth penetration was accomplished with long-working-distance objectives ( WD), mainly water dipping lenses. To maintain an adequate water layer between the objective and the tissue, an optical trough had to be fabricated. The sides of the trough were machined from stainless steel, and a -thick glass slide was fixed to the steel frame with RTV silicone. However, the dipping lenses were not designed to compensate for spherical aberration induced by light refraction by the coverslip. Therefore, to minimize these effects, the coverslips were thin and made from low refractive index plastic. The trough was used as a coverslip and not filled with fluid for the long-working-distance dry lens. When features of interest were acquired, the microscope stage was held stationary, the and lenses were moved into place, and the trough was filled with PBS. Higher magnification 2-P imaging proved quite feasible with the externalized pancreas preparation. Figure 6b is a digitally magnified image of individual cells engaging adjacent blood vessels. 3.2.2.High resolution long-working-distance multiphoton imaging complements other imaging platformsMultiphoton imaging of the developing tumors in whole, live mice demonstrates very high resolution of the tumor cell architecture (Figs. 6 and 7 ). The multiphoton images revealed cell morphology, while the OV100 showed an overview of blood vessel development and tumor growth. Fig. 7An example of the feasibility of dual color labeling with multiphoton systems, which also illustrates how the multiphoton and OV100 imaging systems offer complementary information about tumor morphology in live mice. Animals inoculated with a mixture of cells expressing either dsRed2 or GFP into the pancreas were imaged using both the Olympus OV100 (a) and (b) or (c) the multiphoton microscope. The OV100 facilitates imaging the entire tumor and gives information regarding the position of the different cell populations within the tumor as a whole, while the multiphoton microscope gives highly detailed images of the in vivo interactions of the different cell populations within the tumor parenchyma. Moreover, the 2-P system was able to effectively discriminate between the two colors. The OV100 scale bars represent (a) and (b) , and the 2-P scale bar denotes approximately . (Color online only.)  Low and high magnification images acquired with the OV100 variable magnification fluorescence system show the general position and size of the pancreatic tumor in the living mouse. The multiphoton, however, provides imaging of cellular extensions (Figs. 6 and 7) and details relating to tumor vessels, such as the entry of cells into vessels. The data obtained show the feasibility of multiphoton imaging, with the custom rebuilt microscope, of a mixed population of cells that stably express either GFP or dsRed fluorophores (Fig. 7). The color cross talk between channels can be minimized by a judicious selection of color filters, although more expensive options, such a tunable liquid crystal filters are available.29 We were able to significantly reduce cross talk in our multiphoton system using a combination of filters that included an extended long pass, laser-grade long-pass dichroic mirror (reflects , transmits ), a 2-P emission splitter (reflects , transmits 605/70), a GFP filter (transmits ), and an m-cherry filter (transmits ). 3.2.3.Imaging of labeled T-cells within lymph nodesLymph nodes are a comparatively dense tissue and thus it is a challenge to image the interior of these structures. Our instrument was able to image numerous T-cells at , and even at , which was completely through the main thickness of the node [Figs. 8a and 8b ]. Nuclei and cellular structures are not visible with the kind of fluorescent labeling used for these experiments, but cellular extensions were identifiable when the -deep images were digitally magnified [Fig. 8c]. In comparison, a commercially available descanned system was used to image precisely the same type of lymph node preparation, but was able to obtain images only to depth, and detected fewer cells [Fig. 8d]. Moreover, the stage on the descanned microscope accommodated our lymph node physiology hardware only with difficulty. Fig. 8(a) and (b) are, respectively, a FN-1 nondescanned 2-P image of fluorescently labeled T-cells deep within a murine lymph node, and a similar image taken at (scale ). (c) is the digitally-magnified -deep image showing individual cells with protrusions (arrow, scale ). (d) shows a comparable image acquired with a commercially available descanned 2-P system. The imaging depth is approximately . Note that fewer cells can be seen and the image quality is inferior to that of our non-descanned FN-1 2-P system (scale ).  4.DiscussionThe extended-working-distance multiphoton microscope described in this work is a unique instrument, and as such it offers several distinct advantages: The narrow body design and narrow bore objectives are compact and, as we demonstrated, the microscope offers considerable room for live animal imaging, for physiological hardware, and for sample navigation. The upright design allows irrigation of specimens and permits hardware to be advanced into the specimen field while being imaged through the microscope. Moreover, long-working-distance dipping objective lenses may be used on specimens because of the upright configuration. The microscope redesign was based on extensive background research and was kept as simple as was practicable. Optical tests confirmed 2-P imaging, and excellent in vivo images were acquired with penetration to at least , which is superior to many 2-P systems. The greater depth achievable with our instrument was attributable to several factors: 1. the use of long-working-distance, high-IR and UV-transmission, high-NA water-dipping lenses, 2. fabricating the microscope platform into a nondescanned configuration, and 3. a carefully planned design that kept laser beam introduction and light detection optics to a simple minimum. The system described here was comparatively economical and straightforward to construct, thus making it feasible for a small laboratory to duplicate our design. AcknowledgmentsThe authors wish to thank Sharmeela Kaushal for excellent technical help with preparing the cell lines and with the OV100 imaging system. We also wish to thank Matthias Gross and Inunc Ortac of the UCSD Optoelectronic Computing Group for assistance with measuring the optical properties of the gel standard. This project was funded in part by NIH Grants No. CA103563 and 099258 (AntiCancer Inc.). ReferencesR. M. Hoffman,
“In vivo real-time imaging of nuclear-cytoplasmic dynamics of dormancy, proliferation and death of cancer cells,”
Acta Pathol. Microbiol.Immunol. Scand., 116 716
–729
(2008). https://doi.org/10.1111/j.1600-0463.2008.01036.x 0903-4641 Google Scholar
R. M. Hoffman,
“Orthotopic metastatic mouse models for anticancer drug discovery and evaluation: a bridge to the clinic,”
Invest New Drugs, 17 343
–359
(1999). https://doi.org/10.1023/A:1006326203858 0167-6997 Google Scholar
X. Fu, F. Guadagni, and R. M. Hoffman,
“A metastatic nude-mouse model of human pancreatic cancer constructed orthotopically from histologically intact patient specimens,”
Proc. Natl. Acad. Sci. U.S.A., 89 5645
–5649
(1992). https://doi.org/10.1073/pnas.89.12.5645 0027-8424 Google Scholar
R. M. Hoffman,
“The multiple uses of fluorescent proteins to visualize cancer in vivo,”
Nat. Rev. Cancer, 5 796
–806
(2005). https://doi.org/10.1038/nrc1717 1474-175X Google Scholar
R. M. Hoffman and M. Yang,
“Color-coded fluorescence imaging of tumor-host interactions,”
Nat. Protoc., 1 928
–935
(2006). https://doi.org/10.1038/nprot.2006.119 Google Scholar
R. M. Hoffman and M. Yang,
“Whole-body imaging with fluorescent proteins,”
Nat. Protoc., 1
(3), 1429
–1438
(2006). https://doi.org/10.1038/nprot.2006.223 Google Scholar
J. Condeelis and J. E. Segall,
“Intravital imaging of cell movement in tumours,”
Nat. Rev. Cancer, 3
(12), 921
–930
(2003). https://doi.org/10.1038/nrc1231 1474-175X Google Scholar
R. M. Hoffman and M. Yang,
“Subcellular imaging of in the live mouse,”
Nat. Protoc., 1 775
–782
(2006). https://doi.org/10.1038/nprot.2006.109 Google Scholar
W. Denk, J. H. Strickler, and W. W. Webb,
“Two-photon laser scanning fluorescence microscopy,”
Science, 248 73
–76
(1990). https://doi.org/10.1126/science.2321027 0036-8075 Google Scholar
K. Schenke-Layland, I. Riemann, O. Damour, U. A. Stock, and K. König,
“Two-photon microscopes and in vivo multiphoton tomographs—powerful diagnostic tools for tissue engineering and drug delivery,”
Adv. Drug Delivery Rev., 58
(7), 878
–896
(2006). https://doi.org/10.1016/j.addr.2006.07.004 0169-409X Google Scholar
B. R. Masters and P. T. So,
“Multi-photon excitation microscopy and confocal microscopy imaging of in vivo human skin: a comparison,”
Microsc. Microanal., 5 282
–289
(1999). 1431-9276 Google Scholar
P. S. Tsai, N. Nishimura, E. Yoder, E. Dolnick, G. A. White, and D. Kleinfeld,
“Principles, design, and construction of a two-photon laser-scanning microscope for in vitro and in vivo brain imaging,”
In Vivo Optical Imaging of Brain Function,
(2002) Google Scholar
W. Denk and K. Svoboda,
“Photon upmanship: why multiphoton imaging is more than a gimmick,”
Neuron, 18 351
–357
(1997). https://doi.org/10.1016/S0896-6273(00)81237-4 0896-6273 Google Scholar
E. B. Brown, R. B. Campbell, Y. Tsuzuki, L. Xu, P. Carmeliet, D. Fukamura, and R. K. Jain,
“In vivo measurement of gene expression, angiogenesis and physiological function in tumors using multiphoton laser scanning microscopy,”
Nat. Med., 7
(7), 864
–868
(2001). https://doi.org/10.1038/89997 1078-8956 Google Scholar
M. Oheim, E. Beaurepaire, E. Chaigneau, J. Mertz, and S. Charpak,
“Two-photon microscopy in brain tissue: parameters influencing the imaging depth,”
J. Neurosci. Methods, 111
(1), 29
–37
(2001). https://doi.org/10.1016/S0165-0270(01)00438-1 0165-0270 Google Scholar
G. McConnell,
“Improving the penetration depth in multiphoton excitation laser scanning microscopy,”
J. Biomed. Opt., 11
(5), 054020
(2006). https://doi.org/10.1117/1.2360593 1083-3668 Google Scholar
K. Yamauchi, M. Yang, P. Jiang, M. Xu, N. Yamamoto, H. Tsuchiya, K. Tomita, A. R. Moossa, M. Bouvet, and R. M. Hoffman,
“Development of real-time subcellular dynamic multicolor imaging of cancer-cell trafficking in live mice with a variable-magnification whole-mouse imaging system,”
Cancer Res., 66
(8), 4208
–4214
(2006). https://doi.org/10.1158/0008-5472.CAN-05-3927 0008-5472 Google Scholar
J. Paoli, M. Smedh, A. M. Wennberg, and M. B. Ericson,
“Multiphoton laser scanning microscopy on non-melanoma skin cancer: morphologic features for future noninvasive diagnostics,”
J. Invest. Dermatol., 128
(5), 1248
–1255
(2008). https://doi.org/10.1038/sj.jid.5701139 0022-202X Google Scholar
M. Sidani, J. Wyckoff, C. Xue, J. E. Seagall, and J. Condeelius,
“Probing the microenvironment of mammary tumors using multiphoton microscopy,”
J. Mammary Gland Biol. Neoplasia, 11
(2), 151
–163
(2006). https://doi.org/10.1007/s10911-006-9021-5 Google Scholar
S. Celli and P. Busso,
“Intravital two-photon imaging of T-cell priming and tolerance in the lymph node,”
Immunological Tolerance: Methods and Protocols, Series: Methods in Molecular Biology, 380 355
–363 2007). Google Scholar
M. Miller, S. Wei, I. Parker, and M. Cahalan,
“Two-photon imaging of lymphocyte motility and antigen response in intact lymph node,”
Science, 296
(5574), 1869
–1873
(2002). https://doi.org/10.1126/science.1070051 0036-8075 Google Scholar
A. Majewska, G. Yiu, and R. Yuste,
“A custom-made two-photon microscope and deconvolution system,”
Eur. J. Physiol., 441 398
–408
(2000). https://doi.org/10.1007/s004240000435 0031-6768 Google Scholar
A. Diaspro, G. Chirico, and M. Collini,
“Two-photon fluorescence excitation and related techniques in biological microscopy,”
Q. Rev. Biophys., 38
(2), 97
–166
(2005). https://doi.org/10.1017/S0033583505004129 0033-5835 Google Scholar
H. Patterson and D. Piston,
“Photobleaching in two-photon excitation microscopy,”
Biophys. J., 78 2159
–2162
(2000). https://doi.org/10.1016/S0006-3495(00)76762-2 0006-3495 Google Scholar
M. Oheim, D. J. Michael, M. Geisbauer, D. Madsen, and R. H. Chow,
“Principles of two-photon excitation fluorescence microscopy and other nonlinear imaging approaches,”
Adv. Drug Delivery Rev., 58 788
–808
(2006). https://doi.org/10.1016/j.addr.2006.07.005 0169-409X Google Scholar
T. Collier, D. Arifler, A. Malpica, M. Follen, and R. Richards-Kortum,
“Determination of epithelial tissue scattering coefficient using confocal microscopy,”
IEEE J. Sel. Top. Quantum Electron., 9
(2), 307
(2003). https://doi.org/10.1109/JSTQE.2003.814413 1077-260X Google Scholar
D. L. Wokosin,
“Pulse duration spectra and measurements for laser scanning microscope systems,”
Proc. SPIE, 5700 1
–13
(2005). https://doi.org/10.1117/12.591167 0277-786X Google Scholar
S. R. Keatings, W. Zhang, and G. McConnell,
“Characterization of microscope objective lenses from to evaluate performance for long-wavelength nonlinear microscopy applications,”
Microsc. Res. Tech., 71 517
–520
(2008). https://doi.org/10.1002/jemt.20580 1059-910X Google Scholar
R. Lansford, G. Bearman, and S. Fraser,
“Resolution of multiple green fluorescent protein color variants and dyes using two-photon microscopy and imaging spectroscopy,”
J. Biomed. Opt., 6
(3), 311
–318
(2001). https://doi.org/10.1117/1.1383780 1083-3668 Google Scholar
|


