|
|
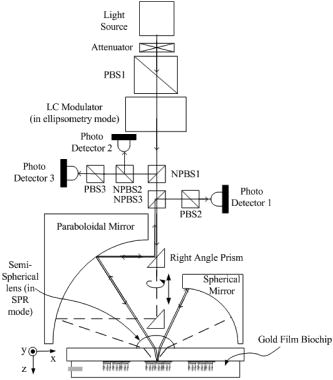
1.IntroductionEllipsometry is a versatile and powerful optical technique for investigating the dielectric properties of thin films. It has the unique ability to measure the optical parameters of thin film due to its high sensitivity to surface properties. The advantage of ellipsometry is that it is a noninvasive tool that can measure the surface concentration variation of biomedical reactions by measuring the ellipsometric parameters at high speed and with high accuracy. In addition, the thickness as well as the concentration of multilayered samples can easily be resolved. In 1978, Cuypers detected the proteins between a solid and a liquid using ellipsometry.1 In 1985, Nygren and Stenberg utilized ellipsometry to confer the binding ability of antibodies with a solid surface in an ELISA (enzyme-linked immunosorbent assay) interaction.2 In 1999, Trotter and Ostroff3 published the results of optical immunoassay measurements utilizing fixed-polarizer ellipsometry, obtaining a resolution up to . Therefore, based on previous work concerning ellipsometry in biology, it appears to be possible to extend ellipsometry to biochip system applications without difficulty.4, 5, 6 Surface plasmon resonance (SPR) technology is often used to detect and measure small surface or interface changes. SPR has become a very important and sensitive optical probe measurement tool for noninvasive detection since resolutions can be obtained at the nanogram per milliliter level. Compared with ELISA, affinity chromatography, or equilibrium dialysis, SPR technology offers two distinct advantages: first, SPR can monitor the reaction of biological molecules in real time, and second, SPR does not require the biological molecules to be labeled. Overall, the layout required of an SPR is simpler when compared to an ellipsometer configuration. However, an ellipsometer provides better performance in terms of resolution and sensitivity. To obtain the best of both technologies, ellipsometry and SPR were integrated into one system to provide more exact measurements and to provide a wider application range. By using ellipsometry to measure SPR phenomenon, the SPR resolution can be significantly enhanced and more detailed information can be obtained for further biotech analysis.7, 8, 9, 10, 11, 12, 13 Here, we detail the design and performance of a multifunctional biochip measuring system. Based on the application requirements, it is possible to choose from one of the three optical modes offered by the system: ellipsometer, SPR, or ellipsometric SPR (ESPR). 2.System DesignThe newly developed system, which includes a new optical system and a corresponding biochip, is detailed as follows. 2.1.Configuration of the Optical ArrangementBy combining an ellipsometer with an SPR feature, two of the most powerful optical techniques for measuring complex refractive indices and the thicknesses of thin films, we developed an innovative bioapparatus (see Fig. 1 ). This newly developed system can be applied to the metrology of optical properties of immobilized biomolecular monolayers as well as for biomolecular interaction analysis on a biochip. Extending from a conventional PMSA (polarizer, modulator, sample, and analyzer) configuration in ellipsometry, our apparatus adopts a phase modulation technique by using an electrically driven LC (liquid crystal) modulator and an incident-angle-controlling optomechanical mechanism that contains a reflective paraboloidal mirror and a reflective spherical mirror to vary the incident angle from . The paraboloidal mirror surface was defined as (millimeters is the unit of measurement). The focal length of the paraboloidal mirror varied between 30.2 and , depending on the incident direction of the light beam. With this paraboloidal lens-based design, the angle control was transformed to a linear stage-type movement control, and the SNR was enhanced since the object beam was reflected by the sample twice. To achieve a high precision measurement, two sets of six-axis-adjusting optomechanisms were designed to enable the focus of the reflective paraboloidal mirror and the center of the reflective spherical mirror to be at the same spot on the specimen. By applying a accuracy servomotor to carry a triangle prism with the motor set, angular control accuracy was achieved. Moreover, the interrogation angle could be calibrated accurately by identifying Brewster’s angle and the SPR angle. To enhance the system metrological repeatability, a self-calibration method was created to eliminate a nonuniform effect due to the system assembly and component fabrication. In our newly developed ESPR apparatus, three different optical paths can be chosen under the ellipsometry mode: one for measuring the main optical path and two for taking calibrations of the light source. In measuring the optical path, a -wavelength laser diode was used as the light source and a polarizer was implemented as the attenuator to control the intensity of the incident light beam. A polarizing beamsplitter PBS1 was used as the polarizer in the PMSA configuration and oriented at with respect to the horizontal axis. An LC modulator was used to modulate the polarization state of the incident light by varying the input voltage and where the fast axis was oriented at to the horizontal axis. The beam passed through two nonpolarizing beamsplitters (NPBS1 and NPBS3), and was then reflected by a right angle prism where the light impinged onto the paraboloidal mirror. Once the beam was reflected by the mirror, the light beam was incident on the surface of the sample. The light beam was then reflected by the sample to a -focal-length spherical mirror, which then traveled along the same path but along the opposite direction. After reflection by the sample, the paraboloidal mirror and the right angle prism again, the returning beam then went into the NPBS3 and split into two beams. One beam went straight through as wasted light, while the other beam was reflected into polarizing beamsplitter PBS2 and utilized as the analyzer in the PMSA configuration, which was oriented at with respect to the horizontal axis. Finally, the beam was incident at photodetector 1, and this signal was used to retrieve the ellipsometric parameters. In our apparatus, the focus of the paraboloidal mirror and the center of the spherical mirror were aligned to the same position. When the path of the incident beam was parallel to the optical axis of the paraboloidal mirror, the incident angle of the sample could be changed when the right angle prism moved vertically. The angle control was transferred to the stage-type movement control in this design. Note that the combination of a paraboloidal mirror and a spherical mirror provides us with an optical configuration that maintains the position of the last photodiode for different incident light angles. In other ellipsometric configurations, users must calculate the true incident light angle by using Snell’s law and must adjust the photodiode position accordingly. All of these procedures are very inconvenient and complicated, including some steps that do not seem logical or make any sense. In our newly developed system, the second and the third optical paths were designed for taking calibrations of the light source. The beam of the second optical path was reflected by two nonpolarizing beamsplitters (NPBS1 and NPBS2) and incident on photodetector 2 after passing the LC modulator. The signal can be used to monitor the intensity variation of the laser diode and calibrate the signal detected by photodetector 1. For the third optical path, the beam was reflected by a nonpolarizing beamsplitter NPBS1. The beam passed a nonpolarizing beamsplitter NPBS2 and a polarizing beamsplitter PBS3, which was oriented at with respect to the horizontal axis. Finally, the beam was incident on photodetector 3, and a signal was used to retrieve the polarization state of the object beam modulated by the LC modulator. Under the SPR mode in the ESPR apparatus, the LC modulator was removed and polarizing beamsplitter PBS1 was rotated to enable the incident light beam to possess the required -polarized state since the surface plasmon waves (SPWs) propagate only along the TM electric-magnetic wave. Two different optical paths exist in this mode. The first is the main measuring optical path and is almost the same as in the ellipsometry mode except for the configuration of the sample. Once the beam is reflected by the paraboloidal mirror, the light beam becomes incident on the sample after passing through the spherical lens placed on top of the -thick SF2 glass. It finally becomes focused on the interface between the metallic thin film and the sample. Under this mode, the focus of the paraboloidal mirror, the center of the semispherical lens, and the center of the spherical mirror are aligned to the same position. Moreover, the signal detected by photodetector 2 in the second optical path can also be used to monitor the intensity variation of the laser diode and to calibrate the signal detected by photodetector 1 as in the ellipsometry mode. Under the last mode of the apparatus, the ESPR mode, the three optical paths are similar to those in the ellipsometry mode except that the beam reflected by the paraboloidal mirror turns normal incident to a semispherical lens, such as when it is in the SPR mode. In this ESPR mode, the SPR phenomenon can be observed on the interface between the metallic thin film and the sample by ellipsometry. The three different modes are integrated into this automatic optical apparatus. By choosing a different function key in the operating software, the function of the apparatus can be switched between the ellipsometry mode, the SPR mode or the ESPR mode. 2.2.Biochip DesignTo design a compatible biochip, different bioreaction procedures such as the ELISA and BIA (biomolecular interaction analysis) methods were considered, as well as biochips with open-channel and closed-channel bioreaction procedures. Our biochip was designed for use with both types of channels. In addition, the pump used in conjunction with a flow channel was adopted to measure the dynamic reaction with a BIA method. The apparatus developed in our experimental setup can measure a biochip using ellipsometry and SPR collectively. Under the SPR mode, the slide material of the biochip is an important issue. To match the refractive index of the slide material with the semispherical lens, which was made of SF2 glass, the slide, which was also made of the same SF2 material, had dimensions of . One surface of the slide was coated with a gold film and bound with a biolinker above the gold film so that it became the biochip for the biointeraction. Then the biochip was put on the flat side of the semispherical lens with the surface without the gold film. The commercial refraction-index-matching liquid, Series B produced by Cargille Labs, was placed between the biochip and semispherical lens to prevent any air gaps from forming. (If air gaps exist, the gap would be a light waveguide at a large angle.) Polymethylmethacrylate (PMMA) was used to build-up a press block with a flow channel on the chip (Fig. 2 ). The size of the flow channel was and the biochemical reaction area was , which required a solution to fill the volume of the reaction area. 3.TheoryTraditionally, ellipsometry has been employed to measure the coatings of semiconductor applications or optical coating applications. SPR has been employed in measuring chemical reactions. In this paper, we look at the integration of an ellipsometer with a SPR feature to create a system that can fulfill today’s ever more stringent biotechnology measurement requirements. 3.1.EllipsometryAn ellipsometer directly measures the changes of ellipsometric parameters through materials rather than optical indices and film thicknesses. A conventional ellipsometer typically possesses a PMSA configuration and is phase-modulated (Fig. 1). Compared to a multi-wavelength ellipsometer, there are less unknown variables in this type of setup and the measurement results obtained are better. To go from measured ellipsometric parameters of materials to optical indices and film thicknesses, a material model and various numerical-inversion algorithms must be utilized. A plane electromagnetic wave incident to the substrate was orthogonally divided into a -wave (TM wave) and an -wave (TE wave), as shown in Fig. 3, where and denote the incident electromagnetic waves, while and denote the reflective electromagnetic waves. In general, when the -wave or the -wave is reflected at an interface of the two media, the reflective light remains a plane wave, but the amplitude and phase both change in the -wave and -wave. The reflection coefficients of the -wave or -wave can be defined as where is the -wave reflection coefficient; is the -wave reflection coefficient; is the reflective amplitude in the -wave and is the reflective amplitude in the -wave; and is the reflective phase delay in the -wave and is the reflective phase delay in the -wave. Thus, the ellipsometric function can be defined aswhere is the amplitude attenuation, and is the phase-shift. The ellipsometric parameters are thus and .Fig. 3Different polarizations of the incident electric field and the different reflection coefficients from the ambient-substrate interface. 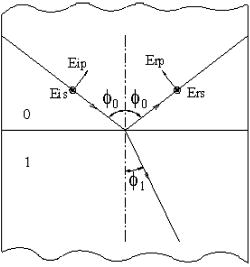 By applying a Jones matrix to each optical component to simplify calculation of the PMSA configuration, the relationship between the incident wave and the reflective wave can be seen as The Jones matrix can be seen as: In Eqs. 5, is the retardant phase of the modulator, while , , and are the corresponding inclined angles of the optical axes in a polarizer, modulator, and analyzer. With incident light , and as the light that passes all the elements,where the intensity of the can be seen asThe light intensity can be simplified into three terms: dc, , and . By modulating the phase , the light intensity can be accordingly measured and the three coefficients, , , and obtained. The ellipsometric parameters and can then be evaluated using After and are obtained, other parameters such as the thickness, the relative indices, and the extinction coefficients can also be obtained by utilizing a reverse calculation of the thin film model. When more than one optical layer exists on the sample, we can obtain the ellipsometric parameters and for each layer and then solve for the unknowns by varying the incident angles.14, 15, 163.2.Surface Plasmon ResonanceThe SPR configuration embedded in Fig. 1 is similar to a traditional prism-coupler structure. Two conditions were required to excite the SPW in this experimental setup. First, the SPW interface was composed of two materials of dielectric constants with opposite signs. Hence the wave number of SPW, , can be defined as: where is the wave vector in free space, is the dielectric constant in a dielectric material, is the dielectric constant in a metal, is the refractive index of a dielectric material, and is the refractive index of a metal.The second requirement is that the wave number of the incident light must satisfy Eq. 10, and changes according to the variation of the incident angle. If the concentration of the sample changes, also changes to meet . This means that the SPW occurs at different incident angles. Thus, we can obtain the biomolecular reaction by a change in the incident angle. 4.Experimental SetupOur experimental setup, which includes repeatability, open-channel bioreactions, and closed-channel bioreactions, are detailed here. 4.1.RepeatabilityWe used distilled [deionized (DI)] water for our repeatability tests. When the ESPR mode was adopted in our experimental setup, the repeatability of the ellipsometry mode, the SPR mode, and the ESPR mode can be proven at the same time (see Fig. 4 ). The results indicate that the curves of the ellipsometric parameters and both show good repeatability in the SPR phenomenon by the ellipsometer in the ESPR mode. 4.2.Bioreaction Experimental ProceduresWe used human immunoglobulin (human IgG) and human antigen immunoglobulin (human Anti-IgG) as the biosamples in our experimental setup. The biolinker activating reagent was composed of NHS ( -hydroxysuccinimide) and EDC [1-Ethyl-3-(3-dimethylaminopropyl) carbodiimide hydrochloride] with a mix ratio of 1:1. A solution of EA ( ethanolamine hydrochloride) was used as the blocker and phosphate buffer saline (PBS) with pH 7.2 was the buffer liquid. The procedures for the open-channel bioreactions are detailed as follows:
The biosamples in our experimental setup were performed with the same open-channel and closed-channel bioreaction methods. The flow rate for all the reagents and buffer was . The procedures of the closed-channel bioreaction method are detailed as follows:
4.3.Bioreaction Experimental ResultsTwo bioreaction procedures, an open-channel and a closed-channel bioreaction, were carried out respectively. The reaction occurring between the reactive reagent and the sample in a static state was observed by performing an open-channel bioreaction. A dynamic equilibrium was obtained when the closed-channel bioreaction was carried out in a continuous fluid flow state.17, 18, 19 4.3.1.Open-channel bioreaction experimental set-upA thiol-linker of eight carbon chains was first bound onto the biochip with a gold film. Then, the activation reagent (EDC/NHS), human immunoglobulin (human IgG, ), EA ( , ethanolamine hydrochloride), and human immunoglobulin antigen (human Anti-IgG, ) were added in sequence. Among each reagent, a PBS of pH 7.2 was added as the buffer solution. The detailed experimental steps are described in the following. The bioreaction curve under the SPR mode (see Fig. 5 ) shows that the result depends on the optical properties of the immobilized biomolecular monolayers as well as on the biomolecular interaction on the biochip. As can be seen from the figure, the SPR resonance angle changed slightly with the different biomolecular links and reactions, eventually with the SPR resonance angle becoming even larger. The results show that the signals resulting from the open-channel bioreaction can be measured under the SPR mode. Fig. 5Results of open-channel bioreaction curve in the SPR mode showing the dependence on the optical properties of immobilized biomolecular monolayers as well as biomolecular interaction on the biochip.  Figure 6 shows the bioreaction curve measured from the reaction steps in the same biochemical reactions under the ellipsometry mode. The ellipsometric parameters and changed during each reaction step. The existing biochemical reactions can be proved by the signal variations. It can provide further information about closed-channel biological reactions in a microfluid system. Under this mode, the sample required being dehydrated by an air gun for the ellipsometric measurement and this was the major cause for the errors in the setup. The SNR probably decreased as a result of the drying procedure. Fig. 6Results of open-channel bioreaction in the ellipsometry mode showing existing biochemical reactions by signal variations: (a) ellipsometric parameter at varying incident angles and (b) ellipsometric parameter at varying incident angles.  Figure 7 shows the bioreaction curve under the ESPR mode. The SPR resonance angle increased as the biological reaction took place on the same process. The ellipsometric parameter appears to provide a better sensitivity than the ellipsometric parameter . In addition, the ellipsometric parameter changed significantly at the incident angle of , which was observed both in the experimental results and in the numerical simulations.20, 21 4.3.2.Closed-channel bioreaction experimental setupIn the closed-channel reaction process, the reagent was injected into the channel continuously at a constant flow rate of . Afterward, the buffer and sample passed through the reaction region of the biochip. As shown in Fig. 8, the response curve shows the angle shifts before and after the IgG and Anti-IgG reactions in the SPR mode. Under the ESPR mode, Fig. 9 shows the results of the measured ellipsometric parameters at the angle near the SPR resonance angle when the closed-channel bioreaction procedure was adopted. The results show that the ellipsometric parameter was more sensitive than , and its SNR was also higher. It can be illustrated that the resolution of the ellipsometric parameter was one order higher than the ellipsometric parameter . From our measurements, it appears that the ellipsometric parameter benefited from an enhanced resolution since the obtained reaction signals were superior to the results obtained under the SPR mode. These results can be explained by the definition of our ellipsometric parameters. The ellipsometric parameter represents the intensity change and matches the angle modulation SPR detection. On the other hand, the ellipsometric parameter represents the phase change and matches the phase modulation of the SPR detection. Therefore, the ellipsometric parameter can achieve a higher resolution and higher SNR. In summary, by using ellipsometry to observing a SPR phenomenon, we can undertake both angular modulation and phase modulation of the SPR simultaneously. 5.ConclusionsWe designed a new multifunctional bioapparatus that integrates an ellipsometer with an SPR technique. In our new design, a paraboloidal mirror and a spherical mirror were adopted to vary the incident angle. We also incorporated an LC phase modulator to control the incident light beam polarization. A reference optical path was used to calculate the phase modulated by the LC. A flow-injection system was used to supply the biosamples to the biochip. An important function of this apparatus uses an ellipsometric configuration to observe the SPR phenomenon. In the specific mode, the ellipsometric parameter can achieve the same resolution as a phase SPR technology. Similarly, the ellipsometry parameter can provide the same resolution as a traditional SPR technology. Moreover, in this new apparatus, the features of the ellipsometer enable us to obtain more detailed information for further biotech analysis and achieve sensitivity of the developed biochip system at resolutions up to . Thus, it is now possible to obtain detailed information such as film thickness, physical parameters, concentration, kinetic constants, binding specificity, etc. for applications. In summary, our new ESPR system provides us with a new measurement tool for biotechnology analysis and can serve as both a research and development tool and a manufacturing tool for various biomedical applications. AcknowledgmentsThe authors would like to acknowledge the continuous and generous financial support of this research from the National Science Council of Taiwan, through Projects NSC92-2323-B-002-002-, NSC93-2323-B-002-012-, and NSC94-2323-B-002-016-. The authors would also thank the members of the MEMS Lab at the Institute of Applied Mechanics of National Taiwan University for their help and suggestions. ReferencesP. A. Cuypers, W. Th. Hermens, and H. C. Hemker,
“Ellipsometry as a tool to study protein films at liquid-solid interfaces,”
J. Appl. Biochem., 84 56
–67
(1978). 0161-7354 Google Scholar
H. Nygren and M. Stenberg,
“Calibration by ellipsometry of the enzyme-linked immunosorbent assay,”
J. Immunol. Methods, 80 15
–24
(1985). https://doi.org/10.1016/0022-1759(85)90159-0 0022-1759 Google Scholar
B. Trotter and R. Ostroff,
“Fixed-polarizer ellipsometry, a simple technique to measure the thickness of very thin films,”
Opt. Eng., 38 902
–907
(1999). https://doi.org/10.1117/1.602049 0091-3286 Google Scholar
J. H. Lee, C. K. Lee, C. H. Lin, S. J. Chen, S. S. Lee, and S. C. Shiue,
“Optical mechanism for precisely controlling the angle of an incident light beam within a large incident angle range,”
(2001) Google Scholar
H. Elwing,
“Protein absorption and ellipsometry in biomaterial research,”
Biomaterials, 19 397
–406
(1998). https://doi.org/10.1016/S0142-9612(97)00112-9 0142-9612 Google Scholar
F. Abelès,
“Surface electromagnetic waves ellipsometry,”
Surf. Sci., 56 237
–251
(1976). https://doi.org/10.1016/0039-6028(76)90450-7 0039-6028 Google Scholar
C. F. Eagen and W. H. Weber,
“Modulated surface-plasmon resonance for absorption studies,”
Phys. Rev. B, 19
(10), 5068
–5086
(1979). https://doi.org/10.1103/PhysRevB.19.5068 0163-1829 Google Scholar
J. Homola, S. S. Yee, and G. Gauglitz,
“Surface plasmon resonance sensors: review,”
Sens. Actuators B, 54 3
–15
(1999). https://doi.org/10.1016/S0925-4005(98)00321-9 0925-4005 Google Scholar
B. Liedberg, I. Lundstorm, and E. Stenberg,
“Principles of biosensing with an extended coupling matrix and surface plasmon resonance,”
Sens. Actuators B, 11 63
–72
(1993). https://doi.org/10.1016/0925-4005(93)85239-7 0925-4005 Google Scholar
P. Gomes and D. Andreu,
“Direct kinetic assay of interactions between small peptides and immobilized antibodies using a surface plasmon resonance biosensor,”
J. Immunol. Methods, 259 217
–230
(2002). 0022-1759 Google Scholar
C. Y. Yang, E. Brooks, Y. Li, P. Denny, C. M. Ho, F. Qi, W. Shi, L. Wolinsky, B. Wu, D. T. W. Wong, and C. D. Montemagno,
“Detection of picomolar levels of interleukin-8 in human saliva by SPR,”
Lab Chip, 5 1017
–1023
(2005). 1473-0197 Google Scholar
B. C. Huang, S. Davern, and S. J. Kennel,
“Mono and bivalent binding of scFv and covalent diabody to murine laminin1 using radioiodinated proteins and SPR measurements: effects on tissue retention in vivo,”
J. Immunol. Methods, 313 149
–160
(2006). 0022-1759 Google Scholar
C. W. Lin, K. P. Chen, C. N. Hsiao, C. K. Lee, and S. M. Lin,
“Design and fabrication of an alternative dielectric multilayer device for surface plasmon resonance sensor,”
Sens. Actuators B, 113 169
–176
(2006). https://doi.org/10.1016/j.snb.2005.02.044 0925-4005 Google Scholar
M. A. Azzam, and N. M. Bashara, Ellipsometry and Polarized Light,
(1988) Google Scholar
C. W. Chu, C. C. Lee, I. Y. Fu, J. C. Hsu, and Y. Y. Liou,
“Phase-shifting ellipsometer,”
Jpn. J. Appl. Phys., 33
(1), 4769
–4772
(1994). 0021-4922 Google Scholar
E. Huber, N. Baltzer, and M. von Allmen,
“Polarization modulation ellipsometry: a compact and easy handling instrument,”
Rev. Sci. Instrum., 56
(12), 2222
–2227
(1985). https://doi.org/10.1063/1.1138403 0034-6748 Google Scholar
P. G. Snyder, M. C. Rost, G. H. Bu-Abbud, and J. A. Woollam,
“Variable angle of incidence spectroscopic ellipsometry: application to GaAs-AlxGa1-x as multiple heterostructures,”
J. Appl. Phys., 60 3293
–3302
(1986). https://doi.org/10.1063/1.337695 0021-8979 Google Scholar
P. Westphal and A. Bornmann,
“Biomolecular detection by surface plasmon enhanced ellipsometry,”
Sens. Actuators B, 84 278
–282
(2002). https://doi.org/10.1016/S0925-4005(02)00037-0 0925-4005 Google Scholar
L. P. Lin, L. S. Huang, C. W. Lin, C. K. Lee, J. L. Chen, S. M. Hsu, and S. Lin,
“Determination of binding constant of DNA-binding drug to target DNA by surface plasmon resonance biosensor technology,”
Curr. Drug Targ., 5 61
–72
(2005). Google Scholar
X. L. Yu, D. X. Wang, and Z. Yan,
“Simulation and analysis of surface plasmon resonance biosensor based on phase detection,”
Sens. Actuators B, 91 285
–290
(2003). https://doi.org/10.1016/S0925-4005(03)00105-9 0925-4005 Google Scholar
, Optical Thin Film Software: Getting Started Manual, Professional Version,
(1994) Google Scholar
|