|
|
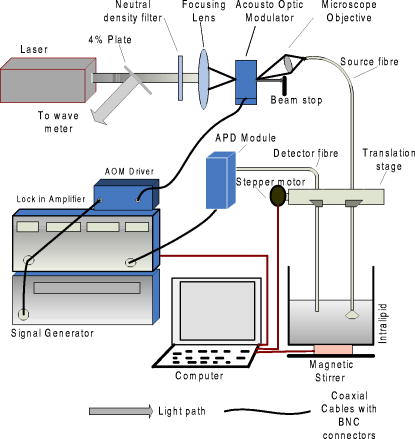
1.IntroductionLight transport in turbid media has been a focus of intense research because of its application in the biomedical, chemical, and pharmaceutical fields as well as for nondestructive quality assessment of agricultural produce.1, 2, 3, 4 The propagation of light in turbid media is generally described by the diffusion approximation to radiative transport theory,5 which characterizes turbid media by the absorption and reduced scattering coefficient . A comprehensive overview of diffuse light transport was recently presented by Jacques and Pogue.6 In many studies, phantoms that mimic the optical properties of human or animal tissue are investigated.7 A common liquid phantom used to simulate scattering properties of biological tissue is Intralipid®, but the optical properties reported in the literature show considerable variation.8 Because of the discrepancies in the results, there has been an effort to assess the performance of the instruments that measure these optical properties.9 The authors reported measurements made in a solid phantom with eight different instruments and found that the reduced scattering coefficient varied by up to 41% at some wavelengths. Measurement techniques can be grouped into continuous wave, time domain, and frequency-domain methods; however, a frequency-domain instrument was not included in that study. The frequency domain technique employs an intensity-modulated source to separate the effect of absorption and scattering in turbid media.10 The modulation frequencies typically extend from a few megahertz to a few hundred megahertz. The modulated light generates a density wave of diffuse photons inside the medium. The characteristics of this wave depend on the modulation frequency and optical properties of the medium. If measurements of phase and amplitude are collected for at least two modulation frequencies or two path lengths, the optical properties of the medium can be calculated. Sun 11 showed that calculating optical properties from ac amplitude and phase measurement at multiple source-detector separations gives the most accurate results, but they found the precision of these measurements is poorer than the multifrequency approach. Currently all the frequency-domain instruments report optical properties of Intralipid® at a few discrete wavelengths. These wavelengths are often constrained to the availability of semiconductor diode lasers: Coquoz 12 report at 674, 811, and ; Madsen 13 at ; Xu and Patterson14 at ; and Bevilacqua 15 at 672, 800, 806, 852, 896, 913, and . In this paper, we describe a broadband tunable instrument to estimate the absorption and reduced scattering coefficients of turbid media from measurements of ac amplitude and phase at a range of optical path lengths in the medium. A tunable, continuous wave, titanium-sapphire laser was used to enable measurements across a wide range of wavelengths, . The laser is modulated using an acousto-optic modulator. The setup was tested by measuring the optical properties of Intralipid®-20%, at five dilutions, in the therapeutic window between 710 and at intervals. The instrument performance was evaluated by comparing the measured optical properties with published data and Mie theory predictions based on particle size measurements. 2.TheoryLight transport in highly scattering media is generally analyzed using the diffusion approximation to the Boltzmann transport equation.5, 16 Fishkin 17 suggested the propagation of modulated light inside turbid media could be used to estimate optical properties. Fishkin and Gratton10 reported a solution to the diffusion equation for a sinusoidal intensity modulated point source and obtained an expression for the photon density at a distance from the source. From this, the following expressions for absorption and reduced scattering coefficients were calculated.18 Here, is the angular frequency of the source modulation, is the speed of light in the medium, is the slope of the phase plotted against the source-detector separation , is the slope of plotted against ; and is the amplitude of the photon density wave a distance from the source.3.MethodThe experimental setup is illustrated in Fig. 1 . The instrumentation is a phase-sensitive detection system that measures the amplitude and phase of modulated light propagating through a liquid medium. A tunable laser is used to obtain measurements from in intervals. The light source consists of a continuous wave titanium-sapphire laser (899-LC, Coherent, USA), which is tunable from . The titanium-sapphire laser is pumped by a frequency-doubled, solid state laser (Verdi-V5, Coherent, USA). The operating wavelength is monitored by diverting a small fraction of the beam to a wavemeter (WA 1150, Burleigh, USA) using a glass plate. The beam amplitude is modulated at using an acousto-optic modulator (AOM; GPM 800-200-950, Brimrose, USA) and a fixed-frequency driver (FFA-800-B1-F1, Brimrose, USA). The modulation signal is supplied by a high-frequency signal generator (SMY-02, Rohde & Schwarz, Germany). The beam is focused into the acousto-optic crystal using a -focal-length lens with an antireflection coating. The modulated source is delivered to the turbid sample via an optical fiber with a numerical aperture of 0.48 (air) and core diameter of (BFL 48-1000, Thorlabs, USA). A microscope objective couples the output of the AOM into the fiber. A second identical fiber collects light transmitted through the sample for measurement by an avalanche photodiode (APD) module (C5331-30, Hamamatsu, Japan). Both optical fibers face down into the solution and are threaded through stainless steel tubes (diameter ) to provide rigidity. The source fiber is fixed at the center of the sample; the collection fiber is mounted on a translation stage. The distance between the source and collection fibers is computer controlled to a precision better than . The minimum separation possible with our setup is . The amplitude and phase shift of the transmitted signal is measured using a lock-in amplifier (SR844, Stanford Research Systems, USA). A phase reference for the lock-in is obtained from the source modulation signal. Typical amplitude measurements are between and , with an intrinsic noise floor of . The lock-in amplifier and translation stage are controlled by custom software implemented in LabView (National Instruments, USA) and MATLAB (The Math Works, USA) for automatic data collection. To validate the instrument performance, the optical properties of the tissue phantom Intralipid®-20% (Pharmaco, New Zealand) were measured after dilution with distilled water to lipid concentrations of 0.94, 1.80, 2.59, 3.32, and (w/w). Measurements were made in a large ( , -diam, -height) stainless steel pot filled with of solution. To prevent settling and maintain a uniform temperature distribution, the solution was gently stirred with a magnetic stirrer (VELP Scintifica, Italy). A loose polythene sheet covered the top of the steel pot to prevent water evaporation. The temperature of the solution was monitored during measurements and found to be throughout the experiment. The distance between source and detector fibers was varied from in steps. Five replicate measurements of amplitude and phase delay were collected at each position. The optical properties were calculated from these measurements at each wavelength and concentration using Eq. 1. To provide a separate estimate of the reduced scattering coefficient of the turbid sample, the particle size distribution of a 1% solution of our Intralipid®-20% stock solution was measured using a Mastersizer 2000 (Malvern Instruments Ltd., UK). The reduced scattering coefficient was calculated from the particle size distribution using Mie theory.19, 20 4.ResultsFigure 2 illustrates the ac amplitude and phase measured at a wavelength of for 10 replicate measurements at five concentrations. Both the phase and the logarithm of source-detector separation multiplied by ac amplitude vary linearly with source-detector separation. The amplitude was normalized to at and phase shift was normalized to at for clarity. This eliminates small source drifts between measurements from the plot, but does not affect the optical properties reported here, which are all based on slopes. Fig. 2(a) Logarithm of source-detector separation times normalized ac amplitude and (b) normalized phase variation versus source-detector separation at for five Intralipid® concentrations.  Across all wavelengths, we observed that the magnitude of the amplitude-separation slope increased with concentration. The same was true for phase, which also showed a consistent relationship with concentration. The particle size distribution measured with the Mastersizer 2000 is plotted in Fig. 3 . The particle distribution of Intralipid®-10% reported by van Staveren 19 is included for comparison. We have presented the particle distribution as a volume fraction here, as particle size, rather than mass, more directly affects scatter cross section; the large number of small particles identified by van Staveren 19 will make only a small contribution to the reduced scattering coefficient. Both results show consistency in a peak particle size between 200 and . The peak in van Staveren’s19 data around is caused by noise in their data, which is exaggerated for small numbers by our conversion from number density to volume fraction. Fig. 3Volume fraction of Intralipid®-20% particles measured with a Mastersizer 2000. This distribution is used in our Mie theory calculations. Data by van Staveren,19 converted to volume fraction, are included for comparison.  The average absorption and reduced scattering coefficients at each concentration and wavelength were calculated using Eq. 1. Errors were estimated by propagation of uncertainties from the replicate measurements. The calculated absorption coefficient is plotted in Fig. 4 . It shows a characteristic water absorption peak around and the tail of the water absorption peak, as might be expected from a solution that is predominantly water. In general, the absorption coefficient decreases as the concentration of Intralipid® increases. The absorption coefficient of 0.53% (solid fraction) Intralipid®-10%, reported by Pifferi,21 is included for comparison. Pifferi 21 used time-correlated single-photon counting to obtain their estimate of the absorption coefficient. The absorption coefficient agrees in shape but is lower from and higher from than our results. This is not consistent with the relationship between concentration and absorption observed in our data; we will explore this further below. Fig. 4Absorption coefficient of Intralipid. Data reported by Pifferi 21 (solid line) are included for comparison. The error bars indicate a 95% confidence interval.  Figure 5 shows the reduced scattering coefficient calculated from the frequency-domain measurements and Mie theory using the particle size distribution plotted in Fig. 3. Intralipid® concentrations of 0.94, 2.59, and 4% were used in the Mie theory calculation to facilitate comparison with the frequency-domain result. Again, there is a clear correlation with the reduced scattering coefficient increasing as Intralipid® concentration increases. Both frequency-domain and Mie results show a steady decrease in the reduced scattering coefficient as wavelength increases as reported elsewhere.15, 22 However, we found the Mie theory estimate of the reduced scattering coefficient overestimated our frequency-domain result by about 6%. This is significantly larger than the random error in the frequency-domain result (approximately 0.01%). It may reflect a systematic error in one, or both, of the methods. 5.DiscussionCollecting absorption measurements at many concentrations enabled us to extrapolate and estimate the absorption coefficient of the pure absorber. In the near-IR, the main absorbing species of Intralipid® is water,19, 23 which provides an independent validation of the absorption measurement. Water concentration was calculated by dividing the mass of water by the total mass of the Intralipid® sample to allow for soluble constituents. Figure 6 illustrates a typical relationship, measured at , between absorption and concentration. A linear fit, with 95% confidence intervals is included. For comparison, water absorption reported by six other groups24, 25, 26, 27, 28, 29 and absorption of Intralipid® (0.53%) reported by Pifferi 21 are included. In this case, the extrapolated absorption coefficient overestimates the most recent water absorption measurements by about 12%, though the error is not the same at all wavelengths. At , the measurement reported by Pifferi 21 is about 11% below the extrapolated value for 0.53% Intralipid®. However, as Fig. 4 shows, this discrepancy also varies with wavelength. Fig. 6Absorption coefficient of Intralipid® at plotted against water concentration along with literature data. The dotted lines indicate 95% confidence interval for the linear fit.  The extrapolation shown in Fig. 6 can be applied across all wavelengths to estimate the spectrum of the pure absorber (Fig. 7 ). The water absorption data reported by Kou 28 are included for comparison; these data were also measured at , include standard errors, and show good agreement with the work of Downing and Williams30 and Palmer and Williams25 who used similar methods. With water as the main absorbing constituent of Intralipid®, it is not surprising to find our extrapolated absorption coefficient closely follows that of water. However, a weighted mean difference of indicates a statistically significant discrepancy between the two data sets. This probably indicates systematic problems in the measurements or flaws in the underlying theory. We believe there are no other absorbers in Intralipid®-20% strong enough to introduce this discrepancy. In any case, we found this provides a robust, quantitative approach to validating an instrument’s measurement of the absorption coefficient. Fig. 7Extrapolated absorption coefficient (triangular markers with error bars) for water from Intralipid® measurements versus wavelength. The solid curve represents water absorption data reported by Kou 28 The error bars correspond to standard deviations.  A similar analysis can be applied to the reduced scattering coefficient, though it is not sensible to extrapolate to a pure scattering medium. At high scatter concentrations, the relationship between the scattering coefficient and concentration is not linear because individual scattering particles can mask their neighbors. Figure 8 shows the reduced scattering coefficient at plotted against Intralipid® concentration. Reduced scattering values calculated by Mie theory using our measured volume fractions are included for comparison. At lower concentrations the theory values agree well with the measured reduced scattering coefficients. As the concentration of Intralipid® increases, the measured reduced scattering coefficient drops below the Mie theory values. Previous reports31, 32 have shown that the linear relationship between reduced scattering coefficient and particle concentration breaks down at higher Intralipid® concentrations, though van Staveren 19 reported that a linear relationship between concentration and the reduced scattering coefficient holds reasonably well up to 4% at . Fig. 8Reduced scattering coefficients at versus Intralipid® concentration. The errorbars indicate 95% confidence intervals. The solid line is a linear fit to the experimental data. The dashed line shows the Mie theory results.  To compare with other published data we have linearly interpolated our data and linearly scaled literature data to 2% Intralipid® concentration, well within the linear range. Figure 9 shows the result. Included are the reduced scattering coefficient for Intralipid®-20% (2% solution) reported by other frequency domain,12, 14 time resolved,33 and continuous wave34 methods. Xu and Patterson14 report scattering data at by making measurements in diluted samples of Intralipid®-20% in water from 0.3 to 2% concentration. Coquos 12 report reduced scattering coefficients at 811 and by making measurements in a solution of Intralipid® with an added absorber. The reduced scattering reported by Spinelli 33 and Martelli and Zaccanti34 for Intralipid®-20% is scaled down to a 2% concentration for comparison. Overall, our results are in good agreement with other measured data. The scattering values reported by Chen 35 are 30% lower than our and other published results and are not included in the diagram. Fig. 9Reduced scattering coefficient (triangular markers with error bars) values for a 2% solution of Intralipid® plotted against wavelength. The solid line corresponds to the Mie theory values calculated based on our particle size measurement. Data reported at are staggered a little to make them visible. The error bars indicate 95% confidence interval.  Figure 9 also shows the reduced scattering coefficient calculated by Mie theory using our particle size measurement, as well as values derived from the van Staveren 19 Mie theory fit. Calculated values reported by Michels 36 for Intralipid®-20% are scaled down to a 2% concentration and closely follow our theoretical data. Our experimental results are below our Mie calculations by about 6%, with a larger deviation at lower wavelengths. The discrepancy between our experimental results and van Staveren’s19 values is about 11% across the whole wavelength range. This may be due to a change in size distribution because of a slight differences in manufacturing recipes for Intralipid®.36 A discrepancy between experimental and Mie theory values has also been reported for measurements in a microsphere suspension.12 The Coquoz 12 experimental results overestimated the reduced scattering by 6.5 to 28% at and 1 to 8% at compared to Mie theory values. Our results are consistent with the literature and confirm that the experimental setup is capable of measuring the absorption and reduced scattering coefficient of Intralipid®. Using acousto-optic modulation of a tunable laser in a frequency-domain photon-migration instrument is a viable approach to measure the optical properties of liquid turbid media. 6.ConclusionWe presented frequency-domain measurements from a tunable titanium-sapphire laser modulated with an AOM at . The instrument performance was evaluated with measurements of Intralipid®-20%, at five concentrations (0.94 to 4.0%), in the therapeutic window . We obtained measurements with standard errors of 1% for the absorption coefficient and less than 2.5% for the reduced scattering coefficient. We found the absorption coefficient decreased as Intralipid® concentration increased, consistent with the liquid phase being the dominant absorber. We extrapolated the relationship between absorption and concentration to estimate the absorption of the liquid phase. The absorption of the liquid phase was found to follow closely that of pure water, but overestimating it by about 10%. It was not clear from our measurements whether this difference was due to additional absorbing species in the liquid phase or systematic errors in the measurements. In either case, we found comparison with water absorption a useful technique for validation of Intralipid® measurements. We found a clear linear correlation between reduced scattering coefficient and concentration across all wavelengths. We interpolated our measurements and results reported in the literature at to a common concentration of 2%. Our results were consistent with prior literature at discrete wavelengths, within experimental error. The reduced scattering coefficient was also compared with an estimate calculated from particle-size distribution using Mie theory. We found the Mie theory calculation overestimated our frequency-domain measurement and previous reports in the literature by about 6%. These results show that a tunable laser can be used with an AOM to measure the absorbing and scattering properties of turbid liquids over a moderate wavelength range. Collecting data over a broader range than has been previously explored has aided comparison with the intrinsic properties of the turbid medium’s constituents. Potential systematic discrepancies between the different techniques have been highlighted. AcknowledgmentsWe acknowledge financial support from the University of Waikato and The Foundation for Research Science and Technology. ReferencesJ. B. Fishkin, O. Coquoz, E. R. Anderson, M. Brenner, and B. J. Tromberg,
“Frequency-domain photon migration measurements of normal and malignant tissue optical properties in a human subject,”
Appl. Opt., 36
(1), 10
–20
(1997). https://doi.org/10.1364/AO.36.000010 0003-6935 Google Scholar
A. J. Berger, V. Venugopalan, A. J. Durkin, T. Pham, and B. J. Tromberg,
“Chemometric analysis of frequency-domain photon migration data: quantitative measurements of optical properties and chromophore concentrations in multi component turbid media,”
Appl. Opt., 39
(10), 1659
–1667
(2000). https://doi.org/10.1364/AO.39.001659 0003-6935 Google Scholar
T. Pan and E. M. Sevick-Muraca,
“Volume of pharmaceutical powders probed by frequency-domain photon migration measurements of multiply scattered light,”
Anal. Chem., 74
(16), 4228
–4234
(2002). https://doi.org/10.1021/ac011267z 0003-2700 Google Scholar
R. Cubeddu, C. D’Andrea, A. Pifferi, P. Taroni, A. Torricelli, G. Valentini, C. Dover, D. Johnson, M. Ruiz-Altisent, and C. Valero,
“Nondestructive quantification of chemical and physical properties of fruits by time-resolved reflectance spectroscopy in the wavelength range ,”
Appl. Opt., 40
(4), 538
–543
(2001). https://doi.org/10.1364/AO.40.000538 0003-6935 Google Scholar
A. Ishimaru, Wave Propagation and Scattering in Random Media, 1 Academic Press, New York
(1978). Google Scholar
S. L. Jacques and B. W. Pogue,
“Tutorial on diffuse light transport,”
J. Biomed. Opt., 13
(4), 041302:1
–19
(2008). https://doi.org/10.1117/1.2967535 1083-3668 Google Scholar
B. W. Pogue and M. S. Patterson,
“Review of tissue simulating phantoms for optical spectroscopy, imaging and dosimetry,”
J. Biomed. Opt., 11
(4), 041102:1
–16
(2006). https://doi.org/10.1117/1.2335429 1083-3668 Google Scholar
A. Dimofte, J. C. Finlay, and T. C. Zhu,
“A method for determination of the absorption and scattering properties interstitially in turbid media,”
Phys. Med. Biol., 50
(10), 2291
–2311
(2005). https://doi.org/10.1088/0031-9155/50/10/008 0031-9155 Google Scholar
A. Pifferi, A. Torricelli, A. Bassi, P. Taroni, R. Cubeddu, H. Wabnitz, D. Grosenick, M. Möller, R. Macdonald, J. Swartling, T. Svensson, S. Andersson-Engels, R. L. P. van Veen, H. J. C. M. Sterenborg, J.-M. Tualle, H. L. Nghiem, S. Avrillier, M. Whelan, and H. Stamm,
“Performance assessment of photon migration instruments: the MEDPHOT protocol,”
Appl. Opt., 44
(11), 2104
–2114
(2005). https://doi.org/10.1364/AO.44.002104 0003-6935 Google Scholar
J. B. Fishkin and E. Gratton,
“Propagation of photon-density waves in strongly scattering media containing an absorbing semi-infinite plane bounded by a straight edge,”
J. Opt. Soc. Am. A, 10
(1), 127
–140
(1993). https://doi.org/10.1364/JOSAA.10.000127 0740-3232 Google Scholar
Z. Sun, Y. Huang, and E. M. Sevick-Muraca,
“Precise analysis of frequency domain photon migration measurement for characterization of concentrated colloidal suspensions,”
Rev. Sci. Instrum., 73
(2), 383
–393
(2002). https://doi.org/10.1063/1.1427303 0034-6748 Google Scholar
O. Coquoz, L. O. Svaasand, and B. J. Tromberg,
“Optical property measurements of turbid media in a small-volume cuvette with frequency-domain photon migration,”
Appl. Opt., 40
(34), 6281
–6291
(2001). https://doi.org/10.1364/AO.40.006281 0003-6935 Google Scholar
S. J. Madsen, E. R. Anderson, R. C. Haskell, and B. J. Tromberg,
“Portable, high-bandwidth frequency-domain photon migration instrument for tissue spectroscopy,”
Opt. Lett., 19
(23), 1934
–1936
(1994). https://doi.org/10.1364/OL.19.001934 0146-9592 Google Scholar
H. Xu and M. S. Patterson,
“Determination of the optical properties of tissue simulating phantoms from interstitial frequency domain measurements of relative fluence and phase difference,”
Opt. Express, 14
(14), 6485
–6501
(2006). https://doi.org/10.1364/OE.14.006485 1094-4087 Google Scholar
F. Bevilacqua, A. J. Berger, A. E. Cerussi, D. Jakubowski, and B. J. Tromberg,
“Broadband absorption spectroscopy in turbid media by combined frequency-domain and steady-state methods,”
Appl. Opt., 39
(34), 6498
–6507
(2000). https://doi.org/10.1364/AO.39.006498 0003-6935 Google Scholar
W. M. Star,
“Diffusion theory of light transport,”
Optical-Thermal Response of Laser Irradiated Tissue, 131
–206 Plenum Press, New York
(1995). Google Scholar
J. B. Fishkin, E. Gratton, M. J. vandeVen, and W. W. Mantulin,
“Diffusion of intensity modulated near-infrared light in turbid media,”
Proc. SPIE, 143 122
–135
(1991). https://doi.org/10.1117/12.44184 0277-786X Google Scholar
S. Fantini, M. A. Franceschini, J. B. Fishkin, B. Barbieri, and E. Gratton,
“Quantitative determination of the absorption spectra of chromophores in strongly scattering media: a light-emitting-diode based technique,”
Appl. Opt., 33
(22), 5204
–5213
(1994). https://doi.org/10.1364/AO.33.005204 0003-6935 Google Scholar
H. J. van Staveren, C. J. M. Moes, J. van Marle, S. A. Prahl, and M. J. C. van Gemert,
“Light scattering in Intralipid-10% in the wavelength range of ,”
Appl. Opt., 30
(31), 4507
–4514
(1991). https://doi.org/10.1364/AO.30.004507 0003-6935 Google Scholar
Q. Fu and W. Sun,
“Mie theory for light scattering by a spherical particle in an absorbing medium,”
Appl. Opt., 40
(9), 1354
–1361
(2001). https://doi.org/10.1364/AO.40.001354 0003-6935 Google Scholar
A. Pifferi, A. Torricelli, P. Taroni, D. Comelli, A. Bassi, and R. Cubeddu,
“Fully automated time domain spectrometer for the absorption and scattering characterization of diffusive media,”
Rev. Sci. Instrum., 78 053103
(2007). https://doi.org/10.1063/1.2735567 0034-6748 Google Scholar
J. R. Mourant, T. Fuselier, J. Boyer, Tamara M. Johnson, and I. J. Bigio,
“Predictions and measurements of scattering and absorption over broad wavelength ranges in tissue phantoms,”
Appl. Opt., 36
(4), 949
–957
(1997). https://doi.org/10.1364/AO.36.000949 0003-6935 Google Scholar
S. T. Flock, S. L. Jacques, B. C. Wilson, W. M. Star, and M. J. van Gemert,
“Optical properties of Intralipid: a phantom medium for light propagation studies,”
Lasers Surg. Med., 12
(5), 510
–519
(1992). https://doi.org/10.1002/lsm.1900120510 0196-8092 Google Scholar
G. M. Hale and M. R. Querry,
“Optical constants of water in the wavelength region,”
Appl. Opt., 12
(3), 555
–563
(1973). https://doi.org/10.1364/AO.12.000555 0003-6935 Google Scholar
K. F. Palmer and D. Williams,
“Optical properties of water in the near infrared,”
J. Opt. Soc. Am. A, 64
(8), 1107
–1110
(1974). https://doi.org/10.1364/JOSA.64.001107 0740-3232 Google Scholar
R. C. Smith and K. S. Baker,
“Optical properties of the clearest natural waters ,”
Appl. Opt., 20
(2), 177
–184
(1981). https://doi.org/10.1364/AO.20.000177 0003-6935 Google Scholar
D. J. Segelstein,
“The complex refractive index of water,”
University of Missouri,
(1981). Google Scholar
L. Kou, D. Labrie, and P. Chylek,
“Refractive indices of water and ice in the spectral range,”
Appl. Opt., 32
(19), 3531
–3540
(1993). https://doi.org/10.1364/AO.32.003531 0003-6935 Google Scholar
H. Buiteveld, J. M. H. Hakvoort, and M. Donze,
“The optical properties of pure water,”
Proc. SPIE, 2258 174
–183
(1994). https://doi.org/10.1117/12.190060 0277-786X Google Scholar
H. D. Downing and D. Williams,
“Optical constants of water in the infrared,”
J. Geophys. Res., 80
(12), 1656
–1661
(1975). https://doi.org/10.1029/JC080i012p01656 0148-0227 Google Scholar
A. Giusto, R. Saija, M. A. Iati, P. Denti, F. Borghese, and O. I. Sindoni,
“Optical properties of high-density dispersions of particles: application to Intralipid solutions,”
Appl. Opt., 42
(21), 4375
–4379
(2003). https://doi.org/10.1364/AO.42.004375 0003-6935 Google Scholar
G. Zaccanti, S. D. Bianco, and F. Martelli,
“Measurements of optical properties of high-density media,”
Appl. Opt., 42
(19), 4023
–4029
(2003). https://doi.org/10.1364/AO.42.004023 0003-6935 Google Scholar
L. Spinelli, F. Martelli, A. Farina, A. Pifferi, A. Torricelli, R. Cubeddu, and G. Zaccanti,
“Calibration of scattering and absorption properties of a liquid diffusive medium at NIR wavelengths. Time-resolved method,”
Opt. Express, 15
(11), 6589
–6603
(2007). https://doi.org/10.1364/OE.15.006589 1094-4087 Google Scholar
F. Martelli and G. Zaccanti,
“Calibration of scattering and absorption properties of a liquid diffusive medium at NIR wavelengths—CW method,”
Opt. Express, 15
(2), 486
–500
(2007). 1094-4087 Google Scholar
C. Chen, J. Q. Lu, H. Ding, K. M. Jacobs, Y. Du, and X.-H. Hu,
“A primary method for determination of optical parameters of turbid samples and application to Intralipid between 550 and ,”
Opt. Express, 14
(16), 7420
–7435
(2006). https://doi.org/10.1364/OE.14.007420 1094-4087 Google Scholar
R. Michels, F. Foschum, and A. Kienle,
“Optical properties of fat emulsions,”
Opt. Express, 16
(8), 5907
–5925
(2008). https://doi.org/10.1364/OE.16.005907 1094-4087 Google Scholar
|