
|
|
1.IntroductionMelanoma is a malignant tumor of melanocytes that are found predominantly in skin but also in the bowel and in eyes.1 In the United States, its incidence rate has climbed from 7.9 per 100,000 in 1975 to 21.5 per 100,000 in 2005, with an average mortality rate of 2.6 per 100,000. It is the most invasive skin cancer and causes the majority of skin cancer–related deaths.2 Normal human skin melanocytes exist in a growth-controlled state and stay at the basal membrane of the epidermis, exhibiting a multidendritic shape.3 Tumorigenic melanoma cells, however, gain the capability of agglomerating at early phases and spreading downward through the epidermis–dermis junction into the dermis layer at late invasion phases.4 In laboratory culture, uncontrolled proliferation of melanocytes can be triggered by the absence of keratinocytes (the primary cell type in epidermis producing keratin), but the growth regulation can be restored by co-culturing with keratinocytes.5, 6 These in vitro studies revealed a concomitant change in cellular morphology in which the multidendritic form, also observed in vivo,3 is associated with normal melanocytes, whereas the bipolar, tripolar, and spindle shapes are associated with growth-unregulated melanocytes [cf. Fig. 1a ]. It remains unknown, however, whether a similar observation for cell morphologies can be made in clinical cases with developing melanoma. In particular, considering that an invading melanoma cell has to displace and meander through the dermis layer, which is densely populated by collagen fibers, it will be of great interest to characterize the relative spatial relationship between a melanoma cell and its hosting collagen matrix in situ. Knowledge of this nature, which is the primary goal of this article, is important and is directly relevant to relating molecular pathology of cancer7 to in vitro investigations8, 9, 10 and histopathology because cellular morphology represents a synthesis of complex genetic and epigenetic networks as they respond to the host environment.4 Fig. 1(a) Illustration showing melanocyte cells and their tissue environment in a normal skin section (not drawn to scale). (b) Illustration of the morphologies for the normal and malignant cells. Pigment-containing melanosomes are represented by the black rod/sphere inside the melanocytes. (c) Chemical structure of the principal fluorescence moiety in melanin and an energy diagram for two-photon excited fluorescence (TPEF). (d) Structure of a collagen bundle (protein data bank ) and an energy diagram for second harmonic generation (SHG). 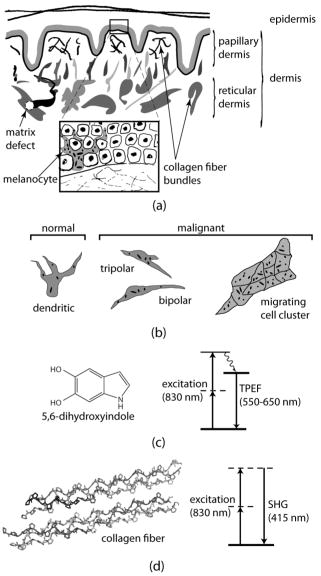 Visualization in conventional histology relies on contrast usually provided by the H&E staining, where hematoxyline (H) marks the nuclei and eosin (E) stains the cytoplasm and collagen. Unfortunately, dye staining is not a contrast-generating mechanism that can be easily generalized for in vivo use. It has been reported that circulating melanoma cells can be identified by certain molecular markers, therefore facilitating the diagnosis of melanoma.10 However, morphological features of individual invasive melanoma cells are still difficult to obtain. To image a sample without staining—methods that potentially can be extended to in vivo applications—it is necessary to have an alternative contrast-generating mechanism based on the native chemical components and molecular organization in the specimen. Multiphoton microscopy stands out as a practical means of approaching this problem.11, 12, 13 Previous examination of the unstained skin tissue has carefully characterized the optical absorption,14 scattering,15 and emission signal from separate components such as autofluorescence from reduced NAD(P)H, flavin protein, melanin, etc.,16, 17, 18, 19, 20, 21 as well as high-order generation from collagen and other filament structures,22, 23, 24, 25, 26, 27 or combination of multiple techniques.28, 29, 30, 31, 32, 33, 34 The rapid expansion of the knowledge base brought by these techniques has paved the way for optical study of unstained skin cancer tissue. Here, we will apply such multiphoton nonlinear microscopy to achieve simultaneously the morphology of individual melanoma cells and cell clusters and their intermediate reaction with the nearby extracellular matrix environment. Melanoma cells, being differentiated from melanocytes, are rich in melanin, which is primarily composed of polymeric 5,6-dihydroxyindole and its derivatives.35 The indole moiety in 5,6-dihydroxyindole [Fig. 1c] suggests electronic transitions amenable to fluorescence detection,36, 37 providing a melanin-sensitive contrast mechanism in tissues.38 Spectroscopic studies have shown that melanin absorbs strongly from the UV region (wavelength ) throughout the entire visible spectrum (wavelength ), whereas its fluorescence falls between 400 and .39, 40 Fluorescence from melanin can also be accessed spectroscopically by two-photon excitation in the near-infrared (NIR) region from .17, 18, 41, 42, 43 Melanin has also been reported to give good contrast in other optical microscopy approaches, such as confocal reflectance microscopy38, 44 and two-photon absorption microscopy.14, 45, 46 Collagen fibers, the main component of the extracellular matrix, are polypeptides rich in proline, glycine, and other amino acids that do not contain chromophores [cf. Fig. 1d]. Based on its chemical composition alone, unstained collagen is invisible to fluorescence microscopy. Yet the highly anisotropic organization of collagen bundles in situ suggests possible detection means based on nonlinear spectroscopy, including second-harmonic generation (SHG)47, 48, 49, 50, 51, 52, 53 and sum frequency generation,22, 54, 55, 56 which are specifically sensitive to materials with asymmetric second-order susceptibility.57 Such information enables us to simultaneously acquire melanin-sensitive two-photon excited fluorescence (TPEF) and the collagen-sensitive second-harmonic generation (SHG). In this report, we focus on visualizing the fine morphology of melanomas and their immediate interactions with extracellular matrix in unstained human skin cancer tissue, testing the hypotheses that single-wavelength excitation multiphoton microscopy can be used to examine the fine cellular features in unstained tissue samples and that the bipolar cellular shape observed in laboratory culture could be clinically relevant by visualizing the morphology in tissue samples. 2.Materials and Methods2.1.Human Skin Melanoma TissueTissue samples were obtained from a -old Asian female patient, who had developed acrolentiginous melanoma in her right sole (Fig. 2 ) in 2006. Since melanoma cells had invaded past the papillary dermis layer into the reticular dermis layer, this case is classified as exhibiting Clark’s level IV. According to the American Joint Communication on Cancer (AJCC) staging system (1992), this case was allocated in clinical stage II. A surgical excision was performed, and no systemic metastasis has been found after thorough investigation. The five-year survival rate is above 75% for this type of case, and this patient is closely followed after treatment. Fig. 2Wide-field grayscale image of an unstained human melanoma tissue excised from patient’s sole. The down-pointing arrow indicates invasion from the epidermis to the dermis. A photograph for the topical area is displayed in the bottom inset. 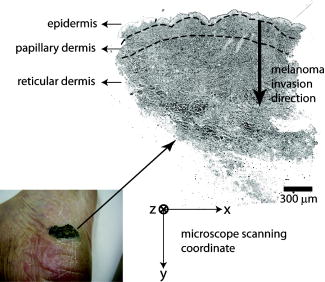 A skin biopsy was fixed by 10% buffered formalin, embedded in paraffin, and sectioned longitudinally with a thickness of 3 microns. Individual tissue sections were then mounted on standard -thick quartz slides and covered by 170-micron-thick quartz coverslips (Technical Glass, Painesville Township, Ohio). The sample was first studied by multiphoton imaging, followed by a modified Masson’s trichrome staining58, 59 for assignment of nonlinear optical signal sources. 2.2.Multimodal Multiphoton MicroscopyA multimodal microscope was constructed from a modified commercial inverted microscope, the optical layout for which is outlined in Fig. 3a . Briefly, collimated , pulses from a Ti:Sapphire oscillator (Spectra-Physics, Mountain View, California) were directed into an inverted microscope (IX71, Olympus, Center Valley, Pennsylvania). The laser beam was then reflected by a dichroic mirror (640dcbpxr-270, Chroma, Rockingham, Vermont) into an oil-immersion objective ( , NA 1.35, Olympus, Center Valley, Pennsylvania) and focused into the tissue sample, which is secured on a piezo stage (P517.3CL, PI, Auburn, Massachusetts) on top of a motorized stage (H117, Prior Scientific, Rockland, Massachusetts). The absolute , , and positions of the stage were read out from capacitive sensors on the piezo stage and motor encoding on the motorized stage and were recorded for reconstructing the 3-D image. No detectable photobleaching or photodegradation of the samples was observed throughout the experiment. Fig. 3(a) Scheme for optical layout. The abbreviations are PMT, photo multiplier tube; APD, avalanche photo diode; SHG, second-harmonic generation; and TPEF, two-photon excited fluorescence. (b) Power dependence for both TPEF (red) and SHG (green). Both signals give a quadratic dependence of the incident laser power. The inset shows how the two signals are separated by their characteristic wavelengths. The two-photon excitation fluorescence is selected using a bandpass spectral filter , the transmittance of which is shown in red. The spectrum of collagen-generated second harmonic radiation centers at around and is shown in green.  TPEF was collected in an epiconfiguration through the same microscope objective used for excitation. A set of emission filters (HQ60080, E680SP, Chroma, Rockingham, Vermont; E480LP, Edmund Optics, Barrington, New Jersey) was used to reject stray excitation light and to confine the detected photons in the spectral range. The spectrally filtered photons were detected by a single-photon counting avalanche photodiode (Perkin-Elmer, Quebec, Canada). The SHG signal propagated forward and was collected simultaneously by a UV-transmitting air objective ( , LUV-40, , Optics for Research, Verona, New Jersey). The collected light was filtered through two emission filters (E460SPUV and HQ450/80, Chroma, Rockingham, Vermont), spectrally resolved by a monochromator (SP2150, Princeton Instruments/Acton, Acton, Massachusetts) and detected by a photomultiplier tube (PMT) module (H6240, Hamamatsu, Bridgewater, New Jersey). To correct for the orientational distribution of collagen fiber bundles in SHG experiments,23, 24, 60 two mutually orthogonal excitation polarizations (via a half-wave plate) were used to acquire SHG images. One polarization was approximately parallel to the boundary of epidermis by visual estimation, and the other was perpendicular. Images were reconstructed by combining these data, which were rescaled based on the polarization-dependent laser transmission power calibration without the sample present. The signal power dependence and spectral attributes of the setup were characterized [Fig. 3b]. The reduced scattering coefficient of the skin at wavelengths from is about (Ref. 15), corresponding to a penetration depth of about . Therefore, contrast from the TPEF and forward SHG in this study will not be degraded by the thickness of the skin tissue sample used. 2.3.Collection Efficiency of Second-Harmonic GenerationDue to the coherent nature of SHG, it is important to consider the geometry of signal generation and detection. In the present case, the tightly focused field obtained with a high NA objective can be approximated by a 3-D Gaussian function in amplitude with a linearly progressed phase along the axial direction: where and are the axial and lateral field waists, respectively; is the wave vector with ; and indicates a phase shift from simple collimated beam—commonly referred as Gouy phase shift or phase anomaly. is less than 1; therefore, the effective wavelength of the excitation light near the focal center is longer than that in the medium. As a result, SHG from a tightly focused beam is maximized at an angle away from the axial direction, determined by the phase match conditions. Therefore, the collection efficiency of the SHG depends on the numerical aperture of the detection objective.Based on previous studies of SHG from a tightly focused Gaussian beam,25 the spatial distribution of SHG under our current experimental conditions is presented in Fig. 4c . Dependence of collection efficiency of SHG on the NA of the detection objective can be achieved by integrating the power probability density over the cone angle spanned by the detection objective [Fig. 4b]. Our current detection objective collects about 50% of the maximum SHG signal, sufficient to resolve the spatial distribution contrast of the collagen fiber bundles in the sample (see the following results). Fig. 4SHG deflection caused by Gouy phase shift. (a) Coordinate system. The origin is set at the focal center of both the excitation objective and the detection objective, characterized by their numerical apertures and , respectively. Excitation light travels along the axis and polarizes in the axis. (b) SHG collection efficiency versus NA of the detection objective. (c) Side (left) and top (right) view of the power distribution of the SHG under the current experimental conditions.  2.4.Wide-Field Color Image Acquisition of the Stained SampleWide-field images of the stained tissue sections were acquired on an upright microscope (Zeiss Axiophot, Serco Technical Services, Inc., Livermore, California) with an air-gapped objective ( , , Plan-Neofluar, Zeiss, Jena, Germany). Color images were taken using a color camera (MicroPublisher 5.0 cooled RTV, QImaging, British Columbia, Canada) installed on the microscope trinocular and recorded with commercial software (iVision version, 4.011, iVision, Inc., Atlanta, Georgia). The exposure time was per frame. 2.5.Image ProcessingPost-data-acquisition image processing was accomplished using the commercial package MATLAB (The MathWorks, Inc., Natick, Massachusetts). All images are presented with pseudo color coding: red for the fluorescence and green for the SHG. In preparing the composite images (Fig. 5 ), 12 equal-intensity-interval isosurfaces were first rendered from the 3-D scanning data, with the degree of opacity proportional to the isosurface value. These isosurfaces were then overlaid for TPEF and SHG, projected onto a 2-D plane, and visualized from the (cf. Fig. 2) direction. Figure 6 was generated by applying the same procedures as Fig. 5, except that isosurfaces are constructed from every 10 consecutive -sectioned images. In accordance with standard histology of the skin, all images are presented with the epidermis layer on the top. Fig. 5Top view of the 3-D co-localization images of TPEF (red) and second-harmonic generation (green) from papillary dermis [(a) to (c)] and reticular dermis [(d) to (f)]. Five equal-interval-intensity isosurfaces were rendered from stacks of -sectioned plane images, where the degree of opacity was set to proportional to the detected signal intensity. The reconstructed 3-D images were then projected to 2-D and viewed from the direction. Isosurface values were chosen to cover signal strength from background level to the mean value of melanin TPEF or the collagen fiber bundle’s SHG. (a) to (c): Composite (a), TPEF (b), and SHG (c) images of a melanoma cell within papillary dermis. (d) to (f): Composite (d), TPEF (e), and SHG (f) images of melanoma cell clusters within reticular dermis. The melanoma and collagen boundary is marked by yellow dashed lines in A and D, indicated by arrows. Melanosomes, dendritic structure, and weak collagen fluorescence background (see main text) are marked by the arrows a, b, and c, respectively. Image size: for (a) to (c), for (d) to (f). The incident power was for papillary dermis and for reticular dermis. The average dwelling time for each pixel is .  Fig. 6-sectioned composite images from TPEF (red) and second-harmonic generation (green) for papillary dermis and reticular dermis regions. The image construction procedure is the same as Fig. 5 except that each image is constructed from 10 consecutive sections. Panels (a) to (e) are from papillary dermis, whereas panels (f) to (j) are from reticular dermis. In both the and the panels, the TPEF and SHG patterns have been outlined respectively by red and green dashed lines as eye guides. Individual image size is for papillary dermis and for reticular dermis, respectively. The average incident power is for papillary dermis and for reticular dermis. The average dwelling time for each pixel is .  3.Results3.1.Comparison with HistologyRaster-scanned multimodal multiphoton imaging was first carried out on the unstained tissue sections, where both SHG [Fig. 7a ] and TPEF [Fig. 7e] were recorded for each pixel. After the multimodal microscopy was complete, Masson’s trichrome stain was applied to the same region of the same sample, where hematoxyline stained the nucleus dark brown, ponceau acid fuchsin stained the cytoplasm and keratin red, and aniline blue stained the collagen blue [Figs. 7b and 7f]. This allows a direct, one-to-one comparison of the multiphoton image from the unstained sample with the trichrome-stained image. The position of the representative area within the whole tissue section is marked by the black rectangle in Fig. 7d. Fig. 7Comparison between SHG, TPEF, and Masson’s trichrome stained images. (a) Second-harmonic generation (SHG), (b) Masson’s trichrome stained, and (c) SHG/stain overlaid composite image of the marked area in (d), where collagen fiber bundles confirmed from staining (blue) overlap well with the structure visible in the SHG image (green). (d) Wide-field image of the unstained tissue section. The black rectangle marks the position of areas presented in (a) to (c) and (e) to (g). (e) TPEF, (f) Masson’s trichrome stained, and (g) TPEF/stain overlaid composite image of the marked area in (d), where strong fluorescence emission spots overlap with melanoma and weak emission overlaps with the collagen fiber bundles, which may have associated autofluorescent components [see panels (h) and main text]. The boundary between the epidermis and dermis can be readily recognized [black arrow in (b)]. Morphological difference for collagen in papillary dermis (finer) and reticular dermis (thicker) can be seen. (h) A close view of a representative area from (a), (b), (f), and (e), where collagen fiber bundles (red arrows) and melanoma cells (yellow arrows) are readily identified by the stained results and specifically contrasted by second-harmonic generation and TPEF respectively. Note that the purple color (red arrows) along the collagen fiber bundles indicates possible adherence of cytoplasmic components. These components, such as fibroblasts, may contribute to the weak autofluorescence background as observed in panel (e). Melanoma cells can be easily identified by their much stronger fluorescence over the background [intensity profile in (h)]. Amelanotic melanoma cells in the stained image fail to appear in the fluorescence image [nucleus indicated by green arrows in (h)].  SHG specifically contrasts the collagen fiber bundles, confirmed by the excellent spatial overlap between the green and blue pattern in Figs. 7c and 7h. Composite stained/TPEF images reveal two cases [Figs. 7g and 7h]. First, bright fluorescence spots locate melanin in melanoma cells, as seen from the overlap of the red-stained cytoplasm and the strong fluorescence signal [yellow arrows in Fig. 7h]. Second, nonnegligible fluorescence background, which is about 20% of the melanoma fluorescence, suggests possible adherence of autofluorescent components to the collagen fiber bundles, evidenced by the purple color [red arrows in Fig. 7h] along the collagen structure in the stained results. The precise origin of this autofluorescent signal is unclear but is likely to arise from both cellular and tissue components. There are two main sources of cellular autofluorescence:16 reduced pyridine nucleotides—NAD(P)H, and flavoproteins. NAD(P)H, which absorbs light around , is unlikely to contribute to the detected fluorescence background since it will not be significantly excited in a two-photon process by the excitation light. Flavoproteins, which are excited around and fluoresce between , are a viable candidate for the source of the autofluorescent signal. Indeed, autofluorescence from a single fibroblast cell has been observed from both one-photon19 and two-photon excitation (our control experiment; data not shown). In addition to the cellular chromophores, tissue component elastin may be another source of the observed autofluorescence. Its two-photon excitation fluorescence spanning from has been reported in the spectroscopic studies of the endogenous fluorescence species in human skin17 and in the coronary artery.29 This autofluorescent background, however, does not hamper the use of intrinsic melanoma signal as a contrast agent in TPEF imaging because of its low intensity (cf. Fig. 5). These observations suggest the possibility of investigating the interrelationship between melanoma cells and the collagen fiber matrix in great detail at high spatial resolution, as demonstrated by the experimental results given in the following. 3.2.Colocalization of Melanoma Cells and Collagen Fiber BundlesThe relatively small number of melanoma cells contained in both the papillary and reticular dermis regions in this tissue biopsy allows morphological investigations at the single-cell level. Samples were imaged under the multimodal configuration, focusing on individual melanoma cells and their immediate surroundings (cf. Fig. 1). Figs. 5a, 5b, 5c display the SHG/TPEF composite image, the TPEF, and the SHG image of a melanoma cell in the papillary dermis region. The interrelationship between collagen matrix and the cell is clearly seen. The bipolar feature of the melanoma cell can be readily recognized. The pericellular structures spreading from the center of the melanoma cell are also observed, as indicated by arrows in Fig. 5b. The spherically shaped objects in the melanin emission channel, indicated by yellow arrows in Fig. 5b, are attributed to melanosomes. The morphological characteristics changed when moving into the reticular region. As shown in Figs. 5d and 5e, the melanoma cells appear to aggregate. This is consistent with a known invasion mode in which clusters of cancerous cells can migrate together. In addition, compared with melanoma cells in the papillary dermis region, a significantly increased TPEF signal is seen co-localizing with the collagen matrix. Further insight can be obtained by inspecting the TPEF-SHG co-localization at various sections along the cutting surface. A series of -sectioned images from the cell in Figs. 5a and 5b are shown in Fig. 6. Although the examined tissue is thin , we can readily recognize morphological differences between each section. 4.DiscussionVisual inspection of cellular morphology often serves as the initial yet most important step in clinical diagnosis. For example, one of the diagnosis criteria for infection by such viruses as cytomegalovirus, herpes simplex virus, or varicella zoster virus is the ballooning shape of infected cells.61 Genetic defects can cause blood-related diseases exhibiting phenotypes of deformed red blood cells, including sickle-cell diseases and spherocytosis in hemolytic anemia and thalassemia.62 Along the same vein, tumor cells, bearing a modified genetic markup, usually display an altered appearance compared to normal cells.63 Tumor invasion relies critically on interactions between cancer cells and the extracellular matrix. Cellular morphology may serve as an integrated indicator for cancer diagnosis as well as reveal the invasion pathways and mechanisms for metastasis. Much insight about the cell shape and its relationship to cancer physiology has been provided by laboratory studies of cultured cells and animal models. Both the mechanical properties of the host matrix and the chemical factors in the environment are known to influence the tumorigenesis and metastasis of cells.64 Recent results from 3-D cell-culturing assays have revealed drastically different cell morphology compared to those of cells cultured on 2-D substrates,65, 66, 67, 68 highlighting the importance of the 3-D interrelationship in cell–cell and cell–extracellular matrix interactions.69 New insights can be drawn from interpretation of such 3-D interrelationships obtained from our two-photon microscopy. In addition to the morphological examination of both melanoma cells and extracellular matrix at different regions, TPEF/SHG composite images suggest that the dendritic features of melanoma cells may extend into and be sheathed by collagen envelopes [indicated by black arrows in Figs. 6b, 6c, 6d]. Comparison of the trichrome-stained images with TPEF images indicates that bright fluorescence spots (melanin rich) always correspond to melanoma cells in the stained image. There were, however, occasional instances in which melanoma cells may have lost their melanin production capability [nucleus indicated by the green arrows in Fig. 7h] so that there was insufficient melanin to be detected by the TPEF. This type of melanoma, amelanotic melanoma, which is commonly difficult to detect, can be easily recognized by the examination of stained/TPEF composite images. Moreover, several basic questions regarding cancer cell invasion now appear more approachable. For example, how do melanoma cells manipulate the collagen fiber in their invasion process? Are different invasion mechanisms adopted depending on the local environment or stimuli? Under what conditions is proteolysis or deformation preferred by melanoma? How does the extracellular matrix respond to or regulate the invading melanoma cells, and does the matrix recover afterward? All these questions can in principle be approached with improved imaging capabilities, which will come from further fundamental studies of nonlinear imaging and spectroscopy in complex systems. Considering visualization needs from laboratory research to clinical application, it will be advantageous if the same general microscopy method can be used for imaging the 3-D morphology of individual cells in cell culture, in tissue samples, and in vivo. This calls for imaging methods utilizing a contrast mechanism that does not require extrinsic labeling, yet provides sufficient specificity to differentiate cells from the extracellular matrix. Using melanoma as a model, the present work demonstrates the feasibility of using multimodal nonlinear optical microscopy to visualize the 3-D cellular morphological features in unstained biopsies. Such feasibility has also been shown using confocal reflectance microscopy,38, 44, 70 where melanin generates strong signal due to its efficient light scattering capability. The back-reflection configuration also enables confocal reflectance microscopy to be applied to in vivo imaging of human skin, offering great potential in noninvasive diagnosis of skin cancers. However, collagen with typical bundle size of several tens of microns, also scatters the light efficiently, which unfortunately makes it difficult to morphologically differentiate between the melanoma cells and their intermediate collagen matrix.44 An alternative approach to examine unstained skin tissue is the recently developed two-photon absorption microscopy,14, 45, 46 where contrast is achieved through excitation light with either modulated intensity or tailored pulse shape. Melanin, a good light absorber, again serves as an important contrasting component. However, the identification of collagen appears difficult due to its limited light absorption in the infrared regime. Our multimodal multiphoton study, therefore, offers a possible complementary solution for spatially resolving melanoma cells and their local collagen environment under native physiological conditions. The configuration can be easily modified to detect the backward-reflected SHG for the convenience of clinical applications. Indeed, it should be relatively straightforward to reconfigure an existing multiphoton confocal microscope for this purpose. 5.ConclusionIn this study, 3-D TPEF/SHG co-localization images give snapshots of cell morphology and cell–extracellular matrix organization, providing for the first time high-resolution visualization of the invasive cancer cells in their native environment. Melanoma and collagen fiber bundles can be specifically resolved by single-wavelength excitation, which is also confirmed by a separate staining experiment of the region. Polarized melanoma cells and their surrounding collagen matrices have been clearly resolved, providing evidence that the cellular morphological characteristics of proliferating melanocytes previously observed in cultured assay are preserved in tissue samples. The melanoma cells and their host collagen fiber bundles have been shown to be amenable to studies using TPEF and SHG microscopy. In addition, this report has demonstrated that a single excitation wavelength is sufficient to generate contrast specifically for both melanoma cells and collagen fibers. This proof-of-principle experiment has already started to reveal intricate features that are otherwise lost in conventional histology studies, suggesting the potential of using nonlinear multimodal imaging as a routine tool for more advanced studies. AcknowledgmentsThe authors thank Dr. S. E. Ruzin and Dr. D. Schichnes at the Biological Imaging Facility at UC Berkeley for their help in stained sample preparation and image acquisition. This work is supported in part by the University of California and Alfred P. Sloan Foundation, with special equipment supported by U.S. Department of Energy and by the the National Science Foundation. ReferencesR. L. Barnhill and A. N. Crowson, Textbook of Dermatopathology, McGraw-Hill, New York
(2004). Google Scholar
L. A. G. Ries, D. Melbert, M. Krapcho, A. Mariotto, B. A. Miller, E. J. Feuer, L. Clegg, M. J. Horner, N. Howlader, M. P. Eisner, M. Reichman, and B. K. Edwards, SEER Cancer Statistics Rev., 1975–2005,
(2007) http://seer.cancer.gov/csr/1975–2005/ Google Scholar
T. Yamashita, T. Kuwahara, S. Gonzalez, and M. Takahashi,
“Noninvasive visualization of melanin and melanocytes by reflectance-mode confocal microscopy,”
J. Invest. Dermatol., 124
(1), 235
–240
(2005). https://doi.org/10.1111/j.0022-202X.2004.23562.x 0022-202X Google Scholar
Lever’s Histopathology of the Skin, Lippincott Williams & Wilkins, Philadelphia
(2005). Google Scholar
M. Herlyn, U. Rodeck, M. L. Mancianti, F. M. Cardillo, A. Lang, A. H. Ross, J. Jambrosic, and H. Koprowski,
“Expression of melanoma-associated antigens in rapidly dividing human melanocytes in culture,”
Cancer Res., 47
(12), 3057
–3061
(1987). 0008-5472 Google Scholar
I. T. Valyi-Nagy, G. Hirka, P. J. Jensen, I. M. Shih, I. Juhasz, and M. Herlyn,
“Undifferentiated keratinocytes control growth, morphology and antigen expression of normal melanocytes through cell-cell contact,”
Lab. Invest., 69
(2), 152
–159
(1993). 0023-6837 Google Scholar
H. Davies, G. R. Bignell, C. Cox, P. Stephens, S. Edkins, S. Clegg, J. Teague, H. Woffendin, M. J. Garnett, W. Bottomley, N. Davis, N. Dicks, R. Ewing, Y. Floyd, K. Gray, S. Hall, R. Hawes, J. Hughes, V. Kosmidou, A. Menzies, C. Mould, A. Parker, C. Stevens, S. Watt, S. Hooper, R. Wilson, H. Jayatilake, B. A. Gusterson, C. Cooper, J. Shipley, D. Hargrave, K. Pritchard-Jones, N. Maitland, G. Chenevix-Trench, G. J. Riggins, D. D. Bigner, G. Palmieri, A. Cossu, A. Flanagan, A. Nicholson, J. W. C. Ho, S. Y. Leung, S. T. Yuen, B. L. Weber, H. F. Siegler, T. L. Darrow, H. Paterson, R. Marais, C. J. Marshall, R. Wooster, M. R. Stratton, and P. A. Futreal,
“Mutations of the BRAF gene in human cancer,”
Nature (London), 417
(6892), 949
–954
(2002). https://doi.org/10.1038/nature00766 0028-0836 Google Scholar
S. Hooper, J. F. Marshall, and E. Sahai,
“Tumor cell migration in three dimensions,”
Methods Enzymol., 406 625
–643
(2006). https://doi.org/10.1016/S0076-6879(06)06049-6 0076-6879 Google Scholar
C. Gaggioli and E. Sahai,
“Melanoma invasion—current knowledge and future directions,”
Pigment Cell Res., 20
(3), 161
–172
(2007). https://doi.org/10.1111/j.1600-0749.2007.00378.x 0893-5785 Google Scholar
S. Medic, R. L. Pearce, P. J. Heenan, and M. Ziman,
“Molecular markers of circulating melanoma cells,”
Pigment Cell Res., 20
(2), 80
–91
(2007). https://doi.org/10.1111/j.1600-0749.2006.00356.x 0893-5785 Google Scholar
W. Denk, J. H. Strickler, and W. W. Webb,
“2-photon laser scanning fluorescence microscopy,”
Science, 248
(4951), 73
–76
(1990). https://doi.org/10.1126/science.2321027 0036-8075 Google Scholar
K. Konig,
“Multiphoton microscopy in life sciences,”
J. Microsc., 200
(2), 83
–104
(2000). https://doi.org/10.1046/j.1365-2818.2000.00738.x 0022-2720 Google Scholar
W. R. Zipfel, R. M. Williams, and W. W. Webb,
“Nonlinear magic: multiphoton microscopy in the biosciences,”
Nat. Biotechnol., 21
(11), 1369
–1377
(2003). https://doi.org/10.1038/nbt899 1087-0156 Google Scholar
T. Ye, G. Yurtsever, M. Fischer, J. D. Simon, and W. S. Warren,
“Imaging melanin by two-photon absorption microscopy,”
Proc. SPIE, 6089 60891X
(2006). https://doi.org/10.1117/12.646139 0277-786X Google Scholar
G. Zonios, J. Bykowski, and N. Kollias,
“Skin melanin, hemoglobin, and light scattering properties can be quantitatively assessed in vivo using diffuse reflectance spectroscopy,”
J. Invest. Dermatol., 117
(6), 1452
–1457
(2001). https://doi.org/10.1046/j.0022-202x.2001.01577.x 0022-202X Google Scholar
B. R. Masters, P. T. C. So, and E. Gratton,
“Multiphoton excitation fluorescence microscopy and spectroscopy of in vivo human skin,”
Biophys. J., 72
(6), 2405
–2412
(1997). https://doi.org/10.1016/S0006-3495(97)78886-6 0006-3495 Google Scholar
L. H. Laiho, S. Pelet, T. M. Hancewicz, P. D. Kaplan, and P. T. C. So,
“Two-photon 3-D mapping of ex vivo human skin endogenous fluorescence species based on fluorescence emission spectra,”
J. Biomed. Opt., 10
(2), 024016
(2005). https://doi.org/10.1117/1.1891370 1083-3668 Google Scholar
K. Teuchner, W. Freyer, D. Leupold, A. Volkmer, D. J. S. Birch, P. Altmeyer, M. Stucker, and K. Hoffmann,
“Femtosecond two-photon excited fluorescence of melanin,”
Photochem. Photobiol., 70
(2), 146
–151
(1999). 0031-8655 Google Scholar
A. C. Croce, A. Spano, D. Locatelli, S. Barni, L. Sciola, and G. Bottiroli,
“Dependence of fibroblast autofluorescence properties on normal and transformed conditions: role of metabolic activity,”
Photochem. Photobiol., 69
(3), 364
–374
(1999). https://doi.org/10.1562/0031-8655(1999)069<0364:DOFAPO>2.3.CO;2 0031-8655 Google Scholar
P. Wilder-Smith, K. Osann, N. Hanna, N. El Abbadi, M. Brenner, D. Messadi, and T. Krasieva,
“In vivo multiphoton fluorescence imaging: a novel approach to oral malignancy,”
Lasers Surg. Med., 35
(2), 96
–103
(2004). https://doi.org/10.1002/lsm.20079 0196-8092 Google Scholar
F. Helmchen and W. Denk,
“Deep tissue two-photon microscopy,”
Nat. Methods, 2
(12), 932
–940
(2005). https://doi.org/10.1038/nmeth818 1548-7091 Google Scholar
Y. Fu, H. F. Wang, R. Y. Shi, and J. X. Cheng,
“Second harmonic and sum frequency generation imaging of fibrous astroglial filaments in ex vivo spinal tissues,”
Biophys. J., 92
(9), 3251
–3259
(2007). https://doi.org/10.1529/biophysj.106.089011 0006-3495 Google Scholar
P. Stoller, K. M. Reiser, P. M. Celliers, and A. M. Rubenchik,
“Polarization-modulated second harmonic generation in collagen,”
Biophys. J., 82
(6), 3330
–3342
(2002). https://doi.org/10.1016/S0006-3495(02)75673-7 0006-3495 Google Scholar
R. M. Williams, W. R. Zipfel, and W. W. Webb,
“Interpreting second-harmonic generation images of collagen I fibrils,”
Biophys. J., 88
(2), 1377
–1386
(2005). https://doi.org/10.1529/biophysj.104.047308 0006-3495 Google Scholar
L. Moreaux, O. Sandre, and J. Mertz,
“Membrane imaging by second-harmonic generation microscopy,”
J. Opt. Soc. Am. B, 17
(10), 1658
–1694
(2000). https://doi.org/10.1364/JOSAB.17.001685 0740-3224 Google Scholar
E. Brown, T. McKee, E. diTomaso, A. Pluen, B. Seed, Y. Boucher, and R. K. Jain,
“Dynamic imaging of collagen and its modulation in tumors in vivo using second-harmonic generation,”
Nat. Methods, 9
(6), 796
–800
(2003). https://doi.org/10.1038/nm879 1548-7091 Google Scholar
M. Strupler, A. M. Pena, M. Hernest, P. L. Tharaux, J. L. Martin, E. Beaurepaire, and M. C. Schanne-Klein,
“Second harmonic imaging and scoring of collagen in fibrotic tissues,”
Opt. Express, 15
(7), 4054
–4065
(2007). https://doi.org/10.1364/OE.15.004054 1094-4087 Google Scholar
K. Konig and I. Riemann,
“High-resolution multiphoton tomography of human skin with subcellular spatial resolution and picosecond time resolution,”
J. Biomed. Opt., 8
(3), 432
–439
(2003). https://doi.org/10.1117/1.1577349 1083-3668 Google Scholar
A. Zoumi, X. Lu, G. S. Kassab, and B. J. Tromberg,
“Imaging coronary artery microstructure using second-harmonic and two-photon fluorescence microscopy,”
Biophys. J., 87
(4), 2778
–2786
(2004). https://doi.org/10.1529/biophysj.104.042887 0006-3495 Google Scholar
S. Yazdanfar, Y. Y. Chen, P. T. C. So, and L. H. Laiho,
“Multifunctional imaging of endogenous contrast by simultaneous nonlinear and optical coherence microscopy of thick tissues,”
Microsc. Res. Tech., 70 628
–633
(2007). https://doi.org/10.1002/jemt.20447 1059-910X Google Scholar
J. Sun, T. Shilagard, B. Bell, M. Motamedi, and G. Vargas,
“In vivo multimodal nonlinear optical imaging of mucosal tissue,”
Opt. Express, 12
(11), 2478
–2486
(2004). https://doi.org/10.1364/OPEX.12.002478 1094-4087 Google Scholar
B. R. Masters and P. T. C. So,
“Confocal microscopy and multi-photon excitation microscopy of human skin in vivo,”
Opt. Express, 8
(1), 2
–10
(2001). 1094-4087 Google Scholar
A. Zoumi, A. Yeh, and B. J. Tromberg,
“Imaging cells and extracellular matrix in vivo by using second-harmonic generation and two-photon excited fluorescence,”
Proc. Natl. Acad. Sci. U.S.A., 99
(17), 11014
–11019
(2002). https://doi.org/10.1073/pnas.172368799 0027-8424 Google Scholar
W. R. Zipfel, R. M. Williams, R. Christie, A. Y. Nikitin, B. T. Hyman, and W. W. Webb,
“Live tissue intrinsic emission microscopy using multiphoton-excited native fluorescence and second harmonic generation,”
Proc. Natl. Acad. Sci. U.S.A., 100
(12), 7075
–7080
(2003). https://doi.org/10.1073/pnas.0832308100 0027-8424 Google Scholar
Y. Liu and J. D. Simon,
“Isolation and biophysical studies of natural eumelanins: applications of imaging technologies and ultrafast spectroscopy,”
Pigment Cell Res., 16
(6), 606
–618
(2003). https://doi.org/10.1046/j.1600-0749.2003.00098.x 0893-5785 Google Scholar
T. Morishima, T. Ishikawa, and M. Endo,
“Melanin-producing cells seen in neurofibromatous lesions of Recklinghausens disease—study with fluorescence method (Falck and Hillarp),”
Arch. Dermatol. Res., 256
(3), 213
–221
(1976). https://doi.org/10.1007/BF00572486 0340-3696 Google Scholar
L. Feeney,
“Lipofuscin and melanin of human retinal-pigment epithelium—fluorescence, enzyme cytochemical and ultrastructural studies,”
Invest. Ophthalmol. Visual Sci., 17
(7), 583
–600
(1978). 0146-0404 Google Scholar
M. Rajadhyaksha, M. Grossman, D. Esterowitz, and R. H. Webb,
“In-vivo confocal scanning laser microscopy of human skin—melanin provides strong contrast,”
J. Invest. Dermatol., 104
(6), 946
–952
(1995). https://doi.org/10.1111/1523-1747.ep12606215 0022-202X Google Scholar
J. B. Nofsinger, S. E. Forest, and J. D. Simon,
“Explanation for the disparity among absorption and action spectra of eumelanin,”
J. Phys. Chem. B, 103
(51), 11428
–11432
(1999). https://doi.org/10.1021/jp992640y 1089-5647 Google Scholar
J. B. Nofsinger and J. D. Simon,
“Radiative relaxation of sepia eumelanin is affected by aggregation,”
Photochem. Photobiol., 74
(1), 31
–37
(2001). https://doi.org/10.1562/0031-8655(2001)074<0031:RROSEI>2.0.CO;2 0031-8655 Google Scholar
K. Hoffmann, M. Stucker, P. Altmeyer, K. Teuchner, and D. Leupold,
“Selective femtosecond pulse-excitation of melanin fluorescence in tissue,”
J. Invest. Dermatol., 116
(4), 629
–630
(2001). https://doi.org/10.1046/j.1523-1747.2001.01288.x 0022-202X Google Scholar
K. Teuchner, J. Ehlert, W. Freyer, D. Leupold, P. Altmeyer, M. Stucker, and K. Hoffmann,
“Fluorescence studies of melanin by stepwise two-photon femtosecond laser excitation,”
J. Fluoresc., 10
(3), 275
–281
(2000). https://doi.org/10.1023/A:1009453228102 1053-0509 Google Scholar
Y. C. Wu and J. N. Y. Qu,
“Two-photon autofluorescence spectroscopy and second-harmonic generation of epithelial tissue,”
Opt. Lett., 30
(22), 3045
–3047
(2005). https://doi.org/10.1364/OL.30.003045 0146-9592 Google Scholar
M. Rajadhyaksha, S. Gonzalez, J. M. Zavislan, R. R. Anderson, and R. H. Webb,
“In-vivo confocal scanning laser microscopy of human skin II: advances in instrumentation and comparison with histology,”
J. Invest. Dermatol., 113
(3), 293
–303
(1999). https://doi.org/10.1046/j.1523-1747.1999.00690.x 0022-202X Google Scholar
P. Tian and W. S. Warren,
“Ultrafast measurement of two-photon absorption by loss modulation,”
Opt. Lett., 27
(18), 1634
–1636
(2002). https://doi.org/10.1364/OL.27.001634 0146-9592 Google Scholar
D. Fu, T. Ye, T. E. Matthews, G. Yurtsever, L. Hong, J. D. Simon, and W. S. Warren,
“Two-color excited-state absorption imaging of melanins,”
Proc. SPIE, 6424 642402
(2007). https://doi.org/10.1117/12.698756 0277-786X Google Scholar
S. Fine and W. P. Hansen,
“Optical second harmonic generation in biological systems,”
Appl. Opt., 10
(10), 2350
–2353
(1971). https://doi.org/10.1364/AO.10.002350 0003-6935 Google Scholar
S. Roth and I. Freund,
“2nd harmonic-generation in collagen,”
J. Chem. Phys., 70
(4), 1637
–1643
(1979). https://doi.org/10.1063/1.437677 0021-9606 Google Scholar
I. Freund, M. Deutsch, and A. Sprecher,
“Connective-tissue polarity—optical 2nd-harmonic microscopy, crossed-beam summation, and small-angle scattering in rat-tail tendon,”
Biophys. J., 50
(4), 693
–712
(1986). https://doi.org/10.1016/S0006-3495(86)83510-X 0006-3495 Google Scholar
Y. Guo, P. P. Ho, A. Tirksliunas, F. Liu, and R. R. Alfano,
“Optical harmonic generation from animal tissues by the use of picosecond and femtosecond laser pulses,”
Appl. Opt., 35
(34), 6810
–6813
(1996). https://doi.org/10.1364/AO.35.006810 0003-6935 Google Scholar
B. M. Kim, J. Eichler, K. M. Reiser, A. M. Rubenchik, and L. B. Da Silva,
“Collagen structure and nonlinear susceptibility: effects of heat, glycation, and enzymatic cleavage on second harmonic signal intensity,”
Lasers Surg. Med., 27
(4), 329
–335
(2000). https://doi.org/10.1002/1096-9101(2000)27:4<329::AID-LSM5>3.0.CO;2-C 0196-8092 Google Scholar
E. Georgiou, T. Theodossiou, V. Hovhannisyan, K. Politopoulos, G. S. Rapti, and D. Yova,
“Second and third optical harmonic generation in type I collagen, by nanosecond laser irradiation, over a broad spectral region,”
Opt. Commun., 176
(1–3), 253
–260
(2000). https://doi.org/10.1016/S0030-4018(00)00504-6 0030-4018 Google Scholar
P. Stoller, P. M. Celliers, K. M. Reiser, and A. M. Rubenchik,
“Quantitative second-harmonic generation microscopy in collagen,”
Appl. Opt., 42
(25), 5209
–5219
(2003). https://doi.org/10.1364/AO.42.005209 0003-6935 Google Scholar
N. Ji and Y. R. Shen,
“Optically active sum frequency generation from molecules with a chiral center: amino acids as model systems,”
J. Am. Chem. Soc., 126
(46), 15008
–15009
(2004). https://doi.org/10.1021/ja045708i 0002-7863 Google Scholar
K. Zhang, N. Ji, Y. R. Shen, and H. Yang,
“Optically active sum frequency generation microscopy for cellular imaging,”
Ultrafast Phenomena XV, 825 Springer-Verlag, Berlin
(2007). Google Scholar
N. Ji, K. Zhang, H. Yang, and Y. R. Shen,
“Three-dimensional chiral imaging by sum-frequency generation,”
J. Am. Chem. Soc., 128
(11), 3482
–3483
(2006). https://doi.org/10.1021/ja057775y 0002-7863 Google Scholar
Y. R. Shen, The Principles of Nonlinear Optics, John Wiley & Sons, Inc., New York
(1984). Google Scholar
P. J. Masson,
“Some histological methods. Trichrome stainings and their preliminary technique,”
J. Tech. Methods, 12 75
–90
(1929). Google Scholar
F. B. Mallory, Pathological Technique: a prectical manual for workers in pathological histology including directions for the performance of autopsies and for microphotography,
(1938) Google Scholar
P. Stoller, B. M. Kim, A. M. Rubenchik, K. M. Reiser, and L. B. Da Silva,
“Polarization-dependent optical second-harmonic imaging of a rat-tail tendon,”
J. Biomed. Opt., 7
(2), 205
–214
(2002). https://doi.org/10.1117/1.1431967 1083-3668 Google Scholar
P. H. McKee, J. E. Calonje, and S. R. Granter, Pathology of the Skin,
(2005) Google Scholar
D. L. Kasper, E. Braunwald, S. Hauser, D. Longo, J. L. Jameson, and A. S. Fauci, Harrison’s Principles of Internal Medicine, McGraw-Hill Professional, New York
(2004). Google Scholar
R. A. Weinberg, The Biology of Cancer, Garland Science, New York
(2007). Google Scholar
A. F. Chambers, A. C. Groom, and I. C. MacDonald,
“Dissemination and growth of cancer cells in metastatic sites,”
Nat. Rev. Cancer, 2
(8), 563
–572
(2002). https://doi.org/10.1038/nrc865 1474-175X Google Scholar
A. Abbott,
“Biology’s new dimension,”
Nature (London), 424
(6951), 870
–872
(2003). https://doi.org/10.1038/424870a 0028-0836 Google Scholar
K. Wolf, I. Mazo, H. Leung, K. Engelke, U. H. von Andrian, E. I. Deryugina, A. Y. Strongin, E. B. Brocker, and P. Friedl,
“Compensation mechanism in tumor cell migration: mesenchymal-amoeboid transition after blocking of pericellular proteolysis,”
J. Cell Biol., 160
(2), 267
–277
(2003). https://doi.org/10.1083/jcb.200209006 0021-9525 Google Scholar
K. M. Yamada and E. Cukierman,
“Modeling tissue morphogenesis and cancer in 3D,”
Cell, 130
(4), 601
–610
(2007). https://doi.org/10.1016/j.cell.2007.08.006 0092-8674 Google Scholar
M. J. Bissell, A. Rizki, and I. S. Mian,
“Tissue architecture: the ultimate regulator of breast epithelial function,”
Curr. Opin. Cell Biol., 15
(6), 753
–762
(2003). https://doi.org/10.1016/j.ceb.2003.10.016 0955-0674 Google Scholar
C. B. Basbaum and Z. Werb,
“Focalized proteolysis: spatial and temporal regulation of extracellular matrix degradation at the cell surface,”
Curr. Opin. Cell Biol., 8
(5), 731
–738
(1996). https://doi.org/10.1016/S0955-0674(96)80116-5 0955-0674 Google Scholar
G. Pellacani, P. Guitera, C. Longo, M. Avramidis, S. Seidenari, and S. Menzies,
“The impact of in vivo reflectance confocal microscopy for the diagnostic accuracy of melanoma and equivocal melanocytic lesions,”
J. Invest. Dermatol., 127
(12), 2759
–2765
(2007). 0022-202X Google Scholar
|


