|
|
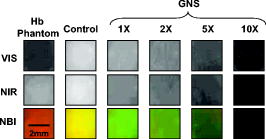
1.IntroductionGold nanoshells (GNS) are a novel class of spherical metal nanoparticles consisting of a dielectric silica core surrounded by a thin gold shell. GNS possess a tunable plasmon resonance achieved by changing the ratio of the core to shell thickness.1 This tunable optical property enables one to fabricate GNS as strong absorbers in the near-infrared region (NIR), where there is minimal absorption of light by biological chromophores and optimal penetration of light through tissue. GNS are biologically inert2 and have well-known surface chemistry suitable for bioconjugation of cancer-targeting ligands.3 In addition, GNS passively extravasate from leaky tumor vasculatures and preferentially accumulate in tumors due to the enhanced permeability and retention (EPR) effect.4, 5 GNS first showed promise as therapeutic agents for photothermal ablation of tumors in murine models based on their strong absorption in the NIR.5, 6 In addition to their potential applications as therapeutic agents, GNS have also gained popularity as scattering-based contrast agents in in vitro 7, 8 and in vivo 9 imaging strategies combined with therapy. Targeted gold nanoshell bioconjugates demonstrated increased optical contrast for imaging human breast cancer cells using in vitro dark-field microscopy.3 In addition, GNS with high scattering cross sections have been demonstrated as effective contrast enhancement agents in vitro using optical coherence tomography (OCT).10 Wang demonstrated enhanced contrast between blood vessels and the surrounding brain tissue due to GNS absorption using in vivo photoacoustic tomography (PAT).11 In vitro tissue phantom studies using optoacoustic imaging12 demonstrated GNS as effective absorbing agents providing enhanced contrast. Recently, researchers have taken advantage of the two-photon luminescence properties of GNS to image the 3-D distribution of GNS in tumors13 and image live breast cancer cells with immunotargeted GNS using in vitro two-photon microscopy.14 While all these imaging techniques demonstrate GNS as contrast agents for enhanced visualization of targeted cancer cells at the microscopic level or as absorption agents to enhance contrast between blood vessels and surrounding tissue, we used GNS’s strong NIR absorption to demonstrate enhanced contrast between GNS accumulated in the tumor and the surrounding vasculature using the narrow-band imaging (NBI) technique. In recent years, several research groups have used NBI combined with endoscopy to differentiate normal and cancerous tissue in the oral cavity,15 esophagus,16 and colon.17 The technique involves illuminating light in narrow wavelength bands to enhance contrast of important endogenous tissue chromophores such as hemoglobin in blood vessels. By shining narrow bands of light of lower wavelengths, one can differentiate vascular patterns and the surrounding tissue surfaces with greater visual contrast. Visualization of increased vasculature (i.e., angiogenesis) is an important indicator of certain early cancer. Previous studies reported with NBI have used endogenous chromophores to distinguish normal from cancerous tissue. Here, we report a new application of NIR NBI for imaging tumors using exogenous contrast agents. In particular, we report the use of GNS, one of the class of near-infrared-absorbing materials available, as the exogenous contrast agent. We used broadband light for illuminating the target and imaged select wavelength bands in the visible (VIS) and NIR regions to enhance visualization of hemoglobin and GNS, respectively. We combined the absorption properties of hemoglobin and GNS in the respective VIS and NIR wavelengths to specifically identify the tumor regions. We quantitatively determined the narrow wavelength bands providing high contrast for hemoglobin and GNS using tissue simulating phantoms and found the optimum NBI wavelengths in the VIS and NIR to be and , respectively. We then performed ex vivo NBI of murine tumors accumulated with GNS using two bands: for highlighting blood and for highlighting GNS. 2.Materials and Methods2.1.NBI SystemA schematic of the NBI system is shown in Fig. 1 . We used a quartz-tungsten-halogen lamp ( , Newport Stratford, Inc., Stratford, Connecticut) for white light illumination , a liquid crystal tunable filter (LCTF; Meadowlark Optics, Inc., Frederick, Colorado) for wavelength selection, and a cooled CCD (CoolSnap, Photometrics, Tucson, Arizona) to collect reflected light. We used a bifurcated fiber-optic cable (Dolan Jenner, Boxborough, Massachusetts) to focus the light directly onto the sample. The LCTF is a tunable bandpass filter that has a full width at half maximum (FWHM) of tuned to operate in a wavelength range of . 2.2.Gold/Silica Nanoshell FabricationNanoshells were obtained from Nanospectra Biosciences, Inc. (Houston, Texas). The GNS fabrication is based on the method of Oldenburg 1 Briefly, gold colloids, in diameter, were grown over an aminated core of colloidal silica (Precision Colloids, LLC, Cartersville, Georgia). Gold colloid and the particles were then further reacted with in the presence of formaldehyde, causing the gold surface to grow and coalesce, ultimately forming a complete shell. The gold surface was then pegylated using thiolated polyethylene glycol (SH-PEG; Laysan Bio, Huntsville, Alabama) to improve stability and blood circulation. GNS formation and dispersion in solution were assessed using a UV-VIS spectrophotometer. Figure 2 illustrates the extinction spectrum of the GNS used in this study. A concentration of ( dilution factor) particles/ml produced a peak OD of . The particles were designed to have a core size of and a shell thickness of , resulting in an extinction peak between 800 and . Based on the Mie theory calculations for these GNS, the absorption cross section was approximately 25% of the extinction cross section. (The approximate scattering cross section was , and the absorption cross section was ). For passive targeting, a thiolated polyethylene glycol (SH-PEG; Laysan Bio, Huntsville, Alabama) was added to the shell surface by combining SH-PEG and GNS in deionized water for , followed by diafiltration to remove the excess SH-PEG. The GNS were in volume, at a concentration of approximately . This corresponds to a particle concentration of when PEG-SH is added. We used 10% trehalose to suspend GNS for injection because GNS exhibit greater long-term stability in trehalose compared to PBS. In addition, 10% trehalose is iso-osmotic with blood. 2.3.Tissue PhantomsTo determine the optimum wavelength bands and the GNS detection limit, we used tissue-simulating phantoms of known optical properties. These phantoms were fabricated using polystyrene microspheres ( ; Polysciences, Warrington, Pennsylvania) to simulate scattering and hemoglobin (Sigma, St. Louis, Missouri) and GNS (Nanospectra Biosciences, Inc., Houston, Texas) to simulate absorption. We used Mie theory to calculate the reduced scattering coefficient and a spectrophotometer (DU 720, Beckman Coulter, Fullerton, California) to measure the absorption spectra of hemoglobin and GNS. We prepared a set of six tissue-simulating phantoms, as shown in Fig. 3 . Phantom 1 (control phantom) contained polystyrene microspheres in deionized water, and phantom 2 (hemoglobin phantom) contained polystyrene microspheres and hemoglobin { ; }. Phantoms 3 to 6 contained varying concentrations of GNS ( , , , and , where refers to ) in polystyrene microsphere solutions. All phantoms contained the same density of polystyrene microspheres . The range of and for phantoms 3 to 6 at the peak extinction wavelength of GNS was and , respectively. The of phantoms 3 to 6 represents scattering from both GNS and polystyrene microspheres at . GNS concentration of represents the physiological concentration shown to accumulate in tumors.18, 19 We fabricated and imaged one additional GNS phantom with a concentration of ; however, this phantom demonstrated minimal contrast from the control phantom. 2.4.Animal ModelWe demonstrated NBI in tumor xenograft animal models of colorectal cancer. We used four-to five-week-old Swiss mice weighing each. Each animal was inoculated subcutaneously with human colorectal cancer cells (HCT116, ATCC#CCL-247). The test group received of GNS solution standardized to an optical density of 97 at injected intravenously via the tail vein. The control mouse received of the trehalose vehicle. Previous studies show that the maximum accumulation of GNS in tumors is post injection.18 Therefore, we sacrificed the mice after following GNS injection and excised the bulk tissue containing the tumor from the mice to expose the subcutaneous side of the tumor for imaging. We performed imaging within of tumor excision. Excess blood from the tumor extraction was minimal and did not obscure the field of view. 3.Results3.1.Optimum Imaging WavelengthsWe determined the optimum imaging wavelengths for NBI using tissue-simulating phantoms. Optimum imaging wavelengths are the wavelengths providing maximum contrast between hemoglobin and GNS in the tumor. We collected hyperspectral images of the set of tissue-simulating phantoms from the visible to NIR regions to determine the optimum imaging wavelengths. We constructed an image cube by collecting intensity images of the phantoms at 22 different wavelengths by tuning the LCTF. In our study, the contrast was evaluated quantitatively and defined as the luminance ratio (ratio of the difference between sample intensity and background intensity to background intensity) according to Weber’s law.20 In the contrast calculation, the background intensity is that of the control phantom, and the sample intensity corresponds to hemoglobin and GNS phantoms. We selected a small region of interest from the imaged sample for each wavelength to calculate contrast for the hemoglobin phantom and one GNS phantom . A contrast plot for the hemoglobin phantom and the GNS phantom in the wavelengths ranging from is shown in Fig. 4 . The hemoglobin phantom contrast peaks at and , corresponding to the Q-bands of oxyhemoglobin. The hemoglobin phantom contrast is minimal beyond . The GNS phantom’s contrast remains high throughout, with the peak at approximately . The contrast peak of the GNS phantom appears to have a blue shift relative to the peak observed in the extinction spectrum of Fig. 2. Therefore, the optimum wavelength bands for enhancing contrast of hemoglobin and GNS are and , respectively. The subsequent NBI images use two bands: (1) VIS image: for highlighting blood; and (2) NIR image: for highlighting GNS. The shaded areas seen in Fig. 4 represent the NBI wavelengths bands. 3.2.NBI of Tissue PhantomsWe collected narrow-band images of tissue-simulating phantoms to demonstrate the concept of NBI using the wavelength bands identified in the previous section. Using the standard RGB format, we assigned the red channel to the VIS image and the green channel to the NIR image. The composite NBI image was constructed by overlaying the two images, as shown in Fig. 3a. The composite narrow-band image visually provides enhanced contrast of the hemoglobin phantom and the GNS phantom as compared to the standard color image shown in Fig. 3b. To further demonstrate the NBI image characteristics, we selected small areas from the tissue phantom matrix of VIS and NIR grayscale images and the composite NBI image to present the NBI concept (Fig. 5 ). We observe high visual contrast of the hemoglobin phantom in the VIS grayscale image, resulting in a bright red NBI composite image for the hemoglobin phantom. The control phantom has relatively little contrast in either the VIS or NIR band, resulting in a bright yellow composite NBI image. The GNS phantoms exhibit increasing contrast with higher GNS concentration, resulting in an increasingly green NBI image as GNS concentration increased. These tissue phantoms provide an estimate of the detectable concentration of GNS within tissue. The physiological concentration of GNS in tumor provides at least 20% contrast from the background noise (3%), indicated by the line in Fig. 6 . The background noise is the ratio of standard deviation to mean signal intensity of the control phantom. However, we observe that the concentration of GNS providing more than 40% contrast is between and . 3.3.NBI of Murine TumorsWe performed ex vivo imaging of Swiss mice inoculated with human colon cancer cells. Narrow-band images of both the control mouse and GNS-injected mice were collected. A small portion from the tumor was selected to illustrate the microdistribution of hemoglobin and GNS using the NBI technique. In the ex vivo NBI images, the blood vessels are clearly visible in the VIS image, as seen in Figs. 7a and 7d . In the NIR image of the GNS-injected mouse, the GNS-accumulated tumor regions are clearly visible as dark areas, as seen in Fig. 7b. The control tumor indicates only the blood vessels, as seen in Fig. 7d. The advantage of NBI is clearly demonstrated in the composite NBI images. The composite NBI images of three other tumors accumulated with GNS are shown in Fig. 8, demonstrating the various accumulation patterns seen among the tumors. The fifth mouse did not show significant particle accumulation by NBI. The black arrows in the images indicate focal regions of higher concentrations of the GNS. Fig. 7Upper panels: Narrow-band images of human colon tumor. (a) Grayscale VIS image . (b) Grayscale NIR image . (c) Composite NBI image. The black arrows indicate GNS in tumor. Lower panels: Narrow-band images of control tumor (injected with trehalose). (a) Grayscale VIS image . (b) Grayscale NIR image . (c) Composite NBI image. 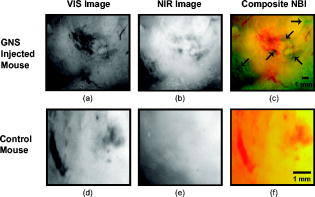 4.DiscussionWe have demonstrated NIR NBI for imaging GNS systemically delivered to tumors. NBI uses a narrow band of wavelengths matched to the chromophores of interest to highlight contrast between tissue constituents and exogenous contrast agents. Although we have used GNS as the NIR absorbing particle to provide contrast between hemoglobin and GNS in tumor, one could use other nanoparticles such as nanorods21 that can be tuned to absorb in the NIR or organic dyes such as Indocyanine Green.22 In tissue phantoms containing only hemoglobin, we observe peak contrast between 540 and (Fig. 4) consistent with the absorption peaks of hemoglobin. In tissue phantoms containing GNS and no hemoglobin, we observe high contrast throughout the 500- range with a peak at approximately . The GNS with a core diameter of and a shell thickness of are anticipated to have an absorption peak around .7 While the peak contrast in tissue phantoms is blue-shifted from that of pure GNS in solution, the contrast remains high above . Therefore, in order to avoid hemoglobin absorption contrast and maintain high contrast from GNS, one should choose a band greater than . Based on this analysis, hemoglobin contrast can be enhanced by selecting bands between , and GNS contrast can be enhanced by selecting bands between 620 and . In addition, as we move from the visible to NIR wavelengths, the scattering from tissue decreases, allowing for imaging of GNS at greater depths. Therefore, we chose to image tissue phantoms and murine tumors in two bands: VIS image and NIR image . The tissue phantom images obtained using the optimum imaging wavelengths demonstrate the concept of NBI [Fig. 3a]. Figure 5 depicts the intensity variations due to varying concentrations of GNS. In the composite NBI image, we observe the yellow color (control) to correspond to the tissue background as seen in Fig. 7f. The hemoglobin phantom is assigned a red channel to depict the color of blood in tissue. We observe that as the concentration of GNS increases, the yellow intensity decreases due to increase in absorption which is shown by the increasing intensity of green color. Figures 7 and 8 demonstrate magnified ex vivo images of mice inoculated with human colon cancer cells and injected with GNS. Although we did not quantify the imaging depth, the imaging depth should be related to tissue optical properties. Based on the mean free path (mfp), the imaging depth in the NIR is approximately . (The estimated mfp for rat skin is at ).23 We observe that GNS labeled in green are clearly distinguishable from blood vessels labeled in red. The black arrows highlight regions indicating the presence of GNS. The effects of uneven illumination result in the greenish background present in some of the composite NBI tumor images [e.g., Fig. 7c]. In these images, the background should ideally be uniformly yellow in color. The punctate areas in these composite NBI images are GNS. Improvement in the target illumination will eliminate shadows and hot spots in the collected images. Although we assume that the average concentration of GNS accumulated in the tumor is , GNS tend to accumulate in small focal volumes of high concentrations in tumors, as seen in Figs. 7c and 8. The contrast seen in these images can be related to the tissue-simulating phantoms in Fig. 5, suggesting that the focal areas of high GNS contrast have concentrations much higher than . In addition, the heterogeneous distribution of GNS suggests that the previously measured average concentration for the whole tumor is actually located in focal regions. Although our images show only superficial tissue layers, recent studies suggest that GNS accumulate in the tumor cortex,24 and therefore, this focal heterogeneous distribution is volumetric, suggesting that these hot spots may have concentrations many times the volumetric average values previously reported. Using NBI, we observed GNS accumulation in four of the five mice injected with GNS, represented in Figs. 7c and 8. We believe that the tumor identified with no accumulated GNS possibly had very minimal particles accumulated at the tumor site due to problems with particle delivery. This may be due to inadequate delivery of GNS to the tail vein during injection. We observed a heterogeneous accumulation of GNS in the GNS-injected mice. Previous studies have demonstrated this heterogeneous nature of GNS distribution in tumor. Li imaged the passive accumulation of GNS in murine colon tumors grown in BALB/c mice using photoacoustic microscopy and found GNS to accumulate heterogeneously in the tumor, characterized by high concentrations in the tumor cortex and very low concentrations in the tumor core.24 Park also reported the heterogeneous nature of GNS accumulation in tumor and found that GNS were located in close proximity to blood vessels using two-photon luminescence technique.13 In vivo thermal therapy of GNS accumulated tumor performed by Hirsch have reported that the temperature distribution from NIR irradiation is nonuniform due to the diffuse distribution of GNS over the tumor.6 Recently, Diagaradjane reported high concentrations of GNS within the perivascular region of tumors, accounting for the high temperature increase in this region that resulted in vascular disruption after radiation therapy.25 Further macroscopic NBI imaging could be performed to better understand the cause of the varying pattern of GNS accumulation and GNS accumulation specificity within the tumor. The composite narrow-band images demonstrate the potential use of the NIR NBI technique for identifying GNS accumulations within tissue and suggest several applications to this technique. Given that these particles preferentially accumulate at the tumor site, one may potentially use NIR NBI clinically to identify tumors and their margins during surgery pre- and post-resection. Given the high photothermal efficiency of GNS, NBI may be used as a combined imaging and photothermal therapy platform for both identifying and ablating tumors, their margins, and residual disease after resection. The narrow-band images could potentially guide in precise photothermal therapy without causing damage to surrounding normal tissue. For basic science applications, the narrow-band images of tumor accumulated with GNS will aid in understanding the nature of particle distribution within the tumor. For example, as metal nanoparticles are actively being studied for photothermal treatment of solid tumors, one may want to use NBI to image particle distributions within tumors of a test model (e.g., mouse tumor xenograft). As new applications for the use of NIR-absorbing nanoparticles are developed, NBI can serve as a tool for distinguishing particle locations within tissue. The proposed optical imaging technique is minimally invasive. The NBI system has simple instrumentation, is easily portable, and is “noncontact,” which facilitates clinical compatibility particularly in a sterile operating field. While we have demonstrated snapshot imaging in the current study, the simplicity of NBI instrumentation would allow for video-rate imaging. The composite NBI image obtained containing the enhanced visualization of blood vessels and GNS will help in understanding the extent of angiogenesis at a macroscopic level. The feasibility of NBI could potentially be extended to imaging other types of tumors and vascular lesions as well. 5.ConclusionIn summary, we have demonstrated that NIR NBI can effectively highlight GNS systemically delivered to tumors. We illuminated the target using broadband light and collected narrow-band images in the VIS and NIR to highlight absorption of hemoglobin and GNS. We quantitatively identified the narrow wavelength bands for imaging that provide enhanced visualization of both hemoglobin and GNS in tumors. The preliminary results obtained from in vitro and ex vivo imaging are promising and also suggest that NIR NBI is a feasible technique to identify positive margins during surgical resection of tumors. The identification of tumor regions is a first step to image-guided surgical removal of tumor margins or photothermal therapy. The NBI technique could potentially provide a platform for integrated cancer imaging and therapy. AcknowledgmentsThe funding for this research was provided in part by the National Institutes of Health (Grant No. R01 CA132032). ReferencesS. J. Oldenburg, R. D. Averitt, S. L. Westcott, and N. J. Halas,
“Nanoengineering of optical resonances,”
Chem. Phys. Lett., 288
(2–4), 243
–247
(1998). https://doi.org/10.1016/S0009-2614(98)00277-2 0009-2614 Google Scholar
L. Tang, L. Liu, and H. B. Elwing,
“Complement activation and inflammation triggered by model biomaterial surfaces,”
J. Biomed. Mater. Res., 41
(2), 333
–340
(1998). https://doi.org/10.1002/(SICI)1097-4636(199808)41:2<333::AID-JBM19>3.0.CO;2-L 0021-9304 Google Scholar
C. Loo, L. Hirsch, M. H. Lee, E. Chang, J. West, N. Halas, and R. Drezek,
“Gold nanoshell bioconjugates for molecular imaging in living cells,”
Opt. Lett., 30
(9), 1012
–1014
(2005). https://doi.org/10.1364/OL.30.001012 0146-9592 Google Scholar
H. Maeda, J. Fang, T. Inutsuka, and Y. Kitamoto,
“Vascular permeability enhancement in solid tumor: various factors, mechanisms involved, and its implications,”
Int. J. Immunopharmacol, 3
(3), 319
–328
(2003). https://doi.org/10.1016/S1567-5769(02)00271-0 0192-0561 Google Scholar
D. P. O’Neal, L. R. Hirsch, N. J. Halas, J. D. Payne, and J. L. West,
“Photo-thermal tumor ablation in mice using near infrared-absorbing nanoparticles,”
Cancer Lett., 209
(2), 171
–176
(2004). https://doi.org/10.1016/j.canlet.2004.02.004 0304-3835 Google Scholar
L. R. Hirsch, R. J. Stafford, J. A. Bankson, S. R. Sershen, B. Rivera, R. E. Price, J. D. Hazle, N. J. Halas, and J. L. West,
“Nanoshell-mediated near-infrared thermal therapy of tumors under magnetic resonance guidance,”
Proc. Natl. Acad. Sci. U.S.A., 100
(23), 13549
–3554
(2003). https://doi.org/10.1073/pnas.2232479100 0027-8424 Google Scholar
A. Lin, L. Hirsch, M. H. Lee, J. Barton, N. Halas, J. West, and R. Drezek,
“Nanoshell-enabled photonics-based imaging and therapy of cancer,”
Technol. Cancer Res. Treat., 3
(1), 33
–40
(2004). 1533-0346 Google Scholar
C. Loo, A. Lowery, N. Halas, J. West, and R. Drezek,
“Immunotargeted nanoshells for integrated cancer imaging and therapy,”
Nano Lett., 5
(4), 709
–711
(2005). https://doi.org/10.1021/nl050127s 1530-6984 Google Scholar
A. M. Gobin, M. H. Lee, N. J. Halas, W. D. James, R. A. Drezek, and J. L. West,
“Near-infrared resonant nanoshells for combined optical imaging and photothermal cancer therapy,”
Nano Lett., 7
(7), 1929
–1934
(2007). https://doi.org/10.1021/nl070610y 1530-6984 Google Scholar
A. Agrawal, S. Huang, A. W. H. Lin, M. H. Lee, J. K. Barton, R. A. Drezek, and T. J. Pfefer,
“Quantitative evaluation of optical coherence tomography signal enhancement with gold nanoshells,”
J. Biomed. Opt., 11
(4), 041121
(2006). https://doi.org/10.1117/1.2339071 1083-3668 Google Scholar
Y. Wang, X. Xie, X. Wang, G. Ku, K. L. Gill, D. P. O’Neal, G. Stoica, and L. V. Wang,
“Photoacoustic tomography of a nanoshell contrast agent in the in vivo rat brain,”
Nano Lett., 4
(9), 1689
–1692
(2004). https://doi.org/10.1021/nl049126a 1530-6984 Google Scholar
M. Fournelle, K. Maass, H. Fonfara, H. J. Welsch, H. Hewener, C. Gunther, and R. M. Lemor,
“P6A-5 real-time optoacoustic imaging using near infrared absorbing gold nanoshells for contrast enhancement,”
Proc.-IEEE Ultrason. Symp., 2417
–2420
(2007). https://doi.org/10.1109/ULTSYM.2007.608 1051-0117 Google Scholar
J. Park, A. Estrada, K. Sharp, K. Sang, J. A. Schwartz, D. K. Smith, C. Coleman, J. D. Payne, B. A. Korgel, A. K. Dunn, and J. W. Tunnell,
“Two-photon-induced photoluminescence imaging of tumors using near-infrared excited gold nanoshells,”
Opt. Express, 16
(3), 1590
–1599
(2008). https://doi.org/10.1364/OE.16.001590 1094-4087 Google Scholar
L. Bickford, J. Sun, K. Fu, N. Lewinski, V. Nammalvar, J. Chang, and R. Drezek,
“Enhanced multi-spectral imaging of live breast cancer cells using immunotargeted gold nanoshells and two-photon excitation microscopy,”
Nanotechnology, 19
(3), 315102
(2008). https://doi.org/10.1088/0957-4484/19/31/315102 0957-4484 Google Scholar
K. Gono, T. Obi, M. Yamaguchi, N. Ohyama, H. Machida, Y. Sano, S. Yoshida, Y. Hamamoto, and T. Endo,
“Appearance of enhanced tissue features in narrow-band endoscopic imaging,”
J. Biomed. Opt., 9
(3), 568
–577
(2004). https://doi.org/10.1117/1.1695563 1083-3668 Google Scholar
T. Yoshida, H. Inoue, S. Usui, H. Satodate, N. Fukami, and S. Kudo,
“Narrow-band imaging system with magnifying endoscopy for superficial esophageal lesions,”
Gastrointest. Endosc., 59
(2), 288
–295
(2004). https://doi.org/10.1016/S0016-5107(03)02532-X 0016-5107 Google Scholar
H. Machida, Y. Sano, Y. Hamamoto, M. Muto, T. Kozu, H. Tajiri, and S. Yoshida,
“Narrow-band imaging in the diagnosis of colorectal mucosal lesions: a pilot study,”
Endoscopy, 36
(12), 1094
–1098
(2004). https://doi.org/10.1055/s-2004-826040 0013-726X Google Scholar
W. D. James, L. R. Hirsch, J. L. West, P. D. O’Neal, and J. D. Payne,
“Application of INAA to the build-up and clearance of gold nanoshells in clinical studies in mice,”
J. Radioanal. Nucl. Chem., 271
(2), 455
–459
(2007). https://doi.org/10.1007/s10967-007-0230-1 0236-5731 Google Scholar
R. T. Zaman, P. Diagaradjane, J. C. Wang, J. Schwartz, N. Rajaram, K. L. Gill-Sharp, S. H. Cho, H. G. Rylander III, J. D. Payne, S. Krishnan, and J. W. Tunnell,
“In vivo detection of gold nanoshells in tumors using diffuse optical spectroscopy,”
IEEE J. Sel. Top. Quantum Electron., 13
(6), 1715
–1720
(2007). https://doi.org/10.1109/JSTQE.2007.910804 1077-260X Google Scholar
A. K. Jain, Fundamentals of Digital Image Processing, Prentice-Hall, Englewood Cliffs, NJ
(1988). Google Scholar
I. H. El-Sayed, X. Huang, and M. A. El-Sayed,
“Selective laser photo-thermal therapy of epithelial carcinoma using anti-EGFR antibody conjugated gold nanoparticles,”
Cancer Lett., 239
(1), 129
–135
(2006). https://doi.org/10.1016/j.canlet.2005.07.035 0304-3835 Google Scholar
M. M. Haglund, M. S. Berger, and D. W. Hochman,
“Enhanced optical imaging of human gliomas and tumor margins,”
Neurosurgery, 38
(2), 308
–317
(1996). https://doi.org/10.1097/00006123-199602000-00015 0148-396X Google Scholar
A. J. Welch and M. J. C. van Gemert, Optical-Thermal Response of Laser-Irradiated Tissue,
(1995) Google Scholar
M. L. Li, J. A. Schwartz, J. Wang, G. Stoica, and L. V. Wang,
“In vivo imaging of nanoshell extravasation from solid tumor vasculature by photoacoustic microscopy,”
Proc. SPIE, 6437 64370B
(2007). 0277-786X Google Scholar
P. Diagaradjane, A. Shetty, J. C. Wang, A. M. Elliott, J. Schwartz, S. Shentu, H. C. Park, A. Deorukhkar, R. J. Stafford, and S. H. Cho,
“Modulation of in vivo tumor radiation response via gold nanoshell-mediated vascular-focused hyperthermia: characterizing an integrated antihypoxic and localized vascular disrupting targeting strategy,”
Nano Lett., 8 1492
–1500
(2008). https://doi.org/10.1021/nl080496z 1530-6984 Google Scholar
|