|
|
|
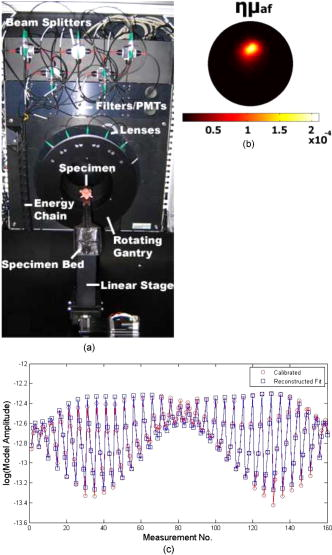
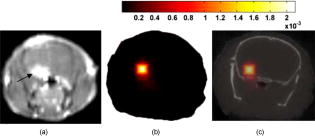
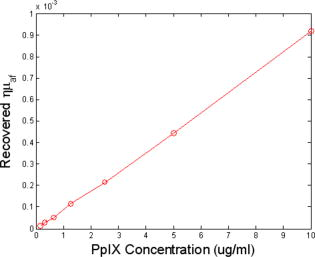
Fluorescence tomography provides a tool for preclinical molecular contrast agent assessment in oncology.1, 2, 3, 4 Systems have advanced in complexity to where noncontact imaging,5 automated boundary recovery,6 and sophisticated internal tissue shapes can be included in the recovered images. The translation of this work to humans will require molecular contrast agents that are amenable to regulatory approval and maintain tumor specificity in humans, where often nonspecific uptake of molecular imaging agents can decrease their utility. In this study, a new fluorescence tomography system coupled to microCT7 was used to illustrate diagnostic detection of orthotopic glioma tumors that were not apparent in the microCT images, using endogenous fluorescent contrast from protoporphyrin IX (PpIX). Glioma tumors provide significant endogenous fluorescence from PpIX,8, 9, 10, 11 and this is enhanced when the subject imaged has been administered aminolevulinic acid (ALA). The endogenous production process of PpIX is known to stem from the administered, ALA bypassing the regulatory inhibition of ALA synthase, allowing the heme synthesis pathway to proceed uninhibited. Since there is a limited supply of iron in the body, this process produces overabundance of PpIX rather than heme, and many tumors have been shown to have high yields of PpIX. Clinical trials with PpIX fluorescence guided resection of tumors have shown significant promise,12 and yet deep tissue imaging with PpIX fluorescence has not been exploited in clinical use. Early studies have shown that detection of these tumors with PpIX is feasible,13, 14 but no tomographic imaging has been used. This limitation in development has largely been caused by problems in wavelength filtering and low signal intensity, as well as background fluorescence from the skin limiting sensitivity to deeper structures. In the system developed and used here, this feasibility is demonstrated by imaging a human xenograft glioma model. To solve the sensitivity problem and study the ability to diagnostically image PpIX in vivo, time-correlated single-photon counting was used in the fluorescence tomography system, which provides maximum sensitivity. Figure 1a shows the system designed to match up with a microCT, allowing both x-ray structural and optical functional imaging sequentially. Lens-coupled detection of signals is acquired from the mouse using five time-resolved photomultiplier tubes (H7422P-50, Hamamatsu, Japan) with single-photon counting electronics (SPC-134 modules, Becker and Hickl GmbH, Germany). The system has fan-beam transmission geometry similar to a standard CT scanner, with single source delivery of a pulsed diode laser light at , collimated to a effective area on the animal. The five detection lenses were arranged in an arc, each with angular separation, centered directly on the opposite side of the animal with long working distance pickup,7 allowing noncontact measurement of the diffuse light through the animal. The diffuse intensity signals collected at each of the five channels were then translated via fibers and split using beamsplitters to be directed toward the fluorescence (95%) and transmission (5%) channel detectors. A long-pass filter was used in the fluorescence channels to isolate the signal, and in the transmitted intensity signals, a neutral density filter (2 OD) was used to attenuate the signals. This latter filtering was necessary to ensure that the fluorescence and transmission. Intensity signals fell within the same dynamic range, allowing a single acquisition for each detector. Scans were then performed by rotating the fan-beam around the specimen to 32 locations. A GE eXplore Locus SP scanner (GE Healthcare, London, Ontario, Canada) that incorporated a detector with resolution, a peak voltage, and a tube current of , was used in acquiring the microCT data, as displayed in Fig. 2 . In this example, since soft tissue was being imaged, the CT data was largely used to image the exterior of the animal, although in future studies, it could be used to isolate the cranium region as well. Fig. 1(a) Photograph of the fluorescence tomography system, with the main components labeled. (b) A tomography dataset as measured through a tissue phantom—the reconstructed image data is overlayed on this. (c) The recovered image from the phantom.  Fig. 2(a) Image of the rodent glioma tumor, as viewed by contrast magnetic resonance imaging. (b) The fluorescence tomography image of PpIX, and (c) the overlay of this image onto the microCT image of the cranium slice.  Calibration of the fluorescence tomography system was carried out with standard tissue-simulating epoxy resin phantoms with tissue-like scatter and absorption coefficients. The details of the calibration procedure have been reported previously7, 15, 16, 17 and a single phantom is shown here to illustrate the type of data, as shown in Fig. 1b. The phantom contained an liquid inclusion filled with PpIX. This concentration is similar to that seen in malignant gliomas.12, 13, 14 Experimental datasets were then calibrated into the fluorescence-to-transmission signal ratio at each detection location, and then the signal was scaled such that the average ratio matched that of the model.16, 18 In Fig. 1c, the calibrated dataset used to generate this image is shown along with the reconstructed fit, illustrating convergence of this dataset with near infrared fluorescence, absorption and scatter tomography (NIRFAST) finite-element-based nonlinear reconstruction.17, 19 The system noise was determined at SNR of 1.1% in the raw fluorescence-to-transmission data, as assessed by repeated samplings of a stable signal. This level is acceptable for reconstruction of the fluorescence yield and consistent with levels seen in previous diffuse tomography systems. The concentration of PpIX in the phantom was increased over ranges expected in tissue, and the images were reconstructed. The value in the region of interest was extracted and plotted in Fig. 3 . Fig. 3The reconstructed quantum yield multiplied by the fluorophore absorption coefficient is shown within the region of the phantom, for a range of increasing PpIX concentrations. The linearity of the recovery provides a reliable way to calibrate the concentration from within tomographic images.  The animal model was the U251 xenograft glioma line, grown in the laboratory for ongoing detection studies and published extensively13, 14 and is known to have high PpIX levels. The experimental plan was approved by the Institutional Animal Care and Use Committee. Briefly, cells were stereotactically implanted into the brain in of PBS through a Hamilton syringe, through a hole in the skull. Tumors were implanted deep into the brain with injection over . The tumor was incubated for and imaged in vivo with contrast magnetic resonance to assess size and location. Figure 2a shows a gadolinium-enhanced T1 weighted image of the tumor. A microCT dataset was then acquired and an exposure time of was used, with three repeated measurements at each of the 400 gantry angles, for a total acquisition time of . The mouse bed to hold the animal was the original microCT carbon fiber bed supplied by GE, with slots cut to allow optical measurement laterally across the cranium. After CT imaging, the animal and bed were positioned in the fluorescence tomography system, and a pre-ALA-injection dataset was acquired with 64 angles using integration time of per angle, with a total acquisition. Following administration of ALA and incubation over , the animal was reimaged using the fluorescence scanner, and a post-contrast dataset was generated. The external boundary representing the cranium in the 2-D region of interest was then segmented and used to create a finite element mesh20 for fluorescence tomography reconstruction. The contour information from the microCT allowed calculation of source and detector locations in an automated fashion. The peak Q-band excitation for PpIX is known to be at wavelength excitation with a molar absorption coefficient near , which is why the system designed here used this laser for excitation. The peak of the emission is near , which would be challenging to detect with excitation because of the problems in filtering. However, it has a long emission tail with a second peak out near , allowing effective fluorescence detection with the long-pass filters designed into the system. The fluorescence quantum yield of this compound is estimated to be near 0.5% (Ref. 16). The fluorescence-to-transmission ratio data was calibrated as in the phantom study and reconstructed to create the image in Fig. 2b. This was then superimposed on the microCT image, as shown in Fig. 2c, to create a hybrid structural functional image of the endogenous fluorescence contrast. The microCT image did not show any evidence of the tumor, and prior studies with injected contrast did not show any promise of visualizing this intracranial tumor, due to the inherent soft tissue contrast limitations of microCT imaging. Recovery of the spatial distribution of fluorescence yield was robust, however, and indicates an effective PpIX concentration near . This value is based on the phantom calibration curve, although exact quantitative recovery of tomographic images must be interpreted carefully with validation by similar-sized objects in similar positions to the true case. In summary, this paper presents initial evidence that noninvasive tomography of tumors with PpIX fluorescence can be achieved, using noncontact near-infrared signal measurement. The most important factor in being able to achieve this imaging was the use of single-photon counting, which allowed imaging through deep tissue in a reasonable time frame. Another important factor was the use of ratio data of the fluorescence-to-transmission signals, acquired simultaneously, because this ratio is resistant to many calibration errors, distance inaccuracies, or tissue heterogeneity. The exterior boundary from microCT provided higher accuracy in localization of the reconstructed volume, and so the combination of microCT and fluorescence tomography was beneficial. Further use of interior structures from microCT imaging could also enhance the localization and quantitative estimation of fluorescence in vivo. ReferencesV. Ntziachristos, C. H. Tung, C. Bremer, and R. Weissleder,
“Fluorescence molecular tomography resolves protease activity in vivo,”
Nat. Med., 8
(7), 757
–760
(2002). https://doi.org/10.1038/nm729 1078-8956 Google Scholar
H. K. Choi, D. Yessayan, H. J. Choi, E. Schellenberger, A. Bogdanov, L. Josephson, R. Weissleder, and V. Ntziachristos,
“Quantitative analysis of chemotherapeutic effects in tumors using in vivo staining and correlative histology,”
Cellular Oncol., 27
(3), 183
–190
(2005). Google Scholar
V. Ntziachristos, E. A. Schellenberger, J. Ripoll, D. Yessayan, E. Graves, A. Bogdanov Jr., L. Josephson, and R. Weissleder,
“Visualization of antitumor treatment by means of fluorescence molecular tomography with an annexin V-Cy5.5 conjugate,”
Proc. Natl. Acad. Sci. U.S.A., 101
(33), 12294
–12299
(2004). https://doi.org/10.1073/pnas.0401137101 0027-8424 Google Scholar
V. Ntziachristos,
“Fluorescence molecular imaging,”
Annu. Rev. Biomed. Eng., 8 1
–33
(2006). https://doi.org/10.1146/annurev.bioeng.8.061505.095831 1523-9829 Google Scholar
N. Deliolanis, T. Lasser, D. Hyde, A. Soubret, J. Ripoll, and V. Ntziachristos,
“Free-space fluorescence molecular tomography utilizing geometry projections,”
Opt. Lett., 32
(4), 382
–384
(2007). https://doi.org/10.1364/OL.32.000382 0146-9592 Google Scholar
H. Meyer, A. Garofalakis, G. Zacharakis, S. Psycharakis, C. Mamalaki, D. Kioussis, E. N. Economou, V. Ntziachristos, and J. Ripoll,
“Noncontact optical imaging in mice with full angular coverage and automatic surface extraction,”
Appl. Opt., 46
(17), 3617
–3627
(2007). https://doi.org/10.1364/AO.46.003617 0003-6935 Google Scholar
D. Kepshire, N. Mincu, M. Hutchins, J. Gruber, H. Dehghani, J. Hypnarowski, F. Leblond, M. Khayat, and B. W. Pogue,
“A microCT guided fluorescence tomography system for small animal molecular imaging,”
Rev. Sci. Instrum., 80 043701
(2009). 0034-6748 Google Scholar
J. C. Kennedy and R. H. Pottier,
“Endogenous protoporphyrin IX, a clinically useful photosensitizer for photodynamic therapy,”
J. Photochem. Photobiol., B, 14
(4), 275
–292
(1992). https://doi.org/10.1016/1011-1344(92)85108-7 1011-1344 Google Scholar
M. Kriegmair, R. Baumgartner, R. Knuechel, P. Steinbach, A. Ehsan, W. Lumper, F. Hofstadter, and A. Hofstetter,
“Fluorescence photodetection of neoplastic urothelial lesions following intravesical instillation of 5-aminolevulinic acid,”
Urology, 44
(6), 836
–841
(1994). https://doi.org/10.1016/S0090-4295(94)80167-3 0090-4295 Google Scholar
R. Cubeddu, G. Canti, P. Taroni, and G. Valentini,
“Delta-aminolevulinic acid induced fluorescence in tumor-bearing mice,”
J. Photochem. Photobiol., B, 30
(1), 23
–27
(1995). https://doi.org/10.1016/1011-1344(95)07157-W 1011-1344 Google Scholar
S. L. Marcus, R. S. Sobel, A. L. Golub, R. L. Carroll, S. Lundahl, and D. G. Shulman,
“Photodynamic therapy (PDT) and photodiagnosis (PD) using endogenous photosensitization induced by 5-aminolevulinic acid (ALA): current clinical and development status,”
J. Clin. Laser Med. Surg., 14
(2), 59
–66
(1996). 1044-5471 Google Scholar
W. Stummer, U. Pichlmeier, T. Meinel, O. D. Wiestler, F. Zanella, H.-J. Reulen, A.L.-G.S. Group,
“Fluorescence-guided surgery with 5-aminolevulinic acid for resection of malignant glioma: a randomised controlled multicentre phase III trial. [see comment],”
Lancet Oncol., 7
(5), 392
–401
(2006). https://doi.org/10.1016/S1470-2045(06)70665-9 1470-2045 Google Scholar
S. L. Gibbs-Strauss, J. A. O’Hara, P. J. Hoopes, T. Hasan, and B. W. Pogue,
“Noninvasive measurement of aminolevulinic acid-induced protoporphyrin IX fluorescence allows detection of glioma in vivo,”
J. Biomed. Opt., 14
(1), 014007
(2009). 1083-3668 Google Scholar
S. L. Gibbs-Strauss, J. A. O’Hara, S. Srinivasan, P. J. Hoopes, T. Hasan, and B. W. Pogue,
“Diagnostic detection of diffuse glioma tumors in vivo with molecular fluorescence transmission from endogenous proteins,”
Med. Phys., 36
(3), 974
–983
(2009). 0094-2405 Google Scholar
V. Ntziachristos, X. H. Ma, and B. Chance,
“Time-correlated single photon counting imager for simultaneous magnetic resonance and near-infrared mammography,”
Rev. Sci. Instrum., 69
(12), 4221
–4233
(1998). https://doi.org/10.1063/1.1149235 0034-6748 Google Scholar
S. C. Davis, R. Springett, C. Leussler, P. Mazurkewitz, S. Tuttle, S. L. Gibbs-Strauss, H. Dehghani, B. W. Pogue, and K. D. Paulsen,
“Magnetic resonance-coupled fluorescence tomography scanner for molecular imaging of small animals and human breasts,”
Rev. Sci. Instrum., 79 064302
(2008). https://doi.org/10.1063/1.2919131 0034-6748 Google Scholar
D. S. Kepshire, S. C. Davis, H. Dehghani, K. D. Paulsen, and B. W. Pogue,
“Subsurface diffuse optical tomography can localize absorber and fluorescent objects but recovered image sensitivity is nonlinear with depth,”
Appl. Opt., 46
(10), 1669
–1678
(2007). https://doi.org/10.1364/AO.46.001669 0003-6935 Google Scholar
V. Ntziachristos, G. Turner, J. Dunham, S. Windsor, A. Soubret, J. Ripoll, and H. A. Shih,
“Planar fluorescence imaging using normalized data,”
J. Biomed. Opt., 10
(6), 064007
(2005). https://doi.org/10.1117/1.2136148 1083-3668 Google Scholar
S. C. Davis, H. Dehghani, J. Wang, S. Jiang, B. W. Pogue, and K. D. Paulsen,
“Image guided diffuse optical fluorescence tomography implemented with Laplacian-type regularization,”
Opt. Express, 15
(7), 4066
–4082
(2007). https://doi.org/10.1364/OE.15.004066 1094-4087 Google Scholar
H. Dehghani, M. E. Eames, P. K. Yalavarthy, S. C. Davis, S. Srinivasan, C. M. Carpenter, B. W. Pogue, and K. D. Paulsen,
“Near infrared optical tomography using NIRFAST: algorithm for numerical model and image reconstruction,”
Commun. Numer. Methods Eng.,
(1069-8299) https://doi.org/10.1002/cnm.1162 Google Scholar
|

