|
|
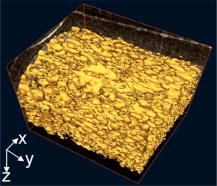
1.IntroductionThe main objectives of tissue engineering are to provide autologous bioengineered implants developed from the patient’s own cells and to support the body’s ability to regenerate.1, 2 Most tissue engineering strategies involve the use of 3-D porous constructs (scaffolds) to host cellular proliferation activities and to promote extracellular matrix (ECM) production. During the early stages of development, scaffolds are of critical importance in terms of their capability to support cell growth and to deliver sufficient amount of nutrients throughout the volume of the scaffold. Porosity, pore size, and interconnectivity of scaffold are the relevant key parameters that influence tissue development.3 Contrary to standard 2-D cell culture, diffusion alone can not provide adequate nutrient supply and waste disposal for structures larger than approximately in thickness.4, 5, 6 Consequently, engineered tissues are often cultured in bioreactors that provide dynamic fluid exchange,7, 8 primarily with perfusion systems. Fluid perfusion through the interconnected pores within microporous scaffolds ensures adequate nutrient exchange to promote survivability and growth of the developing tissue. An important consequence of the dynamic fluid flow inside the scaffold is to mechanically stimulate cells via fluid shear stress.9 In musculoskeletal tissues, mechanical stimuli generally increase ECM production by the cells.10, 11, 12, 13, 14 This increase in ECM alters the local fluid flow, providing a possible feedback mechanism to alter ECM production, which may lead to a complicated relationship between perfusion flow rate and tissue growth.11 This relationship has been well characterized for 2-D cultures where both simulation and experimental data are available.15, 16 However, the relationship from 2-D cultures cannot be directly translated to the studies of 3-D engineered tissue constructs, where complex 3-D porous scaffolds are used and the construct itself constantly evolves during the tissue development process. Thus, the determination of the relation between input perfusion rate and localized fluid flow inside scaffolds is an ongoing and challenging task faced by the tissue engineering community. Currently, approximations and numerical simulations are often employed to establish the relationship between input flow rate and fluid shear stress in 3-D scaffolds. Wang and Tarbell’s formula17 has been used to assess mean shear stress within a porous construct by relying on the use of Darcy’s law—a constitutive equation that is phenomenologically derived to describe the flow of a fluid through a porous medium. Similarly, a cylindrical pore model has been used to assess the shear stress according to the ratio of the input flow rate to the scaffold surface area.18 Finite element methods have been implemented for estimating localized fluid flow and shear stress in 3-D porous scaffolds.19 These results, however, apply only to a specific and predesigned scaffold that is used in the simulations. Despite these efforts, there is still lack of experimental data to confirm the actual localized fluid flows and shear stresses within the complex 3-D structures used in tissue engineering. Optical coherence tomography (OCT) is a noninvasive optical imaging technique20, 21, 22 that allows volumetric imaging of the internal architecture of 3-D specimens with high spatial resolution. OCT is analogous to ultrasound, except that near-infrared (NIR) light is used as opposed to sound, and its imaging contrast is based on optical properties of tissue rather than acoustic properties. Because of the use of optical wavelengths, OCT provides an imaging resolution that is of an order of magnitude higher than that of ultrasound, albeit with a much reduced imaging depth. Notwithstanding that OCT imaging depth is limited to within for highly scattering biological tissue,22 such an imaging depth is highly suitable for the monitoring of tissue growth in developing engineered tissues, where the growing tissue constructs are often only a few millimeters in thickness. A number of studies have investigated the potential of OCT technology as a noninvasive imaging tool to visualize cell dynamics in tissue models for tissue engineering.23, 24, 25, 26 By combining OCT with Doppler velocimetry, a technique called Doppler optical coherence tomography (DOCT) is possible.27, 28, 29 DOCT is a functional extension of OCT that can be used to measure localized fluid flows in highly scattering medium. This is based on the principle that the Doppler frequency shift of the light that is backscattered from the moving objects within a sample is either added to or subtracted from the probing optical frequency, depending on the flow direction. Standard OCT utilizes only the amplitude of backscattered light as a function of depth within the tissue, whereas DOCT uses the additional phase information of the available, complex OCT signals to monitor the velocities of moving particles in the backscattered spectrum. Thus, DOCT is capable of producing simultaneous images of both the tissue’s architecture and its localized fluid flow. In this article, we report, for the first time, the use of DOCT as a noninvasive imaging modality to explore 3-D architectural morphology, fluid flow, and shear stress in microporous chitosan scaffold—a biodegradable material that is the partially deacetylated derivative of chitin and is used in tissue engineering for effective cell attachment and growth. This optical imaging technique was developed and utilized in order to gain new insights into how the localized flow, and therefore the local shear stresses, vary between the micropores within 3-D scaffolds under a constant input flow rate. After demonstrating the method on a simple phantom model, we apply DOCT to quantify the porosity, interconnectivity, local fluid flow, and fluid shear stress distribution in two types of chitosan-based scaffolds used in tissue engineering. Last, microchannel scaffolds developed specifically for tendon engineering26, 30 are examined. 2.Materials and Methods2.1.DOCT SystemThe schematic diagram of the DOCT system used in this investigation is shown in Fig. 1 . Spectral domain DOCT31, 32 was chosen in the setup because this setup has a system sensitivity of more than as compared to the time-domain OCT systems,33, 34, 35 thus allowing rapid imaging, which is critical for 3-D volumetric optical imaging. In addition, the phase information of OCT signal is directly accessible in this configuration, which is a sine qua non for DOCT imaging of fluid flow. A detailed explanation of the system setup has been given in Refs. 36, 37. In brief, the system used a superluminescent diode with a central wavelength of and FWHM bandwidth of that yielded a measured axial resolution of in air. The sample light was coupled into a probe, consisting of a pair of X-Y galvanometer scanners and optics to both deliver the probing light onto the sample and collect the light backscattered from the sample. The lateral imaging resolution was approximately as determined by the objective lens that focused the light onto the sample. The irradiance on the sample surface was . The detection system was a custom-built high-speed spectrometer that had a designed spectral resolution of , resulting in an imaging depth of in air ( axis shown in Fig. 1). For imaging of the fluid flow within scaffolds, the camera integration time was set at for imaging, which meant that the imaging rate was at 10,000 axial scans per second. Fig. 1Schematic of the OCT system used to provide the 3-D microstructural and flow maps of the chitosan scaffolds. CCD—charge coupled device; PC—polarization controller. The inset shows the DOCT measurement geometry. 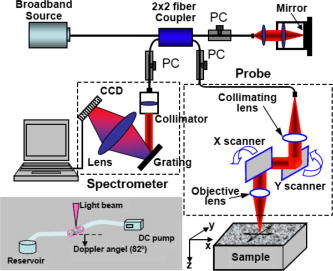 The current system used a phase-resolved DOCT approach to determine the velocity of fluid flow. Details of this approach can be found in Ref. 38. Briefly, the OCT signal in spectral domain OCT is a complex function, of which the magnitude is used to provide the imaging contrast for morphological structures of the sample. However, the phase term of the OCT signal is generally random along the depth , but fixed in position for the (relatively) static scatterers. A translation of the scatterers at position by a distance during the time interval between two successive axial scans will induce a change in the measured phase of the OCT signal given by where is the average refractive index of the sample, and is the average wave number of the light source used. This phase change is related to the Doppler frequency by . Evaluating at each depth yields depth-resolved measurements of both the magnitude and direction of the flow velocity. Assuming that the probe beam intersects the flow velocity vector at an angle (Doppler angle), the flow velocity is given byThe use of phase changes between successive OCT scans to assess the fluid flow requires the OCT signals in interferograms to be correlated.38 To meet this requirement, the interval between successive OCT scans was set to , while the probing beam spot was (transverse resolution).2.2.Scaffold FabricationTwo-percent chitosan solution was prepared by dissolving chitosan flakes (95% deacytalated, Sigma-Aldrich) in 1% v/v glacial acetic acid. The resulting solution was cast in cylindrical molds ( inner diameter) that were frozen overnight and subsequently freeze-dried. The degrees of porosity in the scaffolds were controlled by adjusting the freezing rate.39 The scaffolds were sequentially rehydrated in a gradient of ethanol (100%, 70%, 50%) and stored in phosphate buffered saline (PBS) before imaging under DOCT. Three sets of scaffolds were prepared for the current study: (1) low-porosity chitosan scaffolds (LPCS) with a pore size ranging from ; (2) high-porosity scaffolds (HPCS) with a pore size between 100 and ; and (3) microchannel chitosan scaffolds (MCS) within which a -diam microchannel was located in the center surrounded with micropores of size ranging from . Microchannel scaffolds were fabricated according to the protocol published in Ref. 26 by casting the chitosan solution in a mold in which a stainless steel needle was located at its central position. 2.3.Perfusion SystemThe perfusion system consisted of a -inner-diameter tubing connected to a precision DC pump. The sample chamber, made of a portion of the tubing, was fixed on a goniometer under the DOCT probe at an angle of from the horizontal to achieve a Doppler angle of . The system was set up to deliver a constant input flow rate of . A 0.5% latex microsphere ( in diameter) suspension was used as the light scattering medium to monitor the fluid flow through the scaffolds situated within the tube. Preliminary perfusion tests were performed to verify the flow measurements by use of a scattering flow phantom that was flowing in a -inner-diameter transparent plastic tube. 2.4.Shear StressIn a fluid, the tangential stress, , can be related to the shear rate by:40 where is the dynamic viscosity of the fluid. For the Dulbecco’s Modified Eagle’s Medium (DMEM) that we used in this study, we assumed that Ref. 41 Shear rate is a measure of the shear deformation rate, which is the divergence of the displacement rate vector at any point in 3-D space, , where is the displacement and the dot over the variable explicitly indicates the time derivative. Therefore, the magnitude of shear stress can be directly related to the fluid velocity measured by DOCT:where is the flow velocity vector, is one component of velocity in the direction (probe beam direction) measured by DOCT, is the normal direction of flow, which is perpendicular to the wall and . It is clear that to accurately calculate the shear stress, the Doppler angle must be known a priori. This condition can be met in simple geometries, such as pipe flow; however, for the fluid that flows in the complex micropores within the scaffold, it is not a trivial matter because is not generally known. To deal with this matter, we approximate as the Doppler angle as if the fluid flows in the bioreactor tube without the scaffold. This approximation, although crude, facilitates comparison of the OCT measurements with the previous published approximation approaches using Darcy’s law17 and the cylindrical pore model.182.5.Porosity and Interconnectivity AssessmentDOCT provides both the 3-D microstructural morphology and 3-D flow map for each measured scaffold. The combination of the structural and flow images permitted the direct measurement of porosity and interconnectivity for the chitosan scaffolds. The porosity was defined as the ratio of total pore volume to total chitosan volume as determined by the OCT structural images; it was determined by a block image processing.42 Briefly, in block processing for each B-scan, a threshold was set to discriminate between true empty pores and the pore walls. A binarized image was then produced and split into several blocks of equal area. The local porosity in each block, represented by the density of pixels, was mapped, ranging from 100% to 0%. As fluid flow existed only in the interconnected pores, it was used to assess interconnectivity. We defined the interconnectivity as the ratio of the total pore volume, from the OCT structural image (Fig. 1), to the interconnected volume, from the DOCT flow image. To improve the estimation accuracy, the OCT structural images were obtained from the scaffolds situated in the tube with perfusion of the PBS solution, while the OCT flow images were acquired from the same scaffold at the same location with perfusion of the light scattering medium. 3.Results3.1.Measurements of Scattering Fluid Flow in PhantomFigure 2a shows a representative structural OCT image of the tube phantom in which scattering fluid was flowing at controlled by a precision DC pump. The relatively transparent wall of the tubing is seen as the almost black region in the image, as the associated scattering is low compared to the latex particle solution flowing in the center of the tube. The flow velocity image obtained from DOCT and the associated shear stress, respectively, are shown in Figs. 2b and 2c. The flow velocity is at its maximum in the center and decreases with radial distance to the wall. After the Doppler angle correction, the measured maximum velocity in the center of lumen was ( dev., ) mm/s. This result is consistent with that calculated from hydrodynamic theory, the value of which is under the assumption of laminar flow in the tube.43 Since the Reynolds number in this case was significantly less than the critical value of 1800, the assumption of laminar flow in the tube is valid.44 The distribution of the velocity of the fluid flow inside the cylindrical channel has a parabolic profile, as is clearly revealed in Fig. 2d, which corresponds to the region marked as the dashed box in Fig. 2b. The corresponding shear stress was calculated to be approximately zero near the center. The shear stress was a maximum at the wall with a calculated value of , while the theoretical prediction was , using the assumption of laminar flow in the tube. Note that in order to minimize the noise artifacts present in the OCT velocity and shear stress images, a median filter was first applied to the velocity image to obtain the subsequent shear stress image. Fig. 2Typical cross-sectional DOCT images of the flow characteristics in a standard circular plastic tube: (a) the structural image, (b) the flow map, and (c) the corresponding shear stress map. (d) The 3-D flow velocity plot for the area marked by the dashed box in (b); the inset shows the velocity plot across the channel of the tube, i.e., along a line passing through the center, where it is seen that the flow is parabolic with the maximum in the center and minimum at the walls. The units for color bars shown are (a) dB, (b) mm/s, (c) , and (d) mm/s. The white bars indicate .  3.2.Low-porosity Chitosan ScaffoldsFigure 3a shows a typical cross-sectional image of LPCS acquired by the OCT system. The bidirectional flow velocity map obtained by DOCT is presented in Fig. 3b. Both the distribution and the magnitudes of the flow can be seen. To show the variations of velocities within pores, the magnitudes of bidirectional flow velocities were calculated and plotted in Fig. 3c, where the heterogeneous distribution of flow velocity in the porous structures is clearly revealed. Although the input flow rate was constant, the local fluid flow in this complex construct varied greatly in both magnitude and direction. Furthermore, the flow in the micropores did not show parabolic distributions. Consequently, the fluid shear stress, as shown in Fig. 3d, differed from pore to pore, with values ranging from . Nevertheless, the maximum fluid shear stress was generally located at the pore walls. Fig. 3DOCT monitored fluid flow in LPCS in situ. Shown are, respectively, (a) the microstructural image, (b) the bidirectional local fluid flow map, (c) the 3-D plot of magnitudes of the flow velocities, and (d) the corresponding local shear stress distribution in a typical section. The units for color bars shown are (a) dB, (b) mm/s, (c) mm/s, and (d) . The white bars indicate .  Figure 4 gives the 3-D volume-rendered image of the fluid flow through the isosurface reconstruction (i.e., reconstructed by enclosing all parts of a volume that are brighter than some user-defined threshold). As no flow is present in the isolated pores, the visualization of interconnected structures within chitosan scaffold can be readily appreciated. From these results, it appears that the pores of LPCS are nearly spherical and highly interconnected. 3.3.High-porosity Chitosan ScaffoldsWith the same imaging and perfusion conditions as for LPCS, Figs. 5a, 5b, 5c, 5d give, respectively, the structural image, the flow velocity map, the flow magnitude plot, and the fluid shear stress of a typical OCT cross section of HPCS. From these figures, it seems that the fluid flow exists mainly in the pores of relatively large size. The magnitude of the flow is inhomogeneously distributed within the pores, resulting in shear stresses ranging from . The 3-D reconstruction of the flow (Fig. 6 ) shows that the shape of pores tends to be ellipsoidal and elongated, and the pores are interconnected in a unidirectional way. The fluid flows preferentially along sequentially aligned pores. Fig. 5DOCT monitored fluid flow in HPCS in situ. Shown are, respectively, (a) the microstructural image, (b) the bidirectional local fluid flow map, (c) the 3-D plot of magnitudes of the flow velocities, and (d) the corresponding local shear stress distribution in a typical section. The units for color bars shown are (a) dB, (b) mm/s, (c) , and (d) mm/s. The white bars indicate .  3.4.Shear Stress Distribution within PoresThe distributions of shear stresses at the pore walls of both LPCS and HPCS in 12 random cross-sectional scans are shown in Figs. 7a and 7b, respectively. The shear stresses within LPCS were distributed more broadly than those within HPCS. This indicates that the constant input flow rate imparts a wide range of shear stress within the low-porosity chitosan scaffold. In Table 1, the mean shear stress of both LPCS and HPCS at the pore walls are compared with the values from the Wang and Tarbell approach17 and from the cylindrical pore model.18 All the values from DOCT are represented by . dev. For a constant input flow rate , the mean shear stress is significantly different between LPCS and HPCS (unpaired two-tailed -test, , ), and with different distributions. The shear stress is higher in the pores of LPCS compared to HPCS. In both cases, the experimental measurements were approximately one order of magnitude smaller than the mean shear stresses yielded by the Wang and Tarbell equation and the cylindrical pore model approximation. Fig. 7Wall shear stress distribution in a representative scan for (a) LPCS and (b) HPCS, respectively.  Table 1Comparison of the wall shear stress obtained from DOCT (n=12) with Wang and Tarbell and cylindrical pore models.
3.5.Microchannel Chitosan ScaffoldFigure 8a illustrates an OCT structure image of the microchannel chitosan scaffold (MCS) where the microchannel is seen as a relatively dark volume inside the scattering porous chitosan core. The flow velocity map indicates the fluid preferentially flowed in the microchannel [Fig. 8b]. The maximum measured velocity was . Low-velocity flows with magnitudes less than existed in the surrounding pores. However, the flow velocity distribution in the microchannel was not parabolic, as emphasized by a close-up of the ROI in Fig. 8c. Consequently, the fluid shear stress was nonuniformly distributed within the channel, with a non-null value at its center [see Fig. 8d]. The mean shear stress within the microchannel was . Fig. 8The flow characteristics for a chitosan scaffold with central microchannel measured by DOCT, where (a) the microstructural information and (b) the corresponding fluid flow can be visualized in situ. (c) The 3-D velocity plot of the region marked with the dashed box in (b), where the flow is nonparabolic within the microchannel. (d) The corresponding local shear stress distribution within the cross section. The units for color bars shown are (a) dB, (b) mm/s, (c) mm/s, and (d) . The white bars indicate .  3.6.HistologyH&E staining of the LPCS and HPCS sections, Figs. 9a and 9b, agree with the structural information acquired by DOCT. The pore size and shape can be observed. The pores in LPCS have sizes ranging from , whereas they are between in HPCS. The pore shapes revealed in the histological section may be inferred from the power spectra of the grayscale images of Figs. 9a and 9b through the 2-D Fourier transformation approach. The results are shown in the insets (upper-left corner) of the individual images, from which it can be seen that the shape of pores in LPCS is nearly spherical (nearly rounded power spectrum), whereas it tends to ellipsoidal in HPCS (elongated power spectrum). In both the cases, the pores are highly interconnected. 3.7.Porosity and InterconnectivityThe porosities of the LPCS and the HPCS calculated from a number of 3-D volumetric DOCT scans were and , respectively. These two values were significantly different ( -test, , ). Corresponding interconnectivity values were and , respectively, which were also significantly different ( -test, , ). 4.DiscussionOptical coherence tomography (OCT) has been demonstrated as a potential tool for in situ monitoring of volumetric architecture in tissue engineering constructs, and the addition of Doppler capability provides experimental fluid flow data within porous scaffolds. This information is valuable, as there is a consensus on the advantages of culturing tissue engineered constructs inside perfusion bioreactors.7, 8 Nutrient transport is greatly improved by dynamic fluid flow as compared to diffusion alone for scaffolds thicker than approximately .4, 5, 6 In this study, we have shown that the interconnectivity of a scaffold may be assessed by DOCT. The flow data can be correlated with the structural image to identify closed pores or regions. We have proposed a measure of the degree of interconnection based on the ratio of the volume where the fluid actually flows to the total volume of the pores. Such measurements may be useful in the optimization of the manufacturing of scaffolds. Our study shows that the interconnectivity varies between LPCS and HPCS scaffolds, with a lower interconnectivity for the latter. OCT provided 3-D microstructural and flow maps for an imaging depth up to within the highly scattering chitosan scaffolds. The imaging depth is limited by the scattering properties of the material and by the probing wavelength used. It was reported that a probing light with a wavelength longer than —for example, —would enhance the imaging depth when OCT images highly scattering tissue.45, 46 Therefore, increased imaging depth into the chitosan scaffolds might be obtained by using a probing light of wavelength as opposed to used in this study. By relying on the Doppler effect of the moving particles, theoretically DOCT could measure the fluid flow as small as tens of microns per second, largely limited by the system noise floor.21, 22 However, because of the optical heterogeneity of the sample, the sensitivity of the DOCT system to fluid flow is practically limited by the heterogeneous texture of the sample that appeared as the velocity noise floor in the DOCT flow images.47 For the current study with a separation between adjacent axial scans, the velocity noise floor was ; thus, the minimum measurable velocity is . Therefore, fluid flows with velocities less than were not detected by the current OCT system. Despite this problem, the measured shear stress using DOCT from the well-controlled phantom experiment exhibited only a deviation from the theoretical expectation . This implies that the current system may be sufficient to describe the shear stress within the simple geometries. However, the fact that the minimal resolvable flow velocity was at would likely lead to an underestimation of the calculated interconnectivity values for the scaffolds studied. This is the case for HPCS, where the flow is predominant in larger pores. We note that if the interconnectivity is the only parameter of interest, there are two possible solutions to correct this underestimation: (1) the flow rate is physically increased, and (2) the minimal resolvable flow velocity is improved through a careful system design or reduction of separation distance between adjacent axial scans during OCT imaging. We believe that a measure of the interconnectivity based on the pores where the nutritive fluid flows at appropriate values is a suitable measure for the optimization of 3-D cell culture. A constant perfusion rate induces fluid shear stress within a scaffold and therefore on the cells within the scaffold. Studies have shown that this mechanical stimulus could enhance ECM production for bone cells within values ranging from (Refs. 48, 49, 50, 51, 52). Shear stresses higher than the physiological window can decrease cell attachment and viability.30 Therefore, the determination of fluid shear stresses inside porous scaffolds is critical for tissue engineering. So far, several models have been explored in an attempt to establish a relationship between the input flow rate and the velocity within the porous constructs. Darcy’s law has been applied to 3-D collagen models with an assumption of homogeneous pore distribution, but it yields only a mean wall shear stress.17 The cylindrical pore approximation model18 does not reflect the complexity of the porous structures used in tissue engineering. Both models give values of the mean wall shear stress that are one order of magnitude greater than that measured by DOCT in this study. Numerical simulations by finite element methods compute the local fluid and the resulting shear stress flow in each pore according to an input flow rate.19 Although these results have not been yet validated by experimental data, they have shown the importance of the porosity and pore size on the distribution of the fluid shear stresses. This underlines the fact that input flow rate is not an independent parameter governing mechanical stimulation. Unfortunately, optimization of the input flow rate in terms of tissue generation in 3-D scaffolds by use of this model is valid only for its specific scaffold architecture. Furthermore, the current study revealed that the measured shear stress is different between LPCS and HPCS for the same input flow rate. This difference implies that the input flow rate alone might not be used to describe the mechanical stimuli applied to the cells. DOCT allows real-time in situ measurements of the fluid shear stress at localized positions within a porous scaffold, and the results shown in this study emphasize the need to experimentally measure the fluid velocity within the scaffolds. We found that within the porous scaffolds, the local fluid flow is not uniformly distributed among the pores and there is a large variation in the magnitude of the flow velocities. This results in a variation of the fluid shear stresses from pore to pore, which may lead to a nonhomogeneous cell attachment, cell proliferation, and ECM production. The measured mean shear stress (around ) for a typical input flow rate of is an order of magnitude below the values previously reported.17, 18 This result may indicate that cells could be stimulated by even lower levels of shear stress than that stated in previous studies. Once the porosity has decreased due to tissue growth, the fluid shear stress could reach physiological values. In a previous study,26 it has been postulated that microporous scaffolds with an inner microchannel could be used for tendon tissue engineering. It was shown that this architecture supports cell growth and ECM deposition within the microchannel when cultured in a perfusion bioreactor, leading eventually to collagen bundle formation.26 In the present paper, DOCT results support this postulation, as the flow predominantly exists in the microchannel that would encourage the tissue growth at this location. However the impact of the nonhomogeneous distribution of the fluid shear stress inside the microchannel requires further investigation. The challenge in optimizing the parameters of a perfusion bioreactor is that there is a feedback loop of tissue growth on the distribution and magnitude of the fluid flow velocity. For a constant input flow rate, the mean shear stress may increase continuously until a nonviable value is reached, resulting in localized cell and ECM detachment and tissue resorption. This, in turn, would decrease the local fluid flow velocity, until equilibrium is reached. Additionally, tissue growth could result in a loss of interconnectivity, by isolating large portions of the scaffolds from nutritive flow. Ultimately, only noninvasive, in situ measurements of both structural information and actual fluid shear stress during tissue development will allow the optimization of perfusion bioreactors for tissue engineering. 5.ConclusionsWe have demonstrated that the localized fluid flow and shear stress within porous scaffolds can be experimentally evaluated by Doppler optical coherence tomograph (DOCT). Three types of porous chitosan scaffolds have been explored by DOCT in order to gain new insight into how the fluid flow, and therefore the shear stress, varies within the micropores when the scaffolds were subjected to a constant input flow rate. With the input flow rate kept at , we have shown that the behavior of the fluid flow and shear stress in micropores is strongly dependent on the micropore interconnectivity, porosity, and size of pores within the scaffolds. The fluid flows were found to have greater variation within the low-porosity scaffold than in the high-porosity scaffold, leading to a broader distribution of the shear stress for the former, with a mean value of versus at the pore walls (Table 1). For the microporous scaffold in which there was a microchannel in diameter, the fluid flow predominantly existed in the microchannel. In addition, we have also shown that with the DOCT images, a number of key parameters relevant to the scaffold—for example, porosity and interconnectivity—can be quantified. AcknowledgmentsThe work was supported in part by research grants from the National Heart, Lung, and Blood Institute (1R01 HL093140-01), the American Heart Association Grant-in-Aid (0855733G), and the Biotechnological and Biological Sciences Research Council, UK (BBS/B/04242). The content is solely the responsibility of the authors and does not necessarily represent the official views of grant-giving bodies. ReferencesR. Langer and J. P. Vacanti,
“Tissue engineering,”
Science, 260 920
–926
(1993). https://doi.org/10.1126/science.8493529 0036-8075 Google Scholar
L. G. Griffith and G. Naughton,
“Tissue engineering—current challenges and expanding opportunities,”
Science, 295 1009
–1014
(2002). https://doi.org/10.1126/science.1069210 0036-8075 Google Scholar
T. S. Karande, J. L. Ong, and C. M. Agrawal,
“Diffusion in musculoskeletal tissue engineering scaffolds: design issues related to porosity, permeability, architecture, and nutrient mixing,”
Ann. Biomed. Eng., 32 1728
–1743
(2004). https://doi.org/10.1007/s10439-004-7825-2 0090-6964 Google Scholar
L. G. Cima and R. Langer,
“Engineering human tissue,”
Chem. Eng. Prog., 89 46
–50
(1993). 0360-7275 Google Scholar
C. K. Colton,
“Implantable biohybrid artificial organs,”
Cell Transplant, 4 415
–436
(1995). https://doi.org/10.1016/0963-6897(95)00025-S 0963-6897 Google Scholar
R. L. Carrier,
“Perfusion improves tissue architecture of engineered cardiac muscle,”
Tissue Eng., 8 175
–188
(2002). https://doi.org/10.1089/107632702753724950 1076-3279 Google Scholar
I. Martin, D. Wendt, and M. Heberer,
“The role of bioreactors in tissue engineering,”
Trends Biotechnol., 22 80
–86
(2004). https://doi.org/10.1016/j.tibtech.2003.12.001 0167-7799 Google Scholar
L. E. Freed and G. Vunjak-Novakovic,
“Tissue engineering bioreactors,”
Principles of Tissue Engineering, 143
–156 Academic Press, San Diego
(2000). Google Scholar
J. A. Frangos, L. V. Mclntire, and S. G. Eskin,
“Shear stress induced stimulation of mammalian cell metabolism,”
Biotechnol. Bioeng., 32 1053
–1060
(1988). https://doi.org/10.1002/bit.260320812 0006-3592 Google Scholar
T. Davisson, R. L. Sah, and A. Ratcliffe,
“Perfusion increases cell content and matrix synthesis in chondrocyte three-dimensional cultures,”
Tissue Eng., 8 807
–816
(2002). https://doi.org/10.1089/10763270260424169 1076-3279 Google Scholar
G. N. Bancroft, V. I. Sikavitsas, J. van den Dolder, T. L. Sheffield, C. G. Ambrose, J. A. Jansen, and A. G. Mikos,
“Fluid flow increases mineralized matrix deposition in 3-D perfusion culture of marrow stromal osteoblasts in a dose-dependent manner,”
Proc. Natl. Acad. Sci. U.S.A., 99 12600
–12605
(2002). https://doi.org/10.1073/pnas.202296599 0027-8424 Google Scholar
V. I. Sikavitsas, G. N. Bancroft, H. L. Holtorf, J. A. Jansen, and A. G. Mikos,
“Mineralized matrix deposition by marrow stromal osteoblasts in 3-D perfusion culture increases with increasing fluid shear forces,”
Proc. Natl. Acad. Sci. U.S.A., 100 14683
–14688
(2003). https://doi.org/10.1073/pnas.2434367100 0027-8424 Google Scholar
A. M. Freyria, Y. Yang, H. Chajra, C. F. Rousseau, M. C. Ronzière, D. Herbage, and A. J. El Haj,
“Optimization of dynamic culture conditions: effects on biosynthetic activities of chondrocytes grown in collagen sponges,”
Tissue Eng., 11 674
–684
(2005). https://doi.org/10.1089/ten.2005.11.674 1076-3279 Google Scholar
Y. Yang and A. J. El Haj,
“Bone tissue engineering,”
SCOPE, 13 33
–35
(2004). 0271-972X Google Scholar
C. R. Jacobs, C. E. Yellowley, B. R. Davis, Z. Zhou, J. M. Cimbala, and H. J. Donahue,
“Differential effect of steady versus oscillating flow on bone cells,”
J. Biomech., 31 969
–976
(1998). https://doi.org/10.1016/S0021-9290(98)00114-6 0021-9290 Google Scholar
M. Edlich, C. E. Yellowley, C. R. Jacobs, and H. J. Donahue,
“Oscillating fluid flow regulates cytosolic calcium concentration in bovine articular chondrocytes,”
J. Biomech., 34 59
–65
(2001). https://doi.org/10.1016/S0021-9290(00)00158-5 0021-9290 Google Scholar
S. Wang and J. M. Tarbell,
“Effect of fluid flow on smooth muscle cells in a 3-dimensional collagen gel model,”
Arterioscler., Thromb., Vasc. Biol., 20 2220
–2225
(2000). 1079-5642 Google Scholar
A. S. Goldstein, T. M. Juarez, C. D. Helmke, M. C. Gustin, and A. G. Mikos,
“Effect of convection on osteoblastic cell growth and function in biodegradable polymer foam scaffolds,”
Biomaterials, 22 1279
–1288
(2001). https://doi.org/10.1016/S0142-9612(00)00280-5 0142-9612 Google Scholar
F. Boschetti, M. T. Raimondi, F. Migliavacca, and G. Dubini,
“Prediction of the micro-fluid dynamic environment imposed to three-dimensional engineered cell systems in bioreactors,”
J. Biomech., 39 418
–425
(2006). https://doi.org/10.1016/S0021-9290(06)85506-5 0021-9290 Google Scholar
D. Huang, E. Swanson, C. Lin, J. Schuman, W. Stinson, W. Chang, M. Hee, T. Flotte, K. Gregory, C. Puliafito, and J. Fujimoto,
“Optical coherence tomography,”
Science, 254 1178
–1181
(1991). https://doi.org/10.1126/science.1957169 0036-8075 Google Scholar
A. F. Fercher, W. Drexler, C. K. Hitzenberger, and T. Lasser,
“Optical coherence tomography—principles and applications,”
Rep. Prog. Phys., 66 239
–303
(2003). https://doi.org/10.1088/0034-4885/66/2/204 0034-4885 Google Scholar
P. H. Tomlins and R. K. Wang,
“Theory, development and applications of optical coherence tomography,”
J. Phys. D, 38 2519
–2535
(2005). https://doi.org/10.1088/0022-3727/38/15/002 0022-3727 Google Scholar
X. Xu, R. K. Wang, and A. J. El Haj,
“Investigation of changes in optical attenuation of bone and neuronal cells in organ culture or three-dimensional constructs in vitro with optical coherence tomography: relevance to cytochrome oxidase monitoring,”
Eur. Biophys. J., 32 355
–362
(2003). https://doi.org/10.1007/s00249-003-0285-z 0175-7571 Google Scholar
W. Tan, A. Sendemir-Urkmez, L. J. Fahrner, R. Jamison, D. Leckband, and S. A. Boppart,
“Structural and functional optical imaging of three-dimensional engineered tissue development,”
Tissue Eng., 10 1747
–1756
(2004). https://doi.org/10.1089/ten.2004.10.1747 1076-3279 Google Scholar
Y. Yang, A. Dubois, X. P. Qin, J. Li, A. J. El Haj, and R. K. Wang,
“Investigation of optical coherence tomography as an imaging modality in tissue engineering,”
Phys. Med. Biol., 51 1649
–1659
(2006). https://doi.org/10.1088/0031-9155/51/7/001 0031-9155 Google Scholar
P. O. Banganinchi, Y. Yang, N. Maffulli, R. K. Wang, and A. J. El Haj,
“Chitosan microchannel scaffolds for tendon tissue engineering characterized by optical coherence tomography,”
Tissue Eng., 13 313
–322
(2007). https://doi.org/10.1089/ten.2006.0133 1076-3279 Google Scholar
Z. Chen, T. Milner, D. Dave, and J. Nelson,
“Optical Doppler tomographic imaging of fluid flow velocity in highly scattering media,”
Opt. Lett., 22 64
–66
(1997). https://doi.org/10.1364/OL.22.000064 0146-9592 Google Scholar
Z. Chen, Y. Zhao, S. Srinivas, J. Nelson, N. Prakash, and R. Frostig,
“Optical Doppler tomography,”
IEEE J. Sel. Top. Quantum Electron., 5 1134
–1142
(1999). https://doi.org/10.1109/2944.796340 1077-260X Google Scholar
R. K. Wang,
“High-resolution visualization of fluid dynamics with Doppler optical coherence tomography,”
Meas. Sci. Technol., 15 725
–733
(2004). https://doi.org/10.1088/0957-0233/15/4/016 0957-0233 Google Scholar
P. O. Bagnaninchi, Y. Yang, A. J. El Haj, and N. Maffuli,
“Tissue engineering for tendon repair,”
Br. J. Sports Med., 41 e10
(2007). https://doi.org/10.1136/bjsm.2006.030643 0306-3674 Google Scholar
A. F. Fercher, C. K. Hitzenberger, G. Kamp, and S. Y. El-Zaiat,
“Measurement of intraocular distances by backscattering spectral interferometry,”
Opt. Commun., 117 43
–48
(1995). https://doi.org/10.1016/0030-4018(95)00119-S 0030-4018 Google Scholar
G. Hausler and M. W. Linduer,
“Coherence radar and spectral radar—new tools for dermatological diagnosis,”
J. Biomed. Opt., 3 21
–31
(1998). https://doi.org/10.1117/1.429899 1083-3668 Google Scholar
J. F. de Boer, B. Cense, B. H. Park, M. C. Pierce, G. J. Tearney, and B. E. Bouma,
“Improved signal-to-noise ratio in spectral-domain compared with time-domain optical coherence tomography,”
Opt. Lett., 28 2067
–2069
(2003). https://doi.org/10.1364/OL.28.002067 0146-9592 Google Scholar
M. A. Choma, M. V. Sarunic, C. Yang, and J. A. Izatt,
“Sensitivity advantage of swept source and Fourier domain optical coherence tomography,”
Opt. Express, 11 2183
–2189
(2003). 1094-4087 Google Scholar
R. Leitgeb, C. K. Hitzenberger, and A. F. Fercher,
“Performance of Fourier domain vs. time domain optical coherence tomography,”
Opt. Express, 11 889
–894
(2003). 1094-4087 Google Scholar
R. K. Wang and Z. H. Ma,
“A practical approach to eliminate autocorrelation artifacts for volume-rate spectral domain optical coherence tomography,”
Phys. Med. Biol., 51 3231
–3239
(2006). https://doi.org/10.1088/0031-9155/51/12/015 0031-9155 Google Scholar
R. K. Wang, S. Jacques, Z. Ma, S. Hurst, S. Hanson, and A. Gruber,
“Three-dimensional optical angiography,”
Opt. Express, 15 4083
–4097
(2007). https://doi.org/10.1364/OE.15.004083 1094-4087 Google Scholar
Y. Zhao, Z. P. Chen, C. Saxer, S. Xiang, J. F. de Boer, and J. S. Nelson,
“Phase-resolved optical coherence tomography and optical Doppler tomography for imaging blood flow in human skin with fast scanning speed and high velocity sensitivity,”
Opt. Lett., 25 114
–116
(2000). https://doi.org/10.1364/OL.25.000114 0146-9592 Google Scholar
S. V. Madihally and H. W. Matthew,
“Porous chitosan scaffolds for tissue engineering,”
Biomaterials, 20 1133
–1142
(1999). https://doi.org/10.1016/S0142-9612(99)00011-3 0142-9612 Google Scholar
P. M. Gerhart, Fundamentals of Fluid Mechanics, Addison-Wesley, Boston (1992). Google Scholar
M. T. Raimondi, F. Boschetti, L. Falcone, G. B. Fiore, A. Remuzzi, M. Marazzi, E. Marinoni, and R. Pietrabissa,
“Mechanobiology of engineered cartilage cultured under a quantified fluid dynamic environment,”
Biomech. Model. Mechanobiol., 1 69
–82
(2002). https://doi.org/10.1007/s10237-002-0007-y 1617-7959 Google Scholar
Y. Yang, P. Bagnaninchi, M. Wood, A. El Haj, E. Guyot, A. Dubois, and R. K. Wang,
“Monitoring cell profile in tissue engineered constructs by OCT,”
Proc. SPIE, 5695 51
–57
(2005). https://doi.org/10.1117/12.592752 0277-786X Google Scholar
R. K. Wang,
“High resolution visualization of fluid dynamics with Doppler optical coherence tomography,”
Meas. Sci. Technol., 15 725
–733
(2004). https://doi.org/10.1088/0957-0233/15/4/016 0957-0233 Google Scholar
L. D. Landau and E. M. Lifshitz, Fluid Mechanics, 106 2nd ed.Pergamon Press, Oxford, UK
(1987). Google Scholar
Y. Pan and D. L. Farkas,
“Noninvasive imaging of living human skin with dual–wavelength optical coherence tomography in two and three dimensions,”
J. Biomed. Opt., 3 446
–465
(1998). https://doi.org/10.1117/1.429897 1083-3668 Google Scholar
R. K. Wang and S. Hurst,
“Mapping of cerebrovascular blood perfusion in mice with skin and cranium intact by optical micro-angiography at wavelength,”
Opt. Express, 15 11402
–11412
(2007). https://doi.org/10.1364/OE.15.011402 1094-4087 Google Scholar
R. K. Wang and Z. Ma,
“Real-time flow imaging by removing texture pattern artifacts in ultrafast spectral domain optical Doppler tomography,”
Opt. Lett., 31 3001
–3003
(2006). https://doi.org/10.1364/OL.31.003001 0146-9592 Google Scholar
T. L. Donahue, T. R. Haut, C. E. Yellowley, H. J. Donahue, and C. R. Jacobs,
“Mechanosensitivity of bone cells to oscillating fluid flow induced shear stress may be modulated by chemotransport,”
J. Biomech., 36 1363
–1371
(2003). https://doi.org/10.1016/S0021-9290(03)00118-0 0021-9290 Google Scholar
K. M. Reich and J. A. Frangos,
“Effect of flow on prostaglandin E2 and inositol trisphosphate levels in osteoblasts,”
Am. J. Physiol., 261 428
–432
(1991). 0002-9513 Google Scholar
J. Klein-Nulend, A. van der Plas, C. M. Semeins, N. E. Ajubi, J. A. Frangos, P. J. Nijweide, and E. H. Burger,
“Sensitivity of osteocytes to biomechanical stress in vitro,”
FASEB J., 9 441
–445
(1995). 0892-6638 Google Scholar
C. H. Turner and F. M. Pavalko,
“Mechanotransduction and function response of the skeleton to physical stress: the mechanisms and mechanics of bone adaptation,”
J. Orthop. Sci., 3 346
–355
(1998). https://doi.org/10.1007/s007760050064 0949-2658 Google Scholar
S. Weinbaum, S. C. Cowin, and Y. A. Zeng,
“A model for the excitation of osteocytes by mechanical loading induced bone fluid shear stresses,”
J. Biomech., 27 339
–360
(1994). https://doi.org/10.1016/0021-9290(94)90010-8 0021-9290 Google Scholar
|