|
|
1.IntroductionTraumatic brain injury (TBI) is a leading cause of childhood morbidity and mortality in the United States, with an annual rate of per 100,000 children requiring hospitalization.1 The increasing monetary costs result not only from the acute intensive care for these patients but also from long-term care that is often necessary. Brain injuries in these patients result from both the primary trauma and secondary insults, such as reductions in cerebral blood flow, derangements in cerebral metabolism, and the ensuing ischemic injuries that continue to progress well after the traumatic event. Optimal therapeutic efficacy thus requires knowledge of cerebral blood flow, oxygen supply, and oxygen consumption in patients after TBI. In this study, we explored the feasibility of two diffuse optical techniques, diffuse reflectance spectroscopy (DRS) and diffuse correlation spectroscopy (DCS), for continuous, noninvasive measurement of cerebral blood flow and blood oxygenation at the bedside. The study employed a nonimpact inertial rotational model of a closed head injury in neonatal piglets, which produces a diffuse pattern of axonal injury similar to that observed in severely head-injured infants.2 The piglet brain is a good model because the gyral pattern, distribution of gray and white matter, and normal cerebral blood flow and metabolism are similar to those of human infants.3 The pathology resulting from this rotational head injury has been well characterized and includes axonal injury in both central and peripheral white matter, as well as subdural and subarachnoid blood over the cerebral hemispheres, particularly at the frontal lobes.2 Furthermore, neurobehavioral deficits in visual-based problem solving and exploration have been observed.4 However, the effects of this injury model on cerebral blood flow (CBF) have not yet been investigated. Recently, near-infrared (NIR) diffuse optical techniques have been employed in research and clinical settings to noninvasively characterize cerebral hemodynamics, including oxy- and deoxy-hemoglobin concentrations ( and Hb), blood oxygen saturation , total hemoglobin concentration (THC),5, 6 and to a lesser extent, blood flow.7, 8, 9, 10, 11 Many existing CBF measurement technolodgies have obvious limitations. For example, bolus injections of indocyanine green,12 or radioactive13 and fluorescent microspheres, 14, 15 only measure CBF at a few discrete time points. Transcranial Doppler ultrasonography16 measures flow velocities in only large vessels including the major cerebral arteries. Laser Doppler flowmetry17 requires opening of the scalp and skull for probe placement on the dura directly due to its shallow penetration. In contrast, NIR diffuse optical techniques permit continuous noninvasive measurements of cerebral hemodynamics in microvasculatures. DRS, also known as NIR spectroscopy, was introduced18 in 1977 and has been successfully used to measure hemoglobin concentration and blood oxygen saturation in both human infants19, 20, 21 and newborn piglets, whose scalps and skulls are thin enough to ensure a high signal-to-noise ratio.22, 23, 24, 25 However, continuous noninvasive CBF measurements in human infants and piglets have been limited until now. In this contribution, DCS,26, 27 also known as diffusing-wave spectroscopy28, 29 is employed for the continuous measurement of CBF through the intact scalp and skull in a newborn piglet TBI model. Relative cerebral blood flow (rCBF) measured with DCS and normalized by preinjury CBF was found to correlate strongly with rCBF measured using the fluorescent microsphere (FM) technique. In addition, DRS was used to simultaneously assess cerebral , Hb, THC, and noninvasively. TBI was found to have a significant impact on all of these cerebral hemodynamic parameters. Diffuse optical techniques were robust for the entire measured after injury and were sensitive to spontaneous, transient physiological events, such as apnea, cardiac arrest, and hypertonic saline infusion. The optically measured cerebral hemodynamics after injury were consistent with vital physiological recordings, including mean arterial blood pressure (MAP), arterial oxygen saturation , and heart rate (HR). The potential of diffuse optical techniques for bedside monitoring of cerebral hemodynamics in the neurointensive care unit is thus demonstrated. 2.Materials and Methods2.1.Animal Preparation and Measurement ProcedureAnimal procedures were conducted in accordance with the guidelines established by the National Institutes of Health and were approved by the Institutional Animal Care and Use Committee at the University of Pennsylvania. Eighteen anesthetized three- to five-day-old female piglets were used for the study. Each animal in group 1 received a single rotational injury, each animal in group 2 received a sham injury, and each animal in group 3 received a single rotational injury and a hypertonic saline infusion at postinjury (see Table 1 ). Each animal was intubated and maintained on 2.0–2.5% isoflurane. Catheters were placed in the femoral arteries for blood pressure monitoring and reference microsphere blood withdrawals, in the femoral vein for saline and phenylephrine infusion, and in the left ventricle of the heart via the right carotid artery for fluorescent microsphere injections. Vital physiological parameters, including MAP (in mmHg), HR in beats per minute (BPM), arterial oxygen saturation [ (in percent)], end-tidal [ (in mmHg)], and body temperature [ (in degrees Celsius)] were manually recorded every for the duration of each study; continuous recordings were conducted whenever available. Supplemental oxygen and mechanical ventilator support were used as needed to maintain normoxia and normocarpnia. Table 1Summary of all animals used in the study. CA+ : cardiac arrest; HS* : hypertonic (3 %) saline.
The piglet scalp was shaved for the optical measurements, and baseline optical readings were obtained. The optical probe was then removed, and the piglet head was secured to a padded snout clamp mounted to the linkage assembly of a HYGE pneumatic actuator (Bendix Corp., Southfield, Michigan), which converts an impulsive linear motion to a rotational motion.2 Immediately prior to injury, anesthesia was withdrawn. Brain injury was induced by a single rapid, nonimpact rotation of the head in the horizontal plane, with a mean peak-angular velocity of in group 1 and in group 3. The center of rotation was the midcervical spine. After injury, the animal was taken off the snout clamp, and the optical probe was repositioned on the scalp. Reflexive withdrawal to a pinch stimulus was assessed every minute for the first , then every thereafter. When the pinch reflex was positive, indicating return of consciousness, anesthesia was resumed. Phenylephrine was administered as needed to maintain MAP above and within of preinjury baseline levels. Changes in cerebral blood oxygenation, hemoglobin concentration, and blood flow relative to baseline were continuously measured with the optical probe beginning within the first after injury and until postinjury. Spontaneous physiological events, such as apnea (a period when an animal suspends breathing30) and cardiac arrest, and physiological perturbations, such as hypertonic saline infusion, were noted during the monitoring period and were used to investigate possible hemodynamic signatures in corresponding optical recordings. At postinjury, each piglet was sacrificed by an overdose of pentabarbital and the brain was perfusion fixed in formalin for fluorescent microsphere analysis. 2.2.DRSDRS was employed to measure cerebral blood oxygenation and hemoglobin concentrations of tissues located several centimeters into the brain through intact scalp and skull. A semi-infinite differential path-length factor method based on a modified Beer–Lambert law 23, 31 was employed to analyze the changes in light absorption at each wavelength (685, 785, and ). Changes in oxy-hemoglobin concentration and deoxy-hemoglobin concentration were extracted from the wavelength-dependent . The combination of these data yielded changes in total hemoglobin concentration and blood oxygen saturation , wherein the baseline THC and blood oxygenation in the healthy piglet brain were assumed to be and 60%, respectively. 23, 32 The reduced light scattering coefficient of the piglet brain was assumed to be , 24, 32 for analysis of the hemoglobin concentrations. Note, a prefix “r” is used throughout the paper to indicate the relative change of a parameter compared to its baseline level (e.g., ). 2.3.DCSDiffuse light also carries dynamic information about moving scatterers below the tissue surface [i.e., red blood cells (RBCs)]. In this case, a continuous wave, long-coherence-length laser is used as the light source . The speckle intensity temporal fluctuations, due to movements of the scatterers, is detected using a single-mode (or few-mode) optical fiber coupled to a high-sensitivity photon-counting detector. The decay rate of the temporal autocorrelation function of the detected intensity reveals tissue blood flow information (e.g., faster decay indicates higher blood flow.7, 8, 9, 10, 11, 26, 33, 34, 35 A correlation diffusion equation27 is used to model the propagation of the autocorrelation function in turbid media. The decay rate of the intensity autocorrelation function depends on tissue optical properties ( and ), and a flow-index , where is a unitless factor representing the fraction of scatterers that are moving (e.g., RBCs) and is an effective Brownian motion coefficient of the scatterers. We have observed in tissue studies that changes in correlate well with other flow measurement modalities such as laser Doppler,7, 36 color-weighted power Doppler ultrasound,33 Xenon CT,37 and arterial-spin-labeling magnetic resonance imaging (ASL-MRI).38, 39 Therefore, we report to indicate the CBF values in the piglet brain relative to the baseline (preinjury) measurements. The absorption coefficient of the piglet brain at was obtained from the DRS analysis and was used in a semi-infinite model26 to fit to the DCS auto-correlation curves and thus to minimize the influence of THC changes on rCBF measurements. Noise in the DCS correlation curve was estimated based on the model described previously and was employed herein to improve curve fitting.9 2.4.Hybrid Instrumentation and Optical ProbeA hybrid instrument combining both the DRS and DCS techniques was used for piglet measurements.40, 41 Three intensity modulated diode lasers (685, 785, and ) and a -long coherence-length laser (Crystalaser, reno, Nevada) were coupled to a optical switch (Dicon, Richmond, California), which enabled time sharing of the DRS and DCS measurements. The output of the source wavelength switch was fed into a second optical switch, which scanned over the four source positions on the optical probe (see Fig. 1 ). Four optical fibers were used for DRS detection, and four single-mode optical fibers were used for DCS detection. The fibers were arranged into two columns, probing the left and right hemispheres of the piglet brain, respectively. The source-detector separation ranged from , and the measurement at each position took , corresponding to a data acquisition rate of with each frame covering all four source positions. This rate is sufficient for capturing dynamic physiological changes on the scale of several minutes (see Section 3.5). Whenever available (see Table 1), analog outputs from a blood pressure monitor (Grass Technologies, West Warwick, Rhode Island) and a pulse oxymeter (Nellcor Puritan Bennett Inc., Boulder, Colorado) were continuously recorded concurrent with the DRS and DCS measurements. The system was fully automated, and marks were made and saved for the coregistration of various events. Fig. 1Arrangement of the optical probe. Four multimode source fibers (★), four DRS fibers (◆), and four single-mode DCS fibers (◼) were used for simultaneous DRS and DCS measurements. The fibers were arranged into two columns, oriented anteriorly posteriorly along most of the length of the left and right cerebral hemispheres on top of the piglet head. The source-detector separations ranged from . 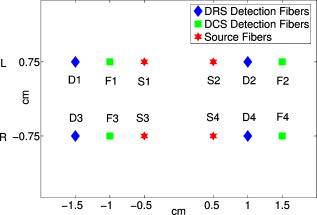 A custom opaque black hood was used to secure the optical probe onto the piglet head. A marker pen was used to outline the probe position so that the probe was placed at the same location on the piglet scalp before and after injury. In order to assess the influence of probe placement repeatability on the accuracy of the diffuse optical measurements, the optical probe was removed from the piglet head after the first baseline measurement and replaced about later for a second baseline measurement. These double-baseline measurements were conducted before injury in six animals. 2.5.Fluorescent Microsphere Measurements of Cerebral Blood FlowIn this study, FMs14, 15 were used to measure CBF for comparison to the optical method. Prior to injury, catheters were surgically placed in the femoral artery for FM reference blood withdrawals, and catheters were surgically plugged in the left ventricle of the heart via the right carotid artery for FM injections. At each time point, -diam fluorescently labeled microspheres (Molecular Probes, Invitrogen, Carlsbad, California) were injected into the left ventricle with of heparinized saline for . A reference blood sample was withdrawn at from the femoral artery beginning before injection and continuing until after injection completion. Fluorescent microspheres having different excitation/emission spectra were injected during baseline optical measurements and at discrete time points postinjury ( , , and ). Fixed brains were cut into -thick coronal sections. Sections were embedded in 2% agarose gel and cut by vibratome (Leica VT1000S, Leica Microsystems GmbH, Wetzlar, Germany) into -thick slices, which were then mounted onto microscope slides with gel mount (Biomeda, Foster City, California). Reference blood samples were filtered four times using -pore polycarbonate membranes (Osmonics, Minnetonka, Minnesota) to retrieve reference FMs, and filters were mounted on large microscope slides. All slides were imaged on a fluorescent slide reader (Alpha Innotech, San Leandro, California) using multiple excitation-emission wavelength pairs to isolate each FM color. FMs of each color were counted in tissue sections and filters using an automated particle counting program to determine CBF in the upper cerebrum to a tissue depth of , corresponding to the top of the lateral ventricles, at different time points before and after injury. CBF relative to preinjury (rCBF) was calculated from , where is the number of tissue microspheres, is the number of reference blood microspheres, is the number of tissue microspheres at preinjury baseline, and is the number of reference blood microspheres at preinjury baseline. The FM measurements were then compared to rCBF as determined optically using DCS at corresponding time points. 2.6.Data Analysisdeviation of cerebral hemodynamic parameters (Hb, , THC, , and rCBF) from large source-detector separations (1, 1.5, and ) were reported for each individual animal. The total thickness of the scalp and skull layers of the piglet brain was , and therefore, they should have a relatively small (compared to humans) influence on the accuracy of cerebral hemodynamic changes, especially relative changes, measured at large source-detector separations.23, 25, 32 Linear regression was used to demonstrate correlation and agreement between the FM and DCS measurements of rCBF. CBF measured with FMs in the upper cerebrum were normalized to the preinjury value from the same animal to obtain at various time points postinjury. rCBF measured using DCS was averaged over at the corresponding FM time points. Measurements from the left and right hemispheres were averaged to improve the signal-to-noise ratio. The results from each experimental group were reported as error. A one-way repeated measures analysis of variance (ANOVA) was employed to statistically interpret the group results. When significant differences were found, a Student t-test was used to determine the time point when significant changes occurred. Significance was adjusted for multiple comparisons using Bonferroni correction and . 3.Results3.1.Repeatability of Probe PlacementFrom the six animals with double-baseline measurements, good agreement was observed between the first and second baseline measurements ( , ; , ; and , ), indicating that removal and replacement of the probe had a relatively small influence on the measured optical cerebral hemodynamic values. 3.2.Comparison of toFigure 2 compares rCBF obtained by DCS to rCBF by FMs in eight animals from the three groups. Regression analysis revealed a linear relationship between and , with a correlation coefficient of . The slope of the regression was calculated to be 1.03 (95% confidence interval, CI: 0.74–1.32), which is not significantly different from identity . The intercept was 25.2%, with a 95% CI ranging from 12.4 to 38.0%. 3.3.Average Injury EffectsAlthough each animal received individual care and had a distinct temporal hemodynamic response to the TBI, similar trends can be observed across animals within each of the groups. Changes in physiological parameters are summarized in Table 2 . Compared to preinjury values, only MAP in group 1 was found significantly lower at and and the postinjury pH value in the venous blood gas (group 1) was significantly higher . Table 2Summary of physiological parameters in animal groups 1 and 2 ( mean±standard error). VBG: venous blood gas; ABG: arterial blood gas. The asterisk in each row indicates significant difference from the corresponding pre-injury value (p⩽0.01) .
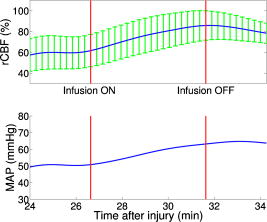
Figure 3 demonstrates the average injury effects on cerebral hemodynamics measured optically from the 10 injured piglets in group 1. The traumatic brain injury was found to have a significant impact on cerebral hemoglobin concentrations (ANOVA, for rHb, for , and for rTHC) and rCBF . Compared to preinjury levels, rHb, , and rTHC increased , , and , respectively, immediately after injury and continued increasing over the next [see Fig. 3a, 3b, 3c]. These changes are likely related to the accumulation of subdural and subarachnoid blood due to the rotational injury. dropped significantly immediately postinjury ( , ), maintained this reduction at postinjury ( , ), but gradually normalized to preinjury levels [see Fig. 3d]. rCBF decreased significantly to of preinjury level immediately after injury and continued at that level over the [Fig. 3e]. By comparison, no significant changes in rHb (ANOVA, ), , rTHC , , or rCBF were observed over the in the control group . Fig. 3Average injury effects on Hb, , THC, , and rCBF for animals in group 1 ( , error bars represent standard error). Traumatic brain injury produced significant increases in cerebral hemoglobin concentrations and decreases in oxygen saturation. Compared to preinjury levels, rHb, , and rTHC increased significantly within the first after injury and continued to increase over the next . dropped significantly by postinjury, but gradually returned to preinjury levels. rCBF decreased significantly within the first after injury and continued at that level over the . The asterisk in each plot indicates a significant difference from the corresponding pre-injury value .  3.4.Robust Long-Term MonitoringAll 14 injured piglets survived ( for group 1 and for group 3). Figure 4 shows the results of the monitoring period from a representative animal. Cerebral hemodynamic parameters measured with DRS and DCS, specifically THC, , and rCBF, are shown in the top three panels. Vital physiological parameters, including MAP, , and HR, are displayed in the bottom three panels. In this animal, THC increased to immediately after the injury, continued to gradually increase to during the first , and then stayed at that level until postinjury. Blood oxygen saturation in the brain tissue and systemically were relatively stable throughout the monitoring period. However, immediately after the injury, rCBF, MAP, and HR were elevated ( , , ), and then they decreased dramatically within the first . Fig. 4Robust long-term monitoring from a representative animal. Cerebral hemodynamics (THC, , and rCBF) measured with DRS and DCS are plotted in the top three panels, while vital physiological parameters (MAP, , and HR) are displayed in the bottom three panels. Good correlation between changes in MAP and changes in rCBF were observed. Solid vertical bars mark various physiological events: , begin phenylephrine dose titration; , begin continuous phenylephrine infusion at ; and , , and , administer boluses of hypertonic (3%) saline. Error bars in the top three panels represent standard deviation of cerebral hemodynamic parameters from large source-detector separations (1, 1.5, and ). 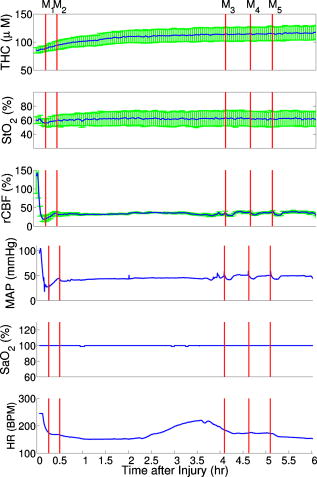 At postinjury, phenylephrine infusion was begun via the femoral vein. Between marks M1 and M2, the phenylephrine dose was titrated until MAP was within of preinjury MAP. The resultant increases in MAP and rCBF can be observed in Fig. 4. The animal was maintained on the final phenylephrine dose until the end of the study. Between 4 and , three boli of hypertonic (3%) saline were injected into the animal (M3, M4, and M5). Good correlation between changes in MAP and rCBF were observed. Changes in HR were not found to correlate with rCBF changes over the . Similar and consistent profiles were observed from other animals in groups 1 and 3. Cerebral hemodynamics measured with diffuse optics were found to be robust and consistent with vital physiological recordings over the entire monitoring period. 3.5.Sensitivity to Transient Physiological EventsIn addition to providing robust long-term monitoring capability, the diffuse optical techniques were sufficiently sensitive to capture the dynamics of transient physiological events, such as apnea, cardiac arrest, and hypertonic saline infusion. Examples in this section illustrate the temporal profiles of the measured cerebral hemodynamic changes during these events. 3.5.1.ApneaSix episodes of spontaneous apnea from five animals in group 1, two episodes from one animal in group 2, and two episodes from two animals in group 3 were observed and recorded. Figure 5 shows an example of an apnea event whose dynamics were captured optically. In this case, apnea caused a significant drop in systemic blood oxygen saturation (67%). MAP rose by , increasing blood flow to the brain by 36% relative to the preinjury value. decreased, but only by , most likely because the increased rCBF provided a sufficient increase in delivery. Upon mechanical ventilation of the animal (the vertical marks in Fig. 5), all physiological parameters were successfully returned to their preapnea states. Because the duration of and response to apnea are different from animal to animal, the magnitudes of the changes in cerebral hemodynamics varied. However, the same trends (decreased , increased MAP, and rCBF) were observed consistently in all apnea events and were abolished by mechanical ventilation. Fig. 5Cerebral hemodynamic changes during an episode of apnea in a representative animal. Apnea caused a significant drop in . As a result, MAP increased significantly and raised rCBF to produce only a slight decrease in . Following initiation of mechanical ventilation (solid vertical line), all physiological parameters returned to their preapnea states. Error bars in and rCBF represent standard deviation from large source-detector separations (1, 1.5, and ). 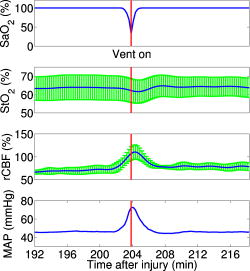 3.5.2.Apnea followed by cardiac arrestTwo apnea events were followed by cardiac arrest in one piglet in group 3, and cerebral hemodynamic changes during these episodes were recorded optically. As shown in Fig. 6a, hemodynamics during the first period of apnea followed the same trends described above ( decreased from 57 to 48%, MAP increased from , and rCBF increased from 28 to 46% of preinjury levels). Cardiac arrest occurred about after the onset of apnea (the vertical marks in Fig. 6), producing a significant decrease in MAP to . As a result, rCBF decreased dramatically to 13% and decreased further down to 37%, indicating a significant decrease in oxygen delivery to the brain. About later, mechanical ventilation successfully resuscitated the animal from cardiac arrest. Initial increases in MAP were seen, which then gradually normalized to preapnea levels as rCBF and returned to preapnea values. Diffuse optical techniques captured similar dynamic changes following a second apnea event in the same animal two hours later [Fig. 6b]. Fig. 6Cerebral hemodynamic changes in a single animal during two episodes of apnea followed by cardiac arrest. (A) The onset of apnea produced the same , rCBF, and MAP trends observed in Fig. 5. Cardiac arrest (solid vertical line) caused a significant decrease in MAP and rCBF, resulting in a further significant decrease in . After ventilatory resuscitation, , rCBF, and MAP gradually returned to preapnea levels. (B) The same “biphasic” dynamic change was observed during apnea in the same animal later. Error bars in and rCBF represent standard deviation from large source-detector separations (1, 1.5, and ). 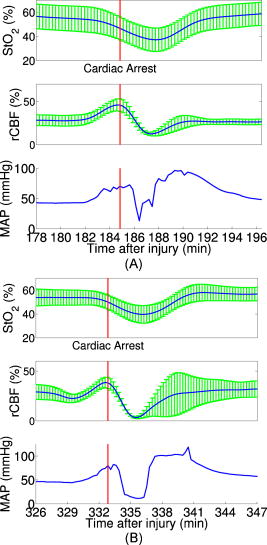 3.5.3.Hypertonic saline infusionHypertonic (3%) saline is widely employed in the clinical setting to increase cerebral blood flow by decreasing intracranial pressure and increasing systemic blood pressure.42 The effect is thought to work by extracting water from the tissue compartments, particularly swollen brain tissue, into the circulatory system.42 Four piglets in group 3 were infused with hypertonic saline over a period starting postinjury. Temporal changes in rCBF and MAP from one representive example is displayed in Fig. 7 . The infusion effectively elevated rCBF by 24% of preinjury levels and MAP by . These rCBF and MAP changes were well correlated with each other. Similar trends were observed in the other animals receiving hypertonic saline. 4.DiscussionIn the current study, rCBF measured with DCS was compared to rCBF with fluorescent microspheres. The comparison revealed excellent linear correlation ( , ), a close-to-identity slope of 1.03 , and a 25.2% offset of DCS over FM measurements. However, due to the limited sample size (17 data points from eight animals), errors in the estimated slope and intercept are relatively large (95% CI for slope: 0.74–1.32; 95% CI for intercept: 12.4–38.0%). The apparent offset between the two techniques may be accounted for by several factors. First, a biological zero signal, which has been extensively discussed in the laser Doppler literature,43 originates from the Brownian motion of the organelles inside the tissue and may contribute to a positive rCBF offset measured by DCS. From our postmortem DCS measurements in 18 animals (data not shown), we found that this effect contributes to the offset of . In addition, the spatial heterogeneity of CBF and the incomplete match of the area of detection for the two techniques will certainly contribute to systematic differences between the two techniques, though this effect is difficult to estimate in the current setup; in a similar vein, the semi-infinite model employed for DCS data analysis can be improved. More importantly, the FM method is sensitive to small random fluctuations in the animal’s physiological state, because the flow measurements are critically dependent on the precise timing of microsphere injection, reference blood withdrawal, etc. By comparison, the DCS method smoothes over these fluctuations by averaging continuous measurements over the corresponding time period. This difference may play a role in the apparent discrepancies between the two techniques, especially when the sample size is small, where random errors may be viewed as systematic errors. It was somewhat surprising to us, for example, that FM measurements in three control animals recorded an 20% reduction in rCBF; these animals alone contribute substantially to the offset. In future studies, more animals will be employed to improve the quantification accuracy and procedures to account for tissue heterogeneity will be implemented at the outset. Our most important finding, that DCS measurements respond linearly to rCBF changes, is consistent with previous observations comparing DCS to other relative blood flow measurement modalities, such as laser Doppler,7, 36 color-weighted power Doppler ultrasound,33 Xenon CT,37 and ASL-MRI. 38, 39 The highly significant correlation between DCS and FMs thus provides further support for the use of DCS as a noninvasive tool for measuring relative changes in CBF. The cerebral hemodynamic changes we observed following traumatic brain injury (see Fig. 3) are also consistent with observations by other researchers.44, 45 The persistent 50% reduction in CBF is consistent with the findings from other TBI animal models,44, 46 as well as human TBI patients.47 Bouma reported CBF values of in adult patients with severe TBI within the first few hours of hospital admission, while normal CBF in adult humans is .48 A 40–50% CBF reduction persisting for at least has been reported in rats following fluid percussion injury (FPI).46 FPI in neonatal piglets has been shown by Ref. 44 to cause an immediate and sustained decrease in cerebral blood flow and a prolonged decrease in mean arterial pressure up to following injury, but relatively mild axonal injury and subarachnoid bleeding.44 In the current study, MAP decreased significantly only after and was not sufficient to explain the observed immediate and persistant blood flow reductions, which therefore could be attributed to damaged or dysfunctional regulation of the cerebral vessels. All of our injured animals had subdural and subarachnoid hematoma on necropsy. This finding was consistent with the continuous increase in hemoglobin concentrations we observed in these animals over the course of the postinjury period. We should note that the influence of extra-axial blood on the accuracy of the DCS measurements was minimized, by continuously monitoring and incorporating any time-dependent changes in the absorption coefficient of the piglet brain into the DCS data analysis. While our acquisition rate of was sufficient to capture cerebral hemodynamic changes during physiological perturbations, such as apnea, cardiac arrest, and hypertonic saline infusion, this rate could potentially be improved for even greater dynamic accuracy without sacrificing the signal-to-noise ratio by monitoring a smaller number of source-detector pairs or employing more parallel detection. A faster detection system would lend itself to the development of algorithms for online detection of physiological events that could provide cerebral blood flow or cerebral oxygenation-specific triggering alarms in the intensive care unit. For example, in the case of apnea or cardiac arrest, as illustrated in Figs. 5 and 6, alarms could be triggered based on integrating the , , rCBF, and MAP information into a cerebral metabolic insufficiency alarm that would indicate the need for immediate intervention. Other potential future innovations include implementation of tomographic blood flow image reconstruction, an approach that has been demonstrated in rats by measuring DCS signals at multiple source-detector pairs7, 9 and combined uses of blood flow and oxygenation to generate regional maps of the cerebral metabolic rate of oxygen,49, 50, 51 another important indicator of the well-being of the brain. With improvement of the DCS signal-to-noise ratio,9, 52 these applications will be extended to larger animals and to humans, where probes with larger source-detector separation are required to permit detection through thicker scalp and skull. Finally, in this study, we demonstrated that diffuse optical techniques (DRS and DCS) have the robustness and sensitivity needed for patient monitoring at the bedside. During the monitoring period in the current study, physiological events were clearly marked and coregistered with vital physiological parameters and optical recordings. Cerebral hemodynamics measured optically were found to be consistent and complementary to vital recordings, physiological events, and pathological findings. Although quantification of absolute cerebral hemodynamic parameters is desirable, the relative measurements presented in this study are valuable for many clinical applications. For example, we have made progress recently in pilot studies using these techniques for bedside monitoring and cerebral autoregulation assessment in intensive care unit for infants and adult humans.37, 39, 53, 54 In one of the studies,54 relative hemodynamic changes in respond to head-of-bed perturbation were found to differ significantly between healthy subjects and stroke patients. 5.ConclusionIn summary, using a newborn piglet traumatic brain injury model we have demonstrated that diffuse optical techniques (DRS and DCS) are capable of probing cerebral hemodynamics noninvasively through intact scalp and skull. We validated rCBF measured using the DCS technique against the FM method, wherein a strong linear correnpondance was observed. TBI was found to significantly reduce cerebral blood flow and raise intracranial hemoglobin concentrations. The diffuse optical techniques are robust for long-term monitoring at bedside and sensitive to spontaneous physiological events, such as apnea and cardiac arrest, as well as physiological perturbations, such as hypertonic saline infusion. These techniques hold great potential for application in pediatric and adult human patients in the neurointensive care unit. AcknowledgmentThis work was supported by the NIH grants No. RO1-HL-077699 (A.G.Y.), No. RO1-NS-39679 (S.S.M.), and No. ED-26979 (T.D.) and Thrasher research Fund New Researcher Award NR-0016 (T.D.). The authors thank Regine Choe, Erin Buckley, and Janos Luckl for their assistance in this study, and Joel H. Greenberg for useful discussions. ReferencesM. D. Fisher,
“Pediatric traumatic brain injury,”
Crit. Care Nurs. Q., 20 36
–51
(1997). 0887-9303 Google Scholar
R. Raghupathi and S. S. Margulies,
“Traumatic axonal injury after closed head injury in the neonatal pig,”
J. Neurotrauma, 19
(7), 843
–853
(2002). https://doi.org/10.1089/08977150260190438 0897-7151 Google Scholar
J. W. T. Dickerson and J. Dobbing,
“Prenatal and postnatal growth and development of the central nervous system of the pig,”
Proc. R. Soc. London, 166 384
–395
(1967). https://doi.org/10.1098/rspb.1967.0002 0962-8444 Google Scholar
S. Friess, R. Ichord, K. Owens, J. Ralston, R. Rizol, K. Overall, C. Smith, M. Helfaer, and S. Margulies,
“Neurobehavioral functional deficits following closed head injury in the neonatal pig,”
Exp. Neurol., 204
(1), 234
–243
(2007). https://doi.org/10.1016/j.expneurol.2006.10.010 0014-4886 Google Scholar
A. Villringer and B. Chance,
“Non-invasive optical spectroscopy and imaging of human brain function,”
Trends Neurosci., 20 435
–442
(1997). https://doi.org/10.1016/S0166-2236(97)01132-6 0166-2236 Google Scholar
A. P. Gibson, J. C. Hebden, and S. R. Arridge,
“Recent advances in diffuse optical imaging,”
Phys. Med. Biol., 50
(4), R1
–R43
(2005). https://doi.org/10.1088/0031-9155/50/4/R01 0031-9155 Google Scholar
J. P. Culver, T. Durduran, T. Furuya, C. Cheung, J. H. Greenberg, and A. G. Yodh,
“Diffuse optical tomography of cerebral blood flow, oxygenation, and metabolism in rat during focal ischemia,”
J. Cereb. Blood Flow Metab., 23 911
–924
(2003). https://doi.org/10.1097/01.WCB.0000076703.71231.BB 0271-678X Google Scholar
T. Durduran, G. Q. Yu, M. G. Burnett, J. A. Detre, J. H. Greenberg, J. Wang, C. Zhou, and A. G. Yodh,
“Diffuse optical measurement of blood flow, blood oxygenation, and metabolism in a human brain during sensorimotor cortex activation,”
Opt. Lett., 29 1766
–1768
(2004). https://doi.org/10.1364/OL.29.001766 0146-9592 Google Scholar
C. Zhou, G. Q. Yu, D. Furuya, J. H. Greenberg, A. G. Yodh, and T. Durduran,
“Diffuse optical correlation tomography of cerebral blood flow during cortical spreading depression in rat brain,”
Opt. Express, 14 1125
–1144
(2006). https://doi.org/10.1364/OE.14.001125 1094-4087 Google Scholar
J. Li, G. Dietsche, D. Iftime, S. E. Skipetrov, G. Maret, T. Elbert, B. Rockstroh, and T. Gisler,
“Noninvasive detection of functional brain activity with near-infrared diffusing-wave spectroscopy,”
J. Biomed. Opt., 10
(4), 044002
(2005). https://doi.org/10.1117/1.2007987 1083-3668 Google Scholar
F. Jaillon, J. Li, G. Dietsche, T. Elbert, and T. Gisler,
“Activity of the human visual cortex measured non-invasively by diffusing-wave spectroscopy,”
Opt. Express, 15 6643
–6650
(2007). https://doi.org/10.1364/OE.15.006643 1094-4087 Google Scholar
D. W. Brown, J. Hadway, and T. Y. Lee,
“Near-infrared spectroscopy measurement of oxygen extraction fraction and cerebral metabolic rate of oxygen in newborn piglets,”
Pediatr. Res., 54
(6), 861
–867
(2003). https://doi.org/10.1203/01.PDR.0000090928.93045.BE 0031-3998 Google Scholar
A. M. Rudolph and M. A. Heymann,
“The circulation of the fetus in utero. methods for studying distribution of blood flow, cardiac output and organ blood flow,”
Circ. Res., 21
(2), 163
–184
(1967). 0009-7330 Google Scholar
G. De Visscher, M. Haseldonckx, W. Flameng, M. Borgers, R. S. Reneman, and K. van Rossem,
“Development of a novel fluorescent microsphere technique to combine serial cerebral blood flow measurements with histology in the rat,”
J. Neurosci. Methods, 122
(2), 149
–156
(2003). https://doi.org/10.1016/S0165-0270(02)00316-3 0165-0270 Google Scholar
K. M. Powers, C. Schimmel, R. W. Glenny, and C. M. Bernards,
“Cerebral blood flow determinations using fluorescent microspheres: variations on the sedimentation method validated,”
J. Neurosci. Methods, 87
(2), 159
–165
(1999). https://doi.org/10.1016/S0165-0270(98)00180-0 0165-0270 Google Scholar
A. Polito, Z. Ricci, L. Di Chiara, C. Giorni, C. Iacoella, S. P. Sanders, and S. Picardo,
“Cerebral blood flow during cardiopulmonary bypass in pediatric cardiac surgery: the role of transcranial Doppler—a systematic review of the literature,”
Cardiovasc. Ultrasound, 4 47
–47
(2006). https://doi.org/10.1186/1476-7120-4-47 Google Scholar
R. Bonner and R. Nossal,
“Model for laser Doppler measurements of blood flow in tissue,”
Appl. Opt., 20 2097
–2107
(1981). https://doi.org/10.1364/AO.20.002097 0003-6935 Google Scholar
F. F. Jöbsis,
“Noninvasive, infrared monitoring of cerebral and myocardial oxygen sufficiency and circulatory parameters,”
Science, 198
(4323), 1264
–1267
(1977). https://doi.org/10.1126/science.929199 0036-8075 Google Scholar
M. Cope and D. T. Delpy,
“System for long-term measurement of cerebral blood and tissue oxygenation on newborn infants by near infra-red transillumination,”
Med. Biol. Eng. Comput., 26
(3), 289
–294
(1988). https://doi.org/10.1007/BF02447083 0140-0118 Google Scholar
A. D. Edwards, J. S. Wyatt, C. Richardson, D. T. Delpy, M. Cope, and E. O. Reynolds,
“Cotside measurement of cerebral blood flow in ill newborn infants by near infrared spectroscopy,”
Lancet, 2
(8614), 770
–771
(1988). https://doi.org/10.1016/S0140-6736(88)92418-X 0140-6736 Google Scholar
K. Isobe, T. Kusaka, Y. Fujikawa, M. Kondo, K. Kawada, S. Yasuda, S. Itoh, K. Hirao, and S. Onishi,
“Changes in cerebral hemoglobin concentration and oxygen saturation immediately after birth in the human neonate using full-spectrum near infrared spectroscopy,”
J. Biomed. Opt., 5
(3), 283
–286
(2000). https://doi.org/10.1117/1.429997 1083-3668 Google Scholar
F. Nomura, H. Naruse, A. duPlessis, T. Hiramatsu, J. Forbess, D. Holtzman, J. J. Volpe, R. Jonas, and M. Tsuji,
“Cerebral oxygenation measured by near infrared spectroscopy during cardiopulmonary bypass and deep hypothermic circulatory arrest in piglets,”
Pediatr. Res., 40
(6), 790
–796
(1996). https://doi.org/10.1203/00006450-199612000-00003 0031-3998 Google Scholar
S. Fantini, D. Hueber, M. A. Franceschini, E. Gratton, W. Rosenfeld, P. G. Stubblefield, D. Maulik, and M. R. Stankovic,
“Non-invasive optical monitoring of the newborn piglet brain using continuous-wave and frequency-domain spectroscopy,”
Phys. Med. Biol., 44
(6), 1543
–1563
(1999). https://doi.org/10.1088/0031-9155/44/6/308 0031-9155 Google Scholar
G. Zhang, A. Katz, R. R. Alfano, A. D. Kofinas, D. A. Kofinas, P. G. Stubblefield, W. Rosen-feld, D. Beyer, D. Maulik, and M. R. Stankovic,
“Brain perfusion monitoring with frequency-domain and continuous-wave near-infrared spectroscopy: a cross-correlation study in newborn piglets,”
Phys. Med. Biol., 45
(11), 3143
–3158
(2000). https://doi.org/10.1088/0031-9155/45/11/303 0031-9155 Google Scholar
D. M. Hueber, M. A. Franceschini, H. Y. Ma, Q. Zhang, J. R. Ballesteros, S. Fantini, D. Wallace, V. Ntziachristos, and B. Chance,
“Non-invasive and quantitative near-infrared hemoglobin spectrometry in the piglet brain during hypoxic stress, using a frequency-domain multidistance instrument,”
Phys. Med. Biol., 46
(1), 41
–62
(2001). https://doi.org/10.1088/0031-9155/46/1/304 0031-9155 Google Scholar
D. A. Boas and A. G. Yodh,
“Spatially varying dynamical properties of turbid media probed with diffusing temporal light correlation,”
J. Opt. Soc. Am. A, 14
(1), 192
–215
(1997). https://doi.org/10.1364/JOSAA.14.000192 0740-3232 Google Scholar
D. A. Boas, L. E. Campbell, and A. G. Yodh,
“Scattering and imaging with diffusing temporal field correlations,”
Phys. Rev. Lett., 75
(9), 1855
–1858
(1995). https://doi.org/10.1103/PhysRevLett.75.1855 0031-9007 Google Scholar
G. Maret and P. Wolf,
“Multiple light scattering from disordered media. The effect of Brownian motion of scatterers,”
Z. Phys. B: Condens. Matter, 65 409
–413
(1987). https://doi.org/10.1007/BF01303762 0722-3277 Google Scholar
D. Pine, D. Weitz, P. Chaikin, and E. Herbolzheimer,
“Diffusing-wave spectroscopy,”
Phys. Rev. Lett., 60 1134
–1137
(1988). https://doi.org/10.1103/PhysRevLett.60.1134 0031-9007 Google Scholar
J. F. Nunn, Applied Respiratory Physiology, Butterworth-Heinemann, London (1993). Google Scholar
D. T. Delpy, M. Cope, P. van der Zee, S. Arridge, S. Wray, and J. Wyatt,
“Estimation of optical pathlength through tissue from direct time of flight measurement,”
Phys. Med. Biol., 33 1433
–1442
(1988). https://doi.org/10.1088/0031-9155/33/12/008 0031-9155 Google Scholar
S. Ijichi, T. Kusaka, K. Isobe, F. Islam, K. Okubo, H. Okada, M. Namba, K. Kawada, T. Imai, and S. Itoh,
“Quantification of cerebral hemoglobin as a function of oxygenation using near-infrared time-resolved spectroscopy in a piglet model of hypoxia,”
J. Biomed. Opt., 10
(2), 024026
(2005). https://doi.org/10.1117/1.1899184 1083-3668 Google Scholar
G. Q. Yu, T. Durduran, C. Zhou, H. W. Wang, M. E. Putt, H. M. Saunders, C. M. Sehgal, E. Glatstein, A. G. Yodh, and T. M. Busch,
“Noninvasive monitoring of murine tumor blood flow during and after photodynamic therapy provides early assessment of therapeutic efficacy,”
Clin. Cancer Res., 11
(9), 3543
–3552
(2005). https://doi.org/10.1158/1078-0432.CCR-04-2582 1078-0432 Google Scholar
T. Durduran, R. Choe, G. Yu, C. Zhou, J. C. Tchou, B. J. Czerniecki, and A. G. Yodh,
“Diffuse optical measurement of blood flow in breast tumors,”
Opt. Lett., 30 2915
–2917
(2005). https://doi.org/10.1364/OL.30.002915 0146-9592 Google Scholar
C. Zhou, R. Choe, N. Shah, T. Durduran, G. Yu, A. Durkin, D. Hsiang, R. Mehta, J. Butler, A. Cerussi, B. J. Tromberg, and A. G. Yodh,
“Diffuse optical monitoring of blood flow and oxygenation in human breast cancer during early stages of neoadjuvant chemotherapy,”
J. Biomed. Opt., 12
(5), 051903
(2007). https://doi.org/10.1117/1.2798595 1083-3668 Google Scholar
C. Cheung, J. P. Culver, K. Takahashi, J. H. Greenberg, and A. G. Yodh,
“In vivo cerebrovascular measurement combining diffuse near-infrared absorption and correlation spectroscopies,”
Phys. Med. Biol., 46
(8), 2053
–2065
(2001). https://doi.org/10.1088/0031-9155/46/8/302 0031-9155 Google Scholar
T. Durduran, M. N. Kim, E. M. Buckley, B. L. Edlow, H. Moss, C. Zhou, G. Yu, R. Choe, S. K. Frangos, E. Wilensky-Mahoney, A. Kofke, J. M. Levine, R. L. Wolf, J. Woo, S. E. Kasner, B. L. Cucchiara, M. E. Putt, A. G. Yodh, J. H. Greenberg, and J. A. Detre,
“Bedside monitoring of cerebral hemodynamics for stroke and neurocritical care using novel diffuse optical probes,”
Annual Mtg of American Neurological Association, 298
(2008) Google Scholar
G. Q. Yu, T. Floyd, T. Durduran, C. Zhou, J. J. Wang, J. A. Detre, and A. G. Yodh,
“Validation of diffuse correlation spectroscopy for muscle blood flow with concurrent arterial spin labeled perfusion MRI,”
Opt. Express, 15
(3), 1064
–1075
(2007). https://doi.org/10.1364/OE.15.001064 1094-4087 Google Scholar
T. Durduran, C. Zhou, M. N. Kim, E. M. Buckley, G. Yu, R. Choe, S. M. Durning, S. Mason, L. M. Montenegro, S. C. Nicholson, R. A. Zimmerman, J. J. Wang, J. A. Detre, A. G. Yodh, and D. J. Licht,
“Validation of diffuse correlation spectroscopy for non-invasive, continuous monitoring of CBF in neonates with congenital heart defects,”
Annual Mtg of American Neurological Association, 299
(2008) Google Scholar
T. Durduran,
“Noninvasive measurements of tissue hemodynamics with hybrid diffuse optical methods,”
University of Pennsylvania,
(2004). Google Scholar
G. Q. Yu, T. Durduran, G. Lech, C. Zhou, B. Chance, R. E. Mohler, and A. G. Yodh,
“Time-dependent blood flow and oxygenation in human skeletal muscles measured with noninvasive near-infrared diffuse optical spectroscopies,”
J. Biomed. Opt., 10 024027
(2005). https://doi.org/10.1117/1.1884603 1083-3668 Google Scholar
J. A. Doyle, D. P. Davis, and D. B. Hoyt,
“The use of hypertonic saline in the treatment of traumatic brain injury,”
Sitzungsber. K. Preuss. Akad. Wiss., 50
(2), 367
–383
(2001). 0371-196X Google Scholar
D. P. Kernick, J. E. Tooke, and A. C. Shore,
“The biological zero signal in laser Doppler fluximetry—origins and practical implications,”
Pfluegers Arch., 437
(4), 624
–631
(1999). https://doi.org/10.1007/s004240050826 0031-6768 Google Scholar
W. M. Armstead and C. D. Kurth,
“Different cerebral homodynamic responses following fluid percussion brain injury in the newborn and juvenile pig,”
J. Neurotrauma, 11
(5), 487
–497
(1994). 0897-7151 Google Scholar
S. R. Durham, R. Raghupathi, M. A. Helfaer, S. Marwaha, and A. C. Duhaime,
“Age-related differences in acute physiologic response to focal traumatic brain injury in piglets,”
Pediatr. Neurosurg., 33
(2), 76
–82
(2000). https://doi.org/10.1159/000028980 1016-2291 Google Scholar
X. Q. Yuan, D. S. Prough, T. L. Smith, and D. S. Dewitt,
“The effects of traumatic brain injury on regional cerebral blood flow in rats,”
J. Neurotrauma, 5
(4), 289
–301
(1988). https://doi.org/10.1089/neu.1988.5.289 0897-7151 Google Scholar
G. J. Bouma, J. P. Muizelaar, S. C. Choi, P. G. Newlon, and H. F. Young,
“Cerebral circulation and metabolism after severe traumatic brain injury: the elusive role of ischemia,”
J. Neurosurg., 75
(5), 685
–693
(1991). https://doi.org/10.3171/jns.1991.75.5.0685 0022-3085 Google Scholar
J. Overgaard and W. A. Tweed,
“Cerebral circulation after head injury. 1. cerebral blood flow and its regulation after closed head injury with emphasis on clinical correlations,”
J. Neurosurg., 41
(5), 531
–541
(1974). https://doi.org/10.3171/jns.1974.41.5.0531 0022-3085 Google Scholar
F. Hyder, R. G. Shulman, and D. L. Rothman,
“A model for the regulation of cerebral oxygen delivery,”
J. Appl. Physiol., 85
(2), 554
–564
(1998). 8750-7587 Google Scholar
R. D. Hoge, J. Atkinson, B. Gill, G. R. Crelier, S. Marrett, and G. B. Pike,
“Investigation of BOLD signal dependence on cerebral blood flow and oxygen consumption: the deoxyhemoglobin dilution model,”
Magn. Reson. Med., 42
(5), 849
–863
(1999). https://doi.org/10.1002/(SICI)1522-2594(199911)42:5<849::AID-MRM4>3.0.CO;2-Z 0740-3194 Google Scholar
J. B. Mandeville, J. J. Marota, C. Ayata, M. A. Moskowitz, R. M. Weisskoff, and B. R. Rosen,
“MRI measurement of the temporal evolution of relative CMRO(2) during rat forepaw stimulation,”
Magn. Reson. Med., 42
(5), 944
–951
(1999). https://doi.org/10.1002/(SICI)1522-2594(199911)42:5<944::AID-MRM15>3.0.CO;2-W 0740-3194 Google Scholar
G. Dietsche, M. Ninck, C. Ortolf, J. Li, F. Jaillon, and T. Gisler,
“Fiber-based multispeckle detection for time-resolved diffusing-wave spectroscopy: characterization and application to blood flow detection in deep tissue,”
Appl. Opt., 46
(35), 8506
–8514
(2007). https://doi.org/10.1364/AO.46.008506 0003-6935 Google Scholar
T. Durduran, C. Zhou, G. Yu, B. Edlow, R. Choe, Q. Shah, S. E. Kasner, B. L. Cucchiara, A. G. Yodh, J. H. Greenberg, and J. A. Detre,
“Bed-side monitoring of cerebral blood flow (CBF) in acute stroke patients during changes in head of bed position,”
(2007). Google Scholar
T. Durduran, C. Zhou, B. L. Edlow, G. Q. Yu, R. Choe, M. N. Kim, B. L. Cucchiara, M. Putt, Q. Shah, S. E. Kasner, J. H. Greenberg, A. G. Yodh, and J. A. Detre,
“Transcranial optical monitoring of cerebrovascular hemodynamics in acute stroke patients,”
Opt. Express, 17 3884
–3902
(2009). https://doi.org/10.1364/OE.17.003884 1094-4087 Google Scholar
|
||||||||||||||||||||||||||||||||||||||||||||||||||||||||||||||||||||||||||||||||||||||||||||||||||||||||||||||||||||||||||||||||||||||||||||||||||||||||||||||||||||||||||||||||||||||||||||||||||||||||||||||||||||||||||||||||||||||||||||||||||||||||||||||||||||||||||||||||||||||||||