|
|
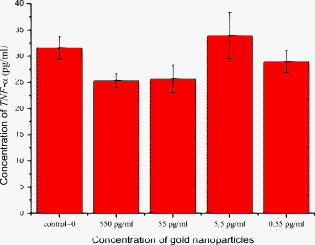
1.IntroductionThe morphology of living cells plays an important role in biological studies. The widely used phase contrast or differential interference contrast microscope only maps two-dimensional (2-D) contours of the cells. The confocal microscope can take three-dimensional (3-D) cell images, but it needs to label the cells with fluorescent dyes.1 To obtain morphologic information without fluorescent labeling, several types of transmission interference microscopes have been reported.2, 3, 4 In principle, the interference microscope records the optical phase changes in the cells. The phase signal is an integral result of refractive index multiplied by the height. Therefore, to obtain morphology of cells, the refractive index distribution in cells needs to be measured simultaneously. It increases the difficulty for the morphological measurement. For example, Rappaz had to change the culture medium in order to provide a new phase parameter to calculate the refractive index and cell’s height simultaneously.5 W. Choi developed an optical tomography by using a scanning-angle interference microscope and a back-projection method.6 This complicated system is difficult for real-time studies of cell morphologies. In this paper, we present a way to directly and quickly measure cell morphology by using gold nanoparticles (AuNPs) and a dark-field optical section microscope. The AuNPs act as labels of the cell membrane. Compared to fluorescent molecules, they have no photobleaching problem and are biocompatible and nontoxic to cells.7 Surface modification is easy because gold has very good bioaffinity to thiol or amine groups. In addition, optical excitation on AuNPs produces localized surface plasmon resonance (LSR). The LSR effect results in a strong optical scattering in visible range. The typical scattering cross section of an AuNP is as high as .8 Compared to other optical-labeling entities under the same illumination conditions, the scattering flux of an AuNP can be a million larger that of the emission from and fluorescent molecules or quantum dots.9 This indicates that incident intensity for AuNPs is much lower than that required for the fluorescent molecules, providing less photodamage to the cells. Although gold does not emit fluorescence, the large plasmonic scattering can be used as a contrast agent for imaging AuNPs in living cells.10 Recent studies indicated that different sizes of AuNPs have different interactions with living cells. AuNPs of diam are uptaken by cells by way of the endocytotic process. For particle sizes of , AuNPs are on the cell membrane rather than in the cells.11 Therefore, if large AuNPs are modified with biomolecules that had specific binding to the cell membrane, most of them will be immobilized on the cell surface. The cell morphology then can be reconstructed directly from the 3-D distribution of AuNPs. This method takes advantages of simple optical setup, no changes on the properties of medium and cells. It can be used for long-term and real-time visualizations of the morphologic changes of living cells under the interaction of drugs or external environments. 2.Methods2.1.Setup of Dark-Field Optical Section MicroscopyFigure 1 illustrates the dark-field optical section method for imaging cells and AuNPs. The light source was a metal halide light that passed a long-pass filter ( bandwidth) to fit the maximum scattering spectrum of AuNPs and reduce the scattering background of cells. The light was coupled into a fiber bundle. The fibers in the bundle were circularly arranged at the output. These fibers illuminated the samples through a hemisphere glass lens. The incident angle of optical fiber was larger than the critical angle between the glass and air. For an efficient coupling of light into cells, matching oil was put between the glass slide and the hemisphere lens. Cells were cultured directly on a thick glass slide with a high chamber to hold the liquid medium. AuNPs of diam were injected into the medium through a micropipette and then covered with a cover slide. Because the illumination light had a large incident angle in the medium, only a very small portion of light was directly refracted to the objective lens. It resulted in a dark-field illumination with very low background. As compared to transparent organells of cells, the AuNPs have a much stronger scattering intensity due to the plasmonic effect. Therefore, AuNPs images are dominant in the dark-field microscope. We recorded the scattering images at different focal positions by using a high-speed CCD (pixel-fly, ). The optical sections were taken by a quickly linear scan of the objective lens along the depth direction. The objective was mounted on a closed-loop piezoelectric tube (PZT) stage (Nanocontrol, LTD, NC 1000 series). The PZT was controlled by a function generator (SRS, model DS345) which generated a zig-zag voltage ramp. To assure the synchrony of the CCD images and PZT positions, a trigger signal was simultaneously sent to the frame grabber to begin the recording of a sequence of images. 2.2.Cells and IncubationCells were the nonsmall lung cancer cells (CL1-0), hela cells, and normal lung cells (WI-38). Those cells were cultured on a cleaned glass slide (gold seal) with a thin square glass chamber to hold the medium. The cells were maintained in RPMI medium (GIBCO) supplemented with 10%FBS (fetal bovine serum) (GIBCO) at , in a humidified atmosphere. The cells were cultured over before use to ensure they spread well on the glass slides. 2.3.Gold Nanoparticles and ToxicityGold nanoparticles were purchased from BB International, Ltd. Excess amount of poly-L-lysine (Sigma-Aldrich, Inc.) was dissolved in gold nanoparticle colloidal solution and then incubated at room temp. We used a centrifuge ( , ) to separate the nanoparticles from unbound poly-L-lysine, and then remove the supernatant. The nanoparticles were redispersed with deionized water before use. To test the toxicity of AuNPs, we measured the tumor necrosis factor responses of lung cancer cells by adding different concentrations of gold nanoparticles. The is a cytokine involved in systemic inflammation. It is able to induce apoptotic cell death. Figure 2 shows the measured concentration as a function of the concentration of AuNPs. The measured results verified that gold nanoparticles do not induce any inflammation on cells. It is noted that not only small AuNPs, but also large-size gold nanoparticles are nontoxic to cells.12 3.Results and Discussion3.1.Interactions of Gold Nanoparticles and CellsCells we observed were the nonsmall lung cancer cells (CL1-0), normal lung cells, and hela cells. Those cells and AuNPs were incubated on the slide-based chambers for different interaction times. Figure 3a shows the dark-field images of lung cancer cells, observed by a 60x objective lens. The interaction times for AuNPs and cells were 1, 15, 30, and , respectively. The number of AuNPs was increased with the interaction time. Both CL1-0 cells and AuNPs were clearly seen by the dark-field microscope. However, the intensity of cells was about one-third of the scattering intensity of AuNPs. The large-intensity difference provides an effective way to distinguish AuNPs and cells in the images. It is found that AuNPs without any coating cannot attach to the lung cancer cells. Most of the nanoparticles were on the glass substrate. A possible reason for such nanoparticle distribution is the electrostatic force. AuNPs were prepared by using the reduction of tetrachloroauric acid (HAuCl4) solution.13 During the formation of AuNPs, the sodium citrate first acts as a reducing agent. Later, the negatively charged citrate ions are adsorbed onto the gold nanoparticles, introducing the negative surface charge that repels the nanoparticles and prevents them from aggregating. The cell surface also carried negative charges.14 Therefore, the electroforce expelled most AuNPs from the cell surfaces. This electrostatic concept indicates a way to immobilize AuNPs on the cell membrane by using positively charged AuNPs. In the experiments, we modified AuNPs surface by coating them with positively charged poly-L-lysine. The positive charges in poly-L-lysine neutralized negative charges of AuNPs and thus reduced repulsion with liposomal membrane. Figure 3b shows the dark-field images of lung cancer cells and the modified AuNPs at different interaction times. The interaction times for AuNPs and cells were 1, 30, and , respectively. Both CL1-0 cells and AuNPs were clearly seen. Compared to the cell images, many of the modified AuNPs were located on the cells. Little nanoparticles were found on the glass substrate. To assure that AuNPs were immobilized on the cell, the motion of AuNPs near a cell was recorded. Videos 1 shows the time lapse images of AuNPs interacted with a CL1-0 cell. The free AuNPs were in Brownian motion. Nevertheless, some AuNPs were immobilized when they interacted with the cell. Fig. 3(a) The images of nonsmall lung cancer cells and AuNPs taken by a dark-field optical microscope. The images were captured at 1, 15, 30, and after the injection of AuNPs. Note AuNPs were not found on the cells. The scale bar is . (b) The images of nonsmall lung cancer cells and poly (L-lysine)–coated AuNPs taken by a dark-field optical microscope. The images were acquired at 1, 30, and after the injection of AuNPs. Note most AuNPs were found on the cells. The scale bar is . 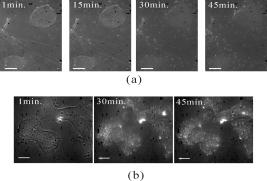 Video 1The time lapse images of AuNPs interacted with a CLI-0 cell. The AuNPs were coated with ploy-L-lysine. (QuickTime; ). . 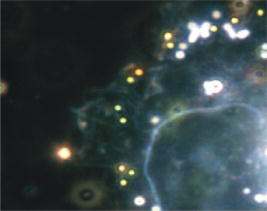 The concept of immobilizing AuNPs on the cell membrane by using positively charged poly-L-lysine can be applied to different cells. For example, we have tested the AuNP labeling on normal lung cells and other cancer cells. Figures 4a and 4b show the dark-field optical images. The results indicate that the poly-L-lysine coated AuNPs have good adhesion to different kinds of cells. The experiments were done many times. Each time we had observed at least 20 cells. All the cells were covered with surface-modified AuNPs. To further verify that those AuNPs are on the cell membrane and not in the cell, we used a high-resolution scanning electron microscope (SEM) to see the distribution of particles. We removed the unbounded gold nanoparticles by washing the cell sample with distilled water. The sample was then dried in the air and observed by the SEM. Figure 4c shows the distribution of particles on a dried CL1-0 cell. Most gold particles are single nanoparticles (i.e., diam). Few aggregations are found. The gold nanoparticles are clearly found on the membrane surface. If they are internalized by the cells, then the nanometer-sized particle should be indistinct due to the coverage of membrane and other cell organells. Fig. 4(a) The image of a normal cell and poly-L-lysine–coated AuNPs taken by a dark-field optical microscope. The image was taken at after the injection of AuNPs. (b) The image of a hela cell and poly-L-lysine–coated AuNPs. The image was taken at after the injection of AuNPs. (c) The SEM image of the distribution of gold particles on a dried CL1-0 cell. The gold nanoparticles are clearly found on the membrane surface. The inset shows the size of a single particle.  3.2.3-D Distribution of Gold NanoparticlesThe resolution of 3-D optical images relies on the numerical aperture of the objective lens. For a 100X lens, the field of view is . In the experiments, we used the nonsmall cancer cells (CL1-0). CL1-0 has a suitable size for high-magnification observation. In addition, it has a large cell height of . This height is suitable for the demonstration of 3-D cell image. The poly-L-lysine–coated AuNPs were immobilized on the cell membrane. Therefore, the 3-D distribution of the cell morphology can be reconstructed by calculating the 3-D distribution of AuNPs. Videos 2 shows the recorded images at different heights from top of cells to the glass substrate. In the dark-field section microscopy, the voltage from the PZT controller was . It made a movement of the focal position. The scan frequency was . The CCD acquired time was , yielding 100 images during a scan. It can be seen that the distribution of AuNPs in an optical section consisted of several rings. These rings grew from top to the bottom. If AuNPs are incorporated into cells through the endocytosis process, there will be many AuNPs inside the membrane. In the experiments, we only measured ring-type distributions of AuNPs. This confirmed that most AuNPs were on the membrane surface and not in the cell. Video 2The distribution of poly-L-lysine–coated AuNPs on cells. The movie was taken at different focal positions from top of cells to the glass substrate. The distribution of AuNPs in an optical section was consisted of rings. (QuickTime; ). . 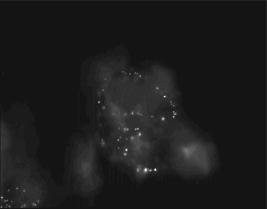 After the recording of a sequence of optical section images, the data were analyzed using the following algorithm: The recoded images, were first transformed into a 2-D image by finding the positions, where maximum intensity occurred. Because AuNPs have scattering intensities much larger than that of cells, we then set a threshold at one-third of the maximum intensity to exclude the cells and background from the images. The resultant 2-D image indicates only the positions of AuNPs. Figure 5a shows an example of the calculated 2-D distribution of poly (L-lysine) modified AuNPs at the plane. Many AuNPs were localized in the middle, where a cell was located. The accurate position of each AuNP was then calculated by fitting with a Gaussian profile. Figure 5b shows some fitting results. The Gaussian curve shows the depth response of an AuNP mapped by the dark-field optical microscopy. The full width at half maximum was . The resolution was as compared with positions at peak intensities. With the positions of AuNPs and the corresponding values, a 3-D distribution of the cell membrane was plotted. Videos 3 show a 3-D movie of a lung caner cell attached with AuNPs viewed at different angles. The 3-D AuNPs distribution indicated the morphology of a cell. The height of the CL1-0 was . This large height was due to the large nucleus of the cancer cell. Fig. 5(a) The positions of poly-L-lysine–coated AuNPs projected on the plane. The dense region indicated the position of cells. (b) Some fitting results. (c) The depth responses and Gaussian fits of the modified AuNPs taken by the dark-field optical section microscope. The position were indicated in (a). 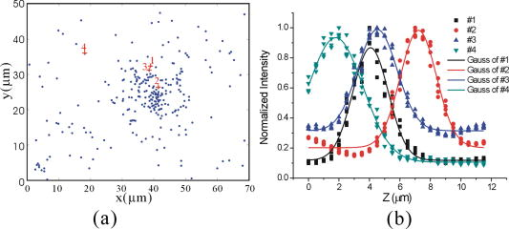 Video 3A 3-D movie of a lung caner cell (CLI-0) viewed at different angles. The 3-D distribution was reconstructed by calculating the positions of peak scattering intensities of the AuNPs. (QuickTime; ). . 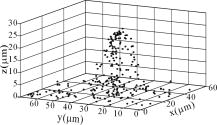 3.3.Measurements of Cell Morphological ChangesIt is known that shape of animal cells is mainly decided by the internal structural elements, including the filamentous structures of their cytoskeleton. Actin filament dynamics influence the overall shape of the cell by pushing on the plasma membrane. Once the actin filaments are affected under external drugs or mechanical forces, the morphology of the cell will undergo changes. The morphological changes usually take several minutes. In our setup, the recording of a 3-D image takes only a few seconds. Therefore, our method is very useful for the dynamic studies. In the drug-cell interactions, we added a , cytochalasin D to the culture medium. Cytochalasin D (Zygosporium mansonii, CALBIOCHEM) is a cell-permeable and potent inhibitor of actin polymerization.15 It disrupts actin microfilaments. Therefore, the actin filaments are dissolved and the membrane height will be reduced due to the lack of the supporting cytoskeleton. To observe the effects of cytochalasin D on the cell morphology, we recorded and reconstructed the 3-D AuNP images at 1, 10, 20, and after the injection of the drug. Figures 6 show the 3-D images. There were two neighboring cells in the images. The membranes of cells were not significantly affected by the drug at the initial . The cell height was . At reaction time, the higher part of the membrane was reduced. For , its height was reduced to . Fig. 63-D images of the distribution of AuNPs on lung cancer cells. The culture medium was added with cytochalasin D. The images were recorded at (a) 1, (b) 10, (c) 20, and (d) after the addition of cytochalasin D. There were two neighboring cells in the images. The membranes of cells were not significantly affected at initial . For , the cell membrane height was significantly reduced. 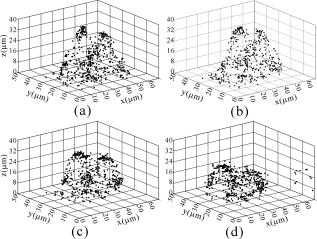 It is noted that gold nanoparticles are already used for many biological applications, such as the tracking of movement along microtubules.16, 17 However, those measurements are based on 2-D imaging techniques. Our proposed method can map 3-D distribution of nanoparticles. It is particularly useful for cells with a large height, such as cancer cells with a large nucleus. The 3-D images can provide more information for the cell studies. For example, Fig. 7a shows the 2-D distribution of AuNPs in the plane. These images were the projection images of Fig. 6, recorded at 1, 20, and after the injection of cytochalasin D. It is hard to identify two cells from the 2-D images. Besides, the effect of cytochalasin D on the cell morphology is not obvious. Nevertheless, we can clearly identify two cells from the 3-D image. The 3-D time lapse images indicate that cytochalasin D results in a large reduction of cell height. Fig. 7(a) 2-D distribution of AuNPs at the plane. These images were the projection images as shown in Fig. 6, recorded at 1, 20, and after the interaction of cytochalasin D. The scale bar is . (b) The fluorescent images of a CL1-0 cell mapped by a 63x oil objective lens. The interaction times between cells and cytochalasin D drug were 1, 20, and . 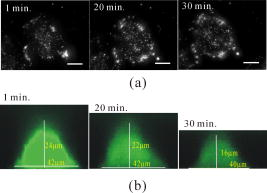 To verify the interactions between cells and cytochalasin D, we applied a confocal microscope (Leica) to observe the morphologic changes. Figure. 7b shows the fluorescent images of a CL1-0 cell by a 63x oil objective lens taken at 1-, 20-, and interaction times. To see the cells, uniform cytoplasmic staining was done by introducing fluorescent CellTracker (CMFDA, Abs: ; Ex: ) to the cells. And the time-lapse records started after adding cytochalasin D with a final concentration of . The images indicate the height and width of the cell. The cell height was reduced from at interaction time, while the lateral size was only a little changed. These results were quite consistent with the results measured by using AuNPs. It should be noted that although fluorescent confocal microscopy can take the 3-D images, the fluorescent quenching causes a large decrease of signals. Besides, the surface boundary is not easy to be identified. AuNPs have no photobleaching problem and can be applied for long-term observations. 4.ConclusionIn summary, we present a method to map 3-D distribution of cell membrane by using AuNPs. The AuNPs images were taken by using a dark-field sectional microscope equipped with a quick scan along the depth direction. The bare AuNPs were not found on the cells due to the electroexpelling force between cell membrane and nanoparticles. With a suitable coating of positively charged molecules on the AuNP surface, the AuNP can be immobilized on the membrane without the internalization of cells. The optical scattering efficiency of AuNPs was much larger than that of cells. Hence, the 3-D positions of AuNPs are easily calculated by using a sorting and fitting program. The combination of AuNPs and dark-field optical section microscopy provides a convenient way to study the 3-D interactions between cells and biomolecules. With very few AuNPs, this method can also be applied for 3-D single-nanoparticle tracking. AcknowledgmentsThis research is supported by the National Science Council, Taiwan (Grant No. 97-3112-B-001-022) and the Thematic Project of Academia Sinica, Taiwan. ReferencesC. L. Curl, C. J. Bellair, T. Harris, B. E. Allman, P. J. Harris, A. G. Stewart, A. Roberts, K. A. Nugent, and L. M. Delbridge,
“Refractive index measurement in viable cells using quantitative phase-amplitude microscopy and confocal microscopy,”
Cytometry, Part A, 65 88
–92
(2005). https://doi.org/10.1002/cyto.a.20134 1552-4922 Google Scholar
R. Barer,
“Refractometry and interferometry of living cells,”
J. Opt. Soc. Am., 47 545
–556
(1957). https://doi.org/10.1364/JOSA.47.000545 0030-3941 Google Scholar
P. Marquet, B. Rappaz, P. J. Magistretti, E. Cuche, Y. Emery, T. Colomb, and C. Depeursinge,
“Digital holographic microscopy: a noninvasive contrast imaging technique allowing quantitative visualization of living cells with subwavelength axial accuracy,”
Opt. Lett., 30 468
–470
(2005). https://doi.org/10.1364/OL.30.000468 0146-9592 Google Scholar
F. Charrière, A. Marian, F. Montfort, J. Kuehn, T. Colomb, E. Cuche, P. Marquet, and C. Depeursinge,
“Cell refractive index tomography by digital holographic microscopy,”
Opt. Lett., 31 178
–180
(2006). https://doi.org/10.1364/OL.31.000178 0146-9592 Google Scholar
B. Rappaz, P. Marquet, E. Cuche, Y. Emery, C. Depeursinge and P. J. Magistretti,
“Measurement of the integral refractive index and dynamic cell morphometry of living cells with digital holographic microscopy,”
Opt. Express, 13 9361
–9373
(2005). https://doi.org/10.1364/OPEX.13.009361 1094-4087 Google Scholar
W. Choi, C. Fang-Yen, K. Badizadegan, S. Oh, N. Lue, R. R. Dasari, and M. S. Feld,
“Tomographic phase microscopy,”
Nat. Methods, 4 717
–719
(2007). https://doi.org/10.1038/nmeth1078 1548-7091 Google Scholar
R. Shukla, V. Bansal, M. Chaudhary, A. Basu, R. R. Bhonde, and M. Sastry,
“Biocompatibility of gold nanoparticles and their endocytotic fate inside the cellular compartment: A microscopic overview,”
Langmuir, 21 10644
–10654
(2005). https://doi.org/10.1021/la0513712 0743-7463 Google Scholar
M. A. van Dijk, A. L. Tchebotareva, M. Orrit, M. Lippitz, S. Berciaud, D. Lasne, L. Cognet, and B. Lounis,
“Absorption and scattering microscopy of single metal nanoparticles,”
Phys. Chem. Chem. Phys., 8 3486
–3495
(2006). https://doi.org/10.1039/b606090k 1463-9076 Google Scholar
P. Alivisatos,
“The use of nanocrystals in biological detection,”
Nat. Biotechnol., 22 47
–52
(2004). https://doi.org/10.1038/nbt927 1087-0156 Google Scholar
D. A. Schultz,
“Plasmon resonant particles for biological detection,”
Curr. Opin. Biotechnol., 14 13
–22
(2003). https://doi.org/10.1016/S0958-1669(02)00015-0 0958-1669 Google Scholar
W. Jiang, B. Y. S. Kim, J. T. Rutka, and W. C. W. Chan,
“Nanoparticle-mediated cellular response is size-dependent,”
Nat. Nanotechnol., 3 145
–150
(2008). https://doi.org/10.1038/nnano.2008.30 1748-3387 Google Scholar
W. K. Rhim, J. S. Kim, and J.-M. Nam,
“Lipid-gold-nanoparticle hybrid-based gene delivery,”
Small, 4 1651
–1655
(2008). https://doi.org/10.1002/smll.200800628 1613-6810 Google Scholar
M. C. Daniel and D. Astruc,
“Gold nanoparticles: assembly, supramolecular chemistry, quantum-size-related properties, and applications toward biology, catalysis, and nanotechnology,”
Chem. Rev. (Washington, D.C.), 104 293
–346
(2004). 0009-2665 Google Scholar
J. Bauer, Cell Electrophoresis, CRC Press, Boca Raton
(1994). Google Scholar
J. A Cooper,
“Effects of cytochalasin and phalloidin on actin,”
J. Cell Biol., 105 1473
–1478
(1987). https://doi.org/10.1083/jcb.105.4.1473 0021-9525 Google Scholar
H. Geerts, M. De Brabander, R. Nuydens, S. Geuens, M. Moeremans, J. De Mey, and P. Hollenbeck,
“Nanovid tracking: a new automatic method for the study of mobility in living cells based on colloidal gold and video microscopy,”
Biophys. J., 52 775
–782
(1987). https://doi.org/10.1016/S0006-3495(87)83271-X 0006-3495 Google Scholar
M. Bendayan,
“A review of the potential and versatility of colloidal gold cytochemical labeling for molecular morphology,”
Biotech. Histochem., 75 203
–242
(2000). 1052-0295 Google Scholar
|


