
|
|
1.IntroductionNear-infrared spectroscopy (NIRS) is an effective tool for non-invasive investigation of cerebral oxygenation and hemodynamics during functional brain activation.1, 2, 3 It has several advantages over other functional measurement methods such as functional magnetic resonance imaging, positron emission tomography, and electroencephalography. These advantages include good temporal resolution, measurement of both oxygenated (HbO) and deoxygenated (HbR) hemoglobin, portability, and low equipment cost.4 In NIRS, a simple calculation based on measurements of the change in the attenuation of light as it propagates through the head of a subject can provide the concentration change of HbO and HbR in the brain. The relationship between attenuation and concentration change is modeled by a linear equation based on the modified Lambert–Beer law. The coefficients of the linear equation include the molar absorption coefficients of HbO and HbR,5 and the optical pathlengths of the measurement light in the activated region. If the oxy- and deoxy-hemoglobin concentrations change homogeneously throughout the entire tissue volume, a total optical pathlength can be used as the coefficient. However, if these concentrations change locally in the cortex, a partial optical pathlength of the cortical tissue should be used to obtain an accurate estimation.6, 7, 8 The partial optical pathlengths of the cortical tissue are difficult to know because there is no experimental method of directly obtaining these values. Thus, historically, a wavelength-independent constant (unity) or a wavelength-dependent total optical pathlength has been substituted for these values. This kind of substitution, however, inevitably provides a source of error when calculating concentration changes. These errors are refereed to as cross-talk because a change in one of the chromophores may mimic a change in another chromophore.6, 7 If we adopt a constant or a total pathlength as a substitution for the partial pathlength, cross-talk is inevitable. Thus, it is important to select a good combination of measurement light wavelengths to minimize the effect. Uludag 6 proposed one measure of cross-talk, which led to other studies reporting on good wavelength combinations.9, 10 However, Uludag’s measure may be inadequate in some situations because it gives a zero value (no cross-talk) when an estimation error really exists. In this paper, we propose a new cross-talk measure, which provides a unified treatment of both HbO and HbR cross-talks. This measure is guaranteed to be zero if and only if there is no cross-talk. The proposed values and Uludag’s values of dual and triple wavelength measurements for various wavelength combinations were calculated and compared in two cases—a wavelength-independent constant substitution and a wavelength-dependent total optical pathlength substitution. An appropriate wavelength combination, which minimizes cross-talk error, was given. The cross-talk calculation was performed based on the estimated total and partial optical pathlength obtained by Monte Carlo simulation on a layered model of an adult head. 2.Theory2.1.NIRS MethodWhen using near-infrared light in a uniformly turbid medium, the temporal attenuation change resulting from a small homogeneous change in the absorption coefficient can be represented by the modified Lambert–Beer law with the assumption that measurement noise is absent where is the optical pathlength of the activated region at wavelength , and is given as In Eq. 2, and represent oxygenated and deoxygenated hemoglobin concentration changes, whereas and denote their molar absorption coefficients.Estimating the concentration changes in two kinds of chromophores ( and ) requires at least two light sources of different wavelengths ( , ). Dual and triple wavelength measurements are popular in NIRS. We use vectors to represent the temporal attenuation change and hemoglobin concentration changes as Equations 1, 2 are summarized as follows:whereIf hemoglobin concentrations change locally in the cortex during brain activation, the temporal attenuation change should be given as follows.11, 12 whereand is a partial optical pathlength of the cortical tissue.If the partial optical pathlength within the cortex is known in advance, we can obtain accurate values of hemoglobin concentration changes by applying the inverse or pseudo inverse matrix of to the temporal attenuation change . However, it is difficult to know this pathlength in advance since the partial optical pathlength cannot be measured experimentally. In practice, we approximate using a known matrix . Thus, the estimated hemoglobin concentration change is given as We refer to the matrix, , as a reproduction matrix of hemoglobin concentration change. A wavelength-independent constant matrix (a unit matrix) or a wavelength-dependent total path-length matrix have historically been used as . We represent in this paper.If we set , the reproduction matrix becomes a unit matrix. Thus, its reproduction is complete and the hemoglobin concentration changes obtained is equal to their true values. However, if we set or , is no longer a unit matrix. Therefore, it leads to cross-talk errors in the derived concentration changes. 2.2.Uludag’s Cross-Talk MeasureUludag 6 proposed a measure to evaluate cross-talk caused by a deformed reproduction matrix. They defined the cross-talk from chromophore A to chromophore B as the ratio of the determined concentration change of chromophore B and A, where a change was introduced in A and not in B. Thus, Uludag’s cross-talk measure represented by a reproduction matrix are given as follows: where2.3.New Cross-Talk MeasureHere we propose a new cross-talk measure. Because we do not know the real relationship between the concentration changes of HbO and HbR, we use here a very simple assumption that hemoglobin concentration changes reside on a unit circle. We evaluate the mean squared error of the estimated hemoglobin concentration changes induced by a reproduction matrix . Let be a point on a unit circle , Then the mean squared error of the reproduced hemoglobin concentration change is defined asAt this point, we introduced a scaling factor, , because the estimated hemoglobin concentration change has an ambiguity in its scaling.Let the integral term in Eq. 18 be , where we used Then, the minimum of is achieved whenSubstituting this value in Eq. 21, we haveThus,We propose as a new cross-talk measure. By the given definition, if and only if . is also scale invariant [i.e., ].2.4.Geometric Interpretation of Cross-Talk MeasuresHere, we give geometric interpretations of the cross-talk measure along with that provided by Uludag. If the true hemoglobin concentration change resides on a unit circle, then the reproduced hemoglobin concentration change is on an ellipsoid. Figure 1a shows these two distributions. The blue line shows the distribution of , and the green line shows the corresponding distribution of . Here, we used the following reproduction matrix , as an example, The scale value in this case. The arrows in Fig. 1a represent the reproduction from to . Thus, our cross-talk measure corresponds to the mean squared sum of these arrow lengths. Conversely, Fig. 1b shows a geometric interpretation of the Uludag measure. Blue and green lines indicate the same distributions as in Fig. 1a. Two points on a unit circle, and , move to the reproduced points along the arrows shown in Fig. 1. Thus, and .Fig. 1Geometric interpretation of cross-talk measures. The blue circle represents the original concentration change, and the green ellipsoid represents the reproduced concentration change: (a) The proposed measure and (b) Uludag’s measure.  The Uludag cross-talk measures were determined by deformations at only two points; therefore, it fails to give an appropriate deformation measure in certain situations. For example, see Fig. 2b, where and . In this case, the Uludag measures are and even though obviously gives deformation. This implies that is not necessarily equal to (no deformation) even if and . On the other hand, our measure gives an appropriate evaluation of deformation even in this case [see Fig. 2a].3.Determining Wavelength-Dependent Optical Pathlength by Monte Carlo SimulationA cross-talk value depends on the wavelength combination of source lights because both molar absorption coefficients and optical pathlengths depend on the wavelength. To study this relation, we performed a Monte Carlo simulation and predicted the wavelength-dependent total and partial optical pathlengths. We used tMCimg, the simulation program provided to public by the Photon Migration Imaging Laboratory at Massachusetts General Hospital. A a five-layer model of an adult head consisting of scalp, skull, cerebrospinal fluid (CSF), gray matter, and white matter was used. The size of simulated tissues was , and the thicknesses of the scalp, CSF, and gray matter layers were 3, 2, and , respectively. Because the skull thickness has a great influence on the pathlength, three simulation trials based on different thicknesses (4, 7, and ) of the skull layer were performed. The source-detector separation was set . The simulation was performed for six wavelengths (670, 690, 720, 750, 780, and ), and the total and partial optical pathlengths at each wavelength were calculated. The total and partial optical pathlengths for other wavelengths were determined by interpolating these six values. The wavelength-dependent optical properties (absorption coefficient and transport scattering coefficient ) at six wavelengths are shown in Table 1 . These data are drawn from a recent report.10 Table 1Wavelength-dependent optical properties (absorption coefficient and transport scattering coefficient) and the thickness of each layer of our head model. These values were drawn from Ref. 10.
Figure 3 shows the total pathlength [Fig. 3a] and the partial pathlength in the cortex [Fig. 3b] obtained by our simulation. These values were used for our calculations of cross-talk. Fig. 3Wavelength dependence of (a) the total optical pathlength and (b) the partial optical pathlength in the cortex. The skull thickness was assumed to be 4, 7, and , and the source-detector spacing was set to . pathlengths at six wavelengths were predicted by Monte Carlo simulation and interpolated to obtain the curves.  4.Results and DiscussionFigures 4a, 4b, 4c shows the proposed cross-talk measure values [Eq. 26] calculated from the Monte Carlo simulation result. Dual wavelength measurement was assumed. Figures 4a, 4b, 4c correspond to skull thicknesses assumed to be 4, 7, and , respectively. The upper triangle of each figure shows the cross-talk , where a unit matrix was used as . The lower triangle gives the , where the total pathlength matrix was used. The cross-talk values were generated for all combinations of the two wavelengths between 680 and , except when two wavelengths were too close to each other. The colors denote the cross-talk values, ranging from 0 (blue) to 0.5 (red). In this way, good wavelength combinations having a small cross-talk are represented by dark blue. Fig. 4d shows the average for the subfigures. The dark blue area of Fig. 4d indicates good wavelength combinations—those that provide little cross-talk for a wide range of skull thickness. Fig. 4Proposed cross-talk by dual wavelength measurement. Combinations of two wavelengths between 680 and are shown. (a, b, c) correspond to skull thicknesses of 4, 7, and , respectively. The upper triangle represents cross-talk using a constant substitution . The lower triangle represents cross-talk using a total pathlength substitution . (d) shows the average of (a), (b), and (c). 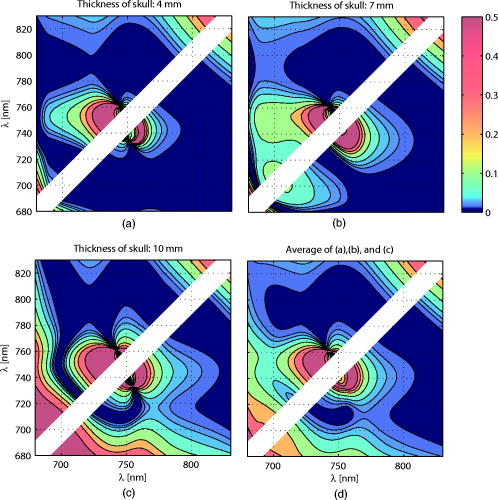 Figures 4a and 4b indicate that the cross-talks are similar for skull thickness of 4 and . On the other hand, a skull thickness of [Fig. 4c] showed different cross-talk. This is likely because changes in partial optical pathlength with respect to the wavelength are large when the skull thickness is . The dark blue area in Fig. 4d indicates good wavelength combinations, producing little cross-talk for a wide range of skull thicknesses. These combinations are different for (upper triangle) and (lower triangle). Interestingly, however, the area sizes are similar. Therefore, a simple substitution of a constant is not an inferior method to a total path-length substitution if the wavelength combination is carefully selected. The cross-talk for triple wavelength measurement is shown in Figs. 5a, 5b, 5c . In our analysis, one wavelength among the three source lights was fixed at . The cross-talk for all combinations of the two remaining wavelengths between 680 and , except when the two wavelengths were too close to each other, are given. The parameters used to draw the figure and the meaning of each subfigure are the same as for Fig. 4. Figure 5d shows the average for the subfigures. Fig. 5Proposed cross-talk by triple wavelength measurement. One wavelength was fixed . Combinations of other two wavelengths between 680 and were tested and are shown. (a, b, c) correspond to skull thickness of 4, 7, and , respectively. The upper triangle represents cross-talk using a constant substitution . The lower triangle represents cross-talk using a total pathlength substitution . (d) shows the average of (a), (b), and (c).  Figure 5d shows that triple wavelength measurement provides good cross-talk performance for many wavelength combinations if we use a total path-length substitution. On the other hand, triple wavelength measurement using a constant substitution gives a very good cross-talk performance for a small number of combinations. Thus, we need to carefully select the wavelength combination if we use a constant substitution. The absolute values of Uludag’s cross-talk measure, , are shown in Fig. 6a for dual wavelength measurement and in Fig. 6b for triple wavelength measurement. Figures 6a and 6b show the averaged cross-talk values when skull thickness values of 4, 7, and were assumed. Because the scaling of Uludag’s measure is different from the proposed one, its value was scaled so that both the proposed and Uludag’s measure give an identical cross-talk value at the wavelength combination of 690 and in Fig. 6a and 780, 805, and in Fig. 6b, respectively. Fig. 6Absolute values of Uludag’s cross-talk measure of HbO to HbR, , by (a) dual and (b) triple wavelength measurement. They show the averaged cross-talk values when skull thickness values of 4, 7, and were assumed. 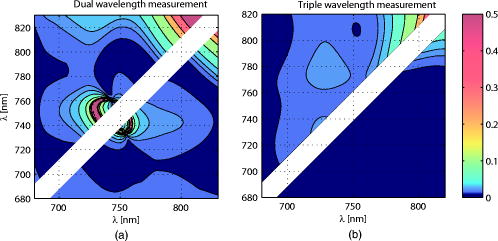 In dual wavelength measurement, the cross-talk of the proposed measure [Fig. 4d] and Uludag’s [Fig. 6a] are basically similar. However, when two wavelengths are small (lower left corner of each figure), Uludag’s measure gives very small cross-talk values compared to the proposed method. A weak tendency to do this is also found in triple wavelength measurement. 5.ConclusionSimulation results show the following:
The proposed measure can be easily extended to the cross-talk problem, including more than three chromophores. Uludag’s measure is also extendable. However, if three chromophores (for example, A, B, and C) are considered, six cross-talk measures are defined by Uludag’s approach: , , and . Thus, we may need an another criterion to integrate these measures into one. Measurement noise is another important factor in selecting a wavelength combination because it significantly influences the measurement accuracy. Several studies concerning this issue have been performed,13, 9 and they pointed out that two wavelengths that are separated from each other basically give good performance in dual wavelength measurement. Thus, we should select a wavelength combination that is in the small cross-talk area (dark blue area) and whose wavelengths are apart (distant points from the diagonal line of the figure). Triple wavelength measurement is expected to have a good noise performance because it solves an overdetermined linear system of equations to obtain the hemoglobin changes. However, triple wavelength measurement has not been thoroughly evaluated. This remains for future work. AcknowledgmentThe authors thank the Photon Migration Imaging Laboratory at Massachusetts General Hospital for the Monte Carlo simulation code (available at http://www.nmr.mgh.harvard.edu/PMI/index.htm). ReferencesE. M. C. Hillman,
“Optical brain imaging in vivo: techniques and applications from animal to man,”
J. Biomed. Opt., 12
(5), 051402
(2007). https://doi.org/10.1117/1.2789693 1083-3668 Google Scholar
Y. Hoshi,
“Functional near-infrared spectroscopy: current status and future prospects,”
J. Biomed. Opt., 12
(6), 062106
(2007). https://doi.org/10.1117/1.2804911 1083-3668 Google Scholar
H. Obrig and A. Villringer,
“Beyond the visible—imaging the human brain with light,”
J. Cereb. Blood Flow Metab., 23 1
–18
(2003). https://doi.org/10.1097/00004647-200301000-00001 0271-678X Google Scholar
J. C. Hebden,
“Advances in optical imaging of the newborn infant brain,”
Psychophysiology, 40 501
–510
(2003). https://doi.org/10.1111/1469-8986.00052 0048-5772 Google Scholar
S. J. Matcher, C. E. Elwell, C. E. Cooper, M. Cope, and D. T. Delpy,
“Performance comparison of several publishing tissue near-infrared spectroscopy algorithms,”
Anal. Biochem., 227 54
–68
(1995). https://doi.org/10.1006/abio.1995.1252 0003-2697 Google Scholar
K. Uludag, M. Kohl, J. Steinbrink, H. Obrig, and A. Villringer,
“Cross-talk in the Lambert–Beer calculation for near-infrared wavelengths estimated by Monte Carlo Simulations,”
J. Biomed. Opt., 7
(1), 51
–59
(2002). https://doi.org/10.1117/1.1427048 1083-3668 Google Scholar
G. Strangman, M. A. Franceschini, and D. A. Boas,
“Factors affecting the accuracy of near-infrared spectroscopy concentration calculations for focal change in oxygenation parameters,”
Neuroimage, 18 865
–879
(2003). https://doi.org/10.1016/S1053-8119(03)00021-1 1053-8119 Google Scholar
Y. Hoshi, M. Shimada, C. Sata, and Y. Iguchi,
“Reevaluation of near-infrared light propagation in the adult human head: implications for functional near-infrared spectroscopy,”
J. Biomed. Opt., 10
(6), 064032
(2005). https://doi.org/10.1117/1.2142325 1083-3668 Google Scholar
K. Uludag, J. Steinbrink, A. Villringer, and H. Obrig,
“Separability and cross-talk: optimizing dual wavelength combinations for near-infrared spectroscopy of the adult head,”
Neuroimage, 22 583
–589
(2004). https://doi.org/10.1016/j.neuroimage.2004.02.023 1053-8119 Google Scholar
N. Okui and E. Okada,
“Wavelength dependence of cross-talk in dual-wavelength measurement of oxy- and deoxy-hemoglobin,”
J. Biomed. Opt., 10
(1), 011015
(2005). https://doi.org/10.1117/1.1846076 1083-3668 Google Scholar
M. Hiraoka, M. Firbank, M. Essenpresis, M. Cope, S. R. Arridge, P. van der Zee, and D. T. Delpy,
“A Monte Carlo investigation of optical pathlength in inhomogeneous tissue and its application to near-infrared spectroscopy,”
Phys. Med. Biol., 38 1859
–1876
(1993). https://doi.org/10.1088/0031-9155/38/12/011 0031-9155 Google Scholar
Y. Fukui, Y. Ajichi, and E. Okada,
“Monte Carlo prediction of near-infrared light propagation in realistic adult and neonatal head models,”
Appl. Opt., 42 2881
–2887
(2003). https://doi.org/10.1364/AO.42.002881 0003-6935 Google Scholar
Y. Yamashita, A. Maki, and H. Koizumi,
“Wavelength dependence of the precision of noninvasive optical measurement of oxy- and deoxy-, and total-hemoglobin concentration,”
Med. Phys., 28 1108
–1114
(2001). https://doi.org/10.1118/1.1373401 0094-2405 Google Scholar
|
||||||||||||||||||||||||||||||||||||||||||||||||||||||||||||||||||||||||||||||||||||||||||||||||||


