

|
|
1.IntroductionThe advent of numerous noninvasive imaging modalities, such as X-ray, computed tomography, single photonemission-computed tomography, positron emission tomography (PET), magnetic resonance imaging (MRI), ultrasound imaging, radio frequency (rf), and optical imaging now allows scientists and clinicians to acquire in vivo images of the anatomy and physiology of animals and humans.1, 2 Each of these in vivo imaging techniques possesses characteristic strengths and weaknesses. For each imaging modality, substantial attention has been devoted to developing contrast agents not only for improving the contrast of the acquired images, but also for molecular imaging targeting specific biomolecules, cell tracking, and gene expression.3, 4, 5, 6 We have developed hybrid imaging modalities, such as thermoacoustic (TA) tomography (TAT) and photoacoustic (PA) tomography (PAT), for different applications7, 8, 9, 10, 11 and combined these two imaging modalities into a single imaging system for early breast cancer detection.12 Diagnosis of cancer in its early stages depends on the recognition of subtle changes in tissue properties, such as mechanical properties, optical absorption, and rf absorption. For example, changes in ion and water concentrations lead to changes in rf absorption. To detect these changes, nonionizing rf electromagnetic waves and visible/near infrared (NIR) light-based imaging modalities have generated particular interest over the last decade.7, 8, 9, 10, 11, 13, 14, 15, 16, 17 TAT/PAT synergizes the advantages of pure-ultrasound and pure-rf/optical imaging,7, 13 allowing both satisfactory spatial resolution and high soft-tissue contrast. For instance, PAT is a unique noninvasive technology for imaging and quantifying the levels of vascularization and oxygen saturation in tumors.9, 10, 11, 18, 19 These features are associated with angiogenesis and hypoxia accompanying malignant tumors.20, 21 TAT/PAT is also capable of revealing information such as water/ion concentration, blood volume, and oxygenation of hemoglobin. Because these parameters can change during the early stages of cancer, TAT/PAT offers opportunities for early detection. However, even though high rf and optical contrast exists between well-developed malignant tumor tissue and normal human breast tissue, the contrast during very early stages of cancer may be insufficient. Thus, a targeted contrast agent could be greatly beneficial for early cancer diagnosis using TAT/PAT. Recently, carbon nanotube-based contrast agents have shown promise for a variety of imaging techniques.22, 23, 24, 25 The strategies for development of these contrast agents have included encapsulation of medically relevant metal ions within their carbon sheath,22 external functionalization of the carbon sheath with a variety of imaging agents,23, 24 and exploiting the intrinsic physical properties of the carbon nanotubes.25 In this work, we have explored the intrinsic optical26, 27 and rf28 absorbing properties of single-walled carbon nanotubes (SWNTs) with the goal of developing them as multimodal contrast agents for simultaneous TAT and PAT. 2.Methods and Materials2.1.TAT/PAT ScannerA combined TAT/PAT scanner12 was used for all the experimental studies in this work. Images were collected with microwave excitation (TAT) and then with laser excitation (PAT). For TAT, a microwave source with a pulse width and pulse repetition rate was the rf source. The pulse energy was estimated to be around , falling within the IEEE safety standards.29 PAT was done at wavelength. A Q-switched Nd:YAG laser with a pulse repetition rate, (at wavelength) laser pulse width, and maximal output energy was the light source. The incident laser fluence on the sample surface was controlled to be , conforming to the American National Standards Institute (ANSI) standards.30 The generated acoustic signals were detected using two different nonfocused transducers operating at a central frequency ( -diam active area, ISS COM; -diam active area, ISS COM, Krautkramer). For cross-sectional TAT/PAT imaging, data were collected around the sample in a full circle. Different reconstruction algorithms can be used to reconstruct TAT/PAT images from raw data.16 Here, a delay and sum (backprojection) algorithm was used for all image reconstruction.16 The sample was placed inside the breast holder chamber, which was filled with mineral oil. Mineral oil does not absorb microwaves. Moreover, because mineral oil is transparent, the light absorption is also very small. Mineral oil also acts as a coupling medium for sound propagation. Thus for all our experiments, mineral oil was an ideal choice as a background medium. 2.2.PA Imaging SystemA reflection-mode PA imaging system31 was used to test the in vitro blood signal enhancement using the SWNTs. A tunable Ti:sapphire laser (LT-2211A, LOTIS TII) pumped by a Q-switched Nd:YAG (LS-2137, LOTIS II) laser was the light source, providing pulse duration and a pulse repetition rate. A central frequency, spherically focused ultrasonic transducer (V308, Panametrics-NDT) was used to acquire the generated PA signals. The transducer had a focus length, a -diam active area element, and 72% bandwidth. The signal was then amplified by a low-noise amplifier (5072PR, Panametrics-NDT), and recorded using a digital oscilloscope (TDS 5054, Tektronix) with a 50 mega-sampling rate. PA signal fluctuations due to pulse-to-pulse energy variation were compensated by signals from a photodiode (DET110, Thorlabs), which sampled the energy of each laser pulse. 2.3.SWNTs SynthesisA diblock copolymer templating method was used to coat Fe coated on Si wafers.32 The wafers were placed in a quartz reaction chamber (Easy Tube 2000, First Nano) and heated in Ar to . The chamber was filled with for , and was added to the gas flow as the carbon feedstock for to initiate the growth of SWNTs. Subsequently, the carbon feedstock was switched off and the furnace was cooled to room temperature. Raman spectroscopy (LabRAM Aramis, Horiba JvonYvon) at excitation, transmission electron microscope (TEM) imaging (JEOL 2000 FX electron microscope operating at ), potential (Malvern Zetasizer NanoZS system with irradiation from a He–Ne laser), and atomic force microscopy [(AFM) MFD-3D-BIO, Asylum Research] were used to characterize the SWNTs. Figure 1a shows a representative bright-field TEM image of densely populated SWNTs on the surface of the substrate. Further investigation by high-resolution TEM (HRTEM) [Fig. 1b] and AFM [Fig. 1c] showed SWNTs with diameters between 1.2 and and lengths between and . Figure 1d shows a representative Raman spectrum of SWNTs at the laser excitation wavelength of . The Raman spectrum shows a G band at and a D band at , with a D/G band ratio for Gd-SWNTs of , indicating that the SWNTs have very few defects.33 The radial breathing modes [Fig. 1d inset], unique to SWNTs,33 further corroborate the HRTEM and AFM results and confirm the presence of SWNTs. Four types of multiwalled carbon nanotubes (MWNTs) of various inner and outer diameters, fullerenes (Sigma-Aldrich, USA, catalog number 483036), and graphite microparticles (Sigma-Aldrich, catalog number 496596) were also used for initial studies. SWNT suspensions with different concentrations were prepared in of 1% biologically compatible Pluronic® F127 surfactant solution (pH 7). The different domains of the nonionic Pluronic F127 likely wrapped themselves in energy-minimized conformations around the nanotubes to solubilize the SWNTs by steric stabilization, producing nearly neutral nanotube suspensions.34 These suspensions were stable during the period of the entire study. The -potential measurements were performed on SWNTs dispersed in Pluronic F-127 and showed a peak potential of with a Gaussian distribution (full width half maximum of the ). This value is similar to other reported -potential measurements on neutral stable SWNTs dispersed in Pluronic F127.34 Figure 1e shows an optical image of the SWNTs ( concentration) dispersed in Pluronic F127 after aggressive sonication. Fig. 1(a) A low-resolution bright-field TEM, (b) HRTEM image of bundled SWNTs grown using Fe as the catalyst. (c) Tapping mode AFM images of dispersed SWNTs. (d) D-band and G-band Raman spectra of the SWNTs. The inset shows the radial breathing modes. (e) Vials contain aqueous dispersions of SWNTs in Pluronic F127 after being sonicated. From left to right, the concentrations are (i) 0, (ii) 0.1, (iii) 0.25, (iv) 0.5, (v) 0.75, and, (vi) . (Color online only.)  3.Results and DiscussionsA low-density polyethylene (LDPE) vial with an inner diameter of and volume was used as a sample holder for the entire study. The vial was filled with the sample and placed inside the TAT/PAT scanner. Deionized (DI) water was used for TA signal comparison, whereas blood was used for PA signal comparison. Water and ions are two well-known sources of microwave absorbers in the human body, and they produce strong TA signals. Therefore, to show that a new material (in this case, SWNTs) can function as a contrast agent, we have to first show that SWNTs are capable of generating TA signals comparable to or stronger than a known TA signal producer in the body. The rf contrast between malignant tumor tissue and normal human breast tissue is as high as 4:1.35 The rf absorption of water compared to background human breast tissue is also on the order of 4:1. Thus, we compared the rf absorption of SWNTs to that of water. Similarly, blood is a dominant light absorber in the human body and produces strong PA signals. Therefore, to show that SWNTs can function as a contrast agent in PA, we must first show that SWNTs are capable of generating PA signals comparable to or stronger than that of a known absorber in the body. Blood was thus an obvious choice for comparison here. For the tissue phantom imaging, porcine fat was used as the background medium mimicking the tissue; the sample holder (LDPE vial) was inserted in the center of a -diam porcine fat cylinder of high. The vial was filled with different samples (DI water, SWNTs, and blood) and images were collected. The hole inside the porcine fat had a slightly larger diameter than the sample holder’s outside diameter. Figure 2a shows the TA signal generated from the sample holder (LDPE vial) filled with DI water and with mineral oil. As we can clearly see, there is no TA signal from the sample holder filled with mineral oil (red line, showing only the noise of the system, no TA signal was observed). Therefore, the LDPE vial does not generate any TA signal. Moreover, the LDPE vial we used is semi-transparent white and, therefore, it does not absorb enough light to produce any measurable PA signal. Nevertheless, we tested the LDPE vial filled with blood and mineral oil under wavelength light. Figure 2b shows the PA signal generated from the vial. It is clearly seen that vial filled with mineral oil does not produce any significant PA signal at compared to the signal generated from blood. Therefore, we conclude that the sample holder vial has no effect either in TA or in PA signal generation, and henceforth, all signals observed are considered to be generated from the sample placed inside the vial. We also tested the 1% Pluronic F127 surfactant solution and observed no significant TA/PA signals. Figure 2c shows the TA signal generated from the LDPE vial filled with 1% Pluronic F127 surfactant solution and DI water, and there is no significant contribution from the surfactant solution. Figure 2d shows the PA signal generated from blood and 1% Pluronic F127 surfactant solution. Clearly, there is no PA signal generated from 1% Pluronic F127 surfactant solution. Therefore, any TA/PA signal contribution coming from the Pluronic F127 will be ignored in all future discussion. Fig. 2(a) TA signals from a LDPE vial (i.d. , volume ) filled with mineral oil (MO) and DI water (DI). (b) PA signals from LDPE vial filled with blood and MO at . (c) TA signals from the LDPE vial filled with 1% Pluronic F127 solution (F127) and De-ionized water (DI). (d) PA signals from a tube (Silastic® laboratory tubing, Dow Corning Corp., with i.d., o.d.) filled with blood and with 1% Pluronic F127 solution (F127). (Color online only.)  An initial assessment was made for all the carbon nanostructures (SWNTs, MWNTs, , and graphite microparticles). Table 1 summarizes the peak-to-peak TA/PA signal amplitudes obtained from various samples with the two different diameter transducers. Among all the samples, only SWNTs showed a significant increase in TA signal compared to DI water and a significant increase in PA signal compared to rat blood. To avoid overinterpretation of the data presented in Table 1, it is important to mention here that the TA and PA signals generated from the MWNT are not directly proportional to the outer diameter. Other parameters, such as the inner diameter, nanotube length, and number of concentric nanotubes, may also affect the generated signal amplitudes. The only conclusion that can be drawn from Table 1 is that the SWNT sample generates a PA and TA signal stronger than that from blood, water, and other carbon nanostructures. The increases in TA and PA signals were shown by pristine SWNTs (mass of Fe is of total weight of the SWNT sample) as well as purified SWNTs (mass of Fe is of the total weight of the SWNT sample), clearly indicating that the observed effects were due to the SWNTs and not due to the presence of iron. Because only SWNTs showed a significant increase in both TA and PA signals, they were used for further studies. Table 1Peak-to-peak TA/PA signal amplitudes obtained from various samples. A LDPE ( 6mm i.d., 1cc volume) vial was the sample holder. TA was done at 3GHz , and PA was done at 1064nm wavelength.
Figure 3a displays the TA signals from an LDPE vial filled with DI water and another vial filled with SWNTs. The peak-to-peak TA signal amplitudes generated by DI water and SWNTs are and , respectively. Figure 3b shows the peak-to-peak TA signal amplitude and fractional increase in TA signal versus the concentration of SWNTs. The largest standard deviation of the data points, measuring , was observed at concentration SWNTs. The data show an approximately linear relationship between the TA signal amplitude and the SWNTs’ concentration. We observe a maximum of 140% increase in the peak-to-peak signal amplitude for SWNTs over DI water. Figure 3c displays the PA signals from LDPE vial filled with blood and with SWNTs. The peak-to-peak PA signal amplitudes generated by blood, and the SWNTs are and , respectively. Figure 3d shows the peak-to-peak PA signal amplitude and fractional increase in PA signal versus the concentration of SWNTs. The largest standard deviation of the data points, measuring , was again observed at concentration SWNTs. The data again show an approximately linear relationship between the PA signal amplitude and the SWNTs’ concentration. We observe a maximum 490% increase in the peak-to-peak signal for SWNTs over blood. In vitro tests were carried out with SWNTs mixed with blood in different proportions, and then PA signals were recorded. Keeping in mind that in other applications NIR light would be used for in vivo deep tissue imaging, the light used here was of wavelength in the reflection mode PA imaging system.31 A tube (Silastic® laboratory tubing, Dow Corning Corp., with , i.d. o.d.) was filled with blood, blood (10% v/v), blood (25% v/v), blood (50% v/v), blood (75% v/v), and SWNTs alone. Figure 3e shows the peak-to-peak PA signal amplitudes for those six samples, clearly indicating that the PA signal from blood was enhanced when SWNTs were mixed with the blood. The experiments were carried out 10 times to get the average and the standard deviation. We observed a PA signal of from a mixture of 75% SWNTs and 25% blood, compared to a PA signal from only blood. Therefore, when SWNTs were mixed with the blood, we saw a increase in the PA signal at wavelength. Fig. 3(a) TA signals at from a LDPE vial (i.d. , volume ) filled with DI water and SWNTs. (b) Peak-to-peak TA signal amplitude and fractional increase in TA signal versus SWNTs concentration. (c) PA signals at wavelength from a LDPE vial filled with rat blood and SWNTs. (d) Peak-to-peak PA signal amplitude and fractional increase in PA signal versus SWNTs concentration. (e) Peak-to-peak PA signal amplitudes from blood mixed with various amounts of SWNTs. 1: Blood only, 2: blood (10% v/v), 3: blood (25% v/v), 4: blood (50% v/v), 5: blood (75% v/v), and 6: SWNTs alone. The light source was of wavelength. A tube (Silastic laboratory tubing, Dow Corning Corp., with i.d., o.d.) was used to hold the sample. (Color online only.)  Next, LDPE vials filled with different SWNTs samples were imaged in two dimensions using TAT and PAT. Figures 4a and 4b show the TAT cross-sectional image of a vial filled with DI water and SWNTs, respectively, clearly demonstrating a substantial improvement in the TA signal for the vial filled with SWNTs (both figures are shown in the same range of the color bar). Figures 4c and 4d compare the image profiles along the horizontal and vertical lines [dotted lines in Figs. 4a and 4b], respectively. Compared to DI water, SWNTs showed times and times signal improvements in the TA image along the horizontal and vertical lines, respectively (normalized to DI water). These results are consistent with the TA data presented in Fig. 3. Figures 4e and 4f show cross-sectional PAT images of the vial filled with blood and SWNTs, respectively, showing an increased signal in the PAT images with SWNTs compared to blood (both figures are shown in the same range of the color bar). Figures 4g and 4h compare the image profiles along the horizontal and vertical lines [along the dotted lines in Figs. 4e and 4f], respectively. Compared to blood, SWNTs showed a -fold signal improvement along the horizontal line and -fold signal improvement along the vertical line (normalized to blood). These results are consistent with the PA data presented in Fig. 3. The variation in the signal improvement along the horizontal and vertical directions for both TAT and PAT is possibly due to the anisotropic spatial resolution. Fig. 4(a) Cross-sectional TAT image of the vial (LDPE, i.d., volume) containing DI water. (b) Cross-sectional TAT image of the vial containing SWNTs. (c) Comparison of the signal profiles along the horizontal lines across the centers of the vials in (a) and (b). (d) Comparison of the signal profiles along the vertical lines across the centers of the vials in (a) and (b). (e) Cross-sectional PAT image of the vial containing blood. (f) Cross-sectional PAT image of the vial containing SWNTs. (g) Comparison of the signal profiles along the horizontal lines across the centers of the vials in (e) and (f). (h) Comparison of the signal profiles along the vertical lines across the centers of the vials in (e) and (f). (i) Cross-sectional TAT image of the vial containing DI water inside pork fat tissue. (j) Cross-sectional TAT image of the vial containing SWNTs inside pork fat tissue. The solid arrow points to the needle used to hold the fat tissue, and the dashed arrow indicates the boundary of the fat tissue. (k) Cross-sectional PAT image of the blood vial inside pork fat tissue. (l) Cross-sectional PAT image of the SWNTs vial inside pork fat tissue. (Color online only.) 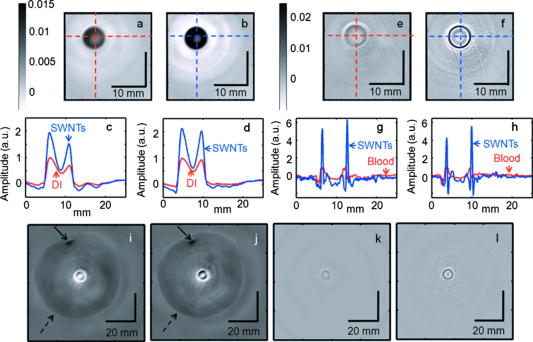 Figures 4i and 4j show the reconstructed tissue-mimicking phantom TAT images for DI water and SWNTs, respectively. The dark spot on the image, marked with a solid arrow, is a needle used to hold the tissue sample. The boundary of the fat tissue is marked with a dashed arrow. The images clearly show greater contrast for the SWNTs-filled vial than for the DI-water-filled vial. Figures 4k and 4l show PAT images with blood and SWNTs, respectively, for the tissue phantom. The results are similar to those obtained by TAT imaging: the SWNT sample displays greater contrast than blood. The main motivation in this study was to show that SWNTs can themselves generate both TA and PA signals. Toward this end, as discussed above, a nonionic, nearly neutral SWNT solution was used for the phantom imaging because, in the future, in vivo imaging studies will be carried out by injecting SWNTs in solution (most probably in a buffer solution with water as its main component) instead of solid SWNT powder. Our results show that SWNTs could be used for TA/PA imaging, because the intrinsic absorption properties of SWNTs are able to produce equivalent or stronger (depending on the SWNTs concentrations) TA/PA signals than a known endogenous absorber (more than water in the case of TAT and more than blood in the case of PAT). Additionally, a substantial enhancement in the PA signal was measured in vitro when the SWNTs were mixed with blood. Thus, we conclude that when the SWNT solution is mixed with water/blood, it enhances the total TA/PA signal from the water/blood. Furthermore, TA/PA signals generated by SWNTs could be used for imaging applications where there are no endogenous signals. For example, using PA imaging and SWNTs, we have carried out in vivo sentinel lymph-node mapping noninvasively.36 In this application, there was no blood signal involved and the PA signals generated by the SWNTs were used for imaging the sentinel lymph nodes. Another example is a targeted molecular imaging application, where the TA/PA signal would be generated from the contrast agents themselves. As shown in previous studies,37 the optical absorption properties of SWNTs are strong in the visible and NIR region. Currently, no studies have demonstrated SWNTs’ absorption property in the microwave region, but their conductive properties make them promising for strong absorption.38 SWNTs have high permittivity when exposed to electromagnetic radiation at frequencies between 0.5 and , and as the frequency increases to , the permittivity decreases,39, 40 indicating that SWNTs could be used as contrast agents at . Another study showed the feasibility of iron oxide nanoparticles as a contrast agent in TAT.41 To the best of our knowledge, this is the first study that explores the efficacy of SWNTs as contrast agents for multimodal imaging with TAT/PAT. This study successfully demonstrates that SWNTs are suitable as a contrast agent for both TAT and PAT. The SWNTs also allow contrast-enhanced deep-tissue imaging with TAT. In this study, for TAT, we observed contrast enhancement due to the SWNTs at an rf frequency of . It will be particularly interesting to characterize their effectiveness at lower rf frequencies. It is well known that the human body becomes more transparent at lower rf frequencies, allowing an increase in the imaging depth. However, because of lower tissue absorbance at lower rf frequencies, the intrinsic image contrast suffers. Therefore, if the SWNTs work as a contrast agent at lower rf frequencies, we can potentially achieve low-background, high-sensitivity, deep-tissue imaging. The broad absorption range of SWNTs in the visible/NIR region37 is also beneficial for optical imaging because one can use a wide range of laser wavelengths for imaging without the need to tune the contrast agent to a particular wavelength to optimize light absorption. In comparison, other contrast agents suitable for PAT, such as gold nanoparticles, are tuned to a particular wavelength range and can be used only with light within that range.17, 42 Furthermore, our results suggest that a minimum detectable concentration of SWNTs should be comparable to that of gold nanoparticles.42 Using previously derived equations,43 we have calculated that carbon nanotubes of average diameter and average length have carbon atoms, giving an average molecular weight of Da or g/mol (multiply the number of carbon atoms by 12, the atomic weight of carbon). From Fig. 3, it is clear that the minimum detectable concentration is or , SWNTs concentration, allowing their detection in the nM range. It is also evident that even at SWNTs concentration, there is a 35% increase in peak-to-peak TA signal compared to DI water and a 32% increase in peak-to-peak PA signal compared to blood. For targeted molecular imaging applications, an important consideration is not only the enhancement, but also the signal generated by the SWNTs themselves. In this study, we have detected signals with very high signal-to-noise ratio ( in both TA and PA) at SWNT concentration, suggesting that the minimum detectable SWNT concentration could be as low as or with this system, making them suitable for in vivo applications in various tissues. In general, the minimum detectable concentration of an exogenous contrast agent by PAT/TAT is dependent on many factors, such as incident light/microwave energy, ultrasound detector sensitivity, data acquisition electronics, etc. For our future in vivo studies, the concentration(s) of the SWNTs will depend on the specific application and the sensitivity of the imaging system.36, 44 The SWNTs also have a number of additional benefits. (i) Other than TAT and PAT, SWNTs can also be used as a contrast agent for other imaging modalities, such as MRI, PET, NIR optical imaging, and nuclear imaging.22, 23, 24, 25 Therefore, in a true sense they can work as a multi-modal contrast agent. (ii) The external carbon sheath of the SWNTs can be directly functionalized for targeting and drug delivery. This capability is not possible for other optical contrast agents, such as gold nanoparticles, where one does not functionalize the gold, but rather the capping agents or the biocompatible coating used to stabilize and/or dispense gold nanoparticles in solution. (iii) SWNTs now offer the exciting and tantalizing prospect of achieving TAT and/or PAT molecular imaging and simultaneous therapy by NIR and rf-induced hyperthermia. Recently, SWNTs have been shown to facilitate the NIR and rf-induced ablation of tumor cells/tissues.25, 45 Thus, these unique features of SWNTs should allow the design of multimodal imaging and multitherapeutic approaches within a single platform. 4.ConclusionsIn summary, we have successfully shown that SWNTs provide more than twofold signal enhancement in TAT at and more than sixfold signal enhancement in PAT at . These results indicate that by using SWNTs as contrast agents, the functional information from TAT and PAT together with other structural imaging modalities will be advantageous for early cancer diagnosis. At lower rfs, these exogenous contrast agents offer a new paradigm for low-background, high-sensitivity, deep-tissue, and targeted molecular imaging by TAT. AcknowledgmentsThis work was sponsored by National Institutes of Health Grants No. R01 EB000712, No. R01 NS46214 (Bioengineering Research Partnerships), No. R01 EB008085, and No. U54 CA136398 (Network for Translational Research) (L.V.) and the Office of the Vice President of Research at Stony Brook University, Carol M. Baldwin fund (S.B.). L.W. has a financial interest in Endra, Inc., which, however, did not support this work. The authors thank Dr. Oleg Gang and Dr. Huming Xiong at the Center for Functional Nanomaterials, Brookhaven National Laboratory for access to the AFM, Tom Salagaj and Christopher Jensen at FirstNano/CVD Equipment Corporation for access to their CVD facilities, and Dr. Eunah Lee at Horiba JvonYvon, Edison, New Jersey, for the Raman spectroscopy measurements. ReferencesL. Ottobrini, P. Ciana, A. Biserni, G. Lucignani, and A. Maggi,
“Molecular imaging: a new way to study molecular processes in vivo,”
Mol. Cell Endocrinol., 246
(1–2), 69
–75
(2006). https://doi.org/10.1016/j.mce.2005.11.013 0303-7207 Google Scholar
V. Ntziachristos, J. Ripoll, L. H. V. Wang, and R. Weissleder,
“Looking and listening to light: the evolution of whole-body photonic imaging,”
Nat. Biotechnol., 23
(3), 313
–320
(2005). https://doi.org/10.1038/nbt1074 1087-0156 Google Scholar
S. R. Meikle, P. Kench, M. Kassiou, and R. B. Banati,
“Small animal SPECT and its place in the matrix of molecular imaging technologies,”
Phys. Med. Biol., 50
(22), R45
–R61
(2005). https://doi.org/10.1088/0031-9155/50/22/R01 0031-9155 Google Scholar
J. V. Frangioni,
“In vivo near-infrared fluorescence imaging,”
Curr. Opin. Chem. Biol., 7
(5), 626
–634
(2003). https://doi.org/10.1016/j.cbpa.2003.08.007 1367-5931 Google Scholar
W. Krause, Contrast Agents II: Optical, Ultrasound, X-Ray Imaging and Radiopharmaceutical Imaging, Springer, New York
(2002). Google Scholar
E. L. Ritman,
“Molecular imaging in small animals—roles for micro-CT,”
J. Cell. Biochem., 39 116
–124
(2002). https://doi.org/10.1002/jcb.10415 0730-2312 Google Scholar
L. H. V. Wang, X. M. Zhao, H. T. Sun, and G. Ku,
“Microwave-induced acoustic imaging of biological tissues,”
Rev. Sci. Instrum., 70
(9), 3744
–3748
(1999). https://doi.org/10.1063/1.1149986 0034-6748 Google Scholar
G. Ku, B. D. Fornage, X. Jin, M. H. Xu, K. K. Hunt, and L. H. V. Wang,
“Thermoacoustic and photoacoustic tomography of thick biological tissues toward breast imaging,”
Technol. Cancer Res. Treat., 4
(5), 559
–565
(2005). 1533-0346 Google Scholar
X. D. Wang, Y. J. Pang, G. Ku, X. Y. Xie, G. Stoica, and L. H. V. Wang,
“Noninvasive laser-induced photoacoustic tomography for structural and functional in vivo imaging of the brain,”
Nat. Biotechnol., 21
(7), 803
–806
(2003). https://doi.org/10.1038/nbt839 1087-0156 Google Scholar
G. Ku, X. D. Wang, X. Y. Xie, G. Stoica, and L. H. V. Wang,
“Imaging of tumor angiogenesis in rat brains in vivo by photoacoustic tomography,”
Appl. Opt., 44
(5), 770
–775
(2005). https://doi.org/10.1364/AO.44.000770 0003-6935 Google Scholar
M. L. Li, J. T. Oh, X. Y. Xie, G. Ku, W. Wang, C. Li, G. Lungu, G. Stoica, and L. H. V. Wang,
“Simultaneous molecular and hypoxia imaging of brain tumors in vivo using spectroscopic photoacoustic tomography,”
Proc. IEEE, 96
(3), 481
–489
(2008). https://doi.org/10.1109/JPROC.2007.913515 0018-9219 Google Scholar
M. Pramanik, G. Ku, C. H. Li, and L. H. V. Wang,
“Design and evaluation of a novel breast cancer detection system combining both thermoacoustic (TA) and photoacoustic (PA) tomography,”
Med. Phys., 35
(6), 2218
–2223
(2008). https://doi.org/10.1118/1.2911157 0094-2405 Google Scholar
R. A. Kruger, K. D. Miller, H. E. Reynolds, W. L. Kiser, D. R. Reinecke, and G. A. Kruger,
“Breast cancer in vivo: contrast enhancement with thermoacoustic CT at —Feasibility study,”
Radiology, 216
(1), 279
–283
(2000). 0033-8419 Google Scholar
R. A. Kruger, D. R. Reinecke, and G. A. Kruger,
“Thermoacoustic computed tomography-technical considerations,”
Med. Phys., 26
(9), 1832
–1837
(1999). https://doi.org/10.1118/1.598688 0094-2405 Google Scholar
A. A. Oraevsky, E. V. Savateeva, S. V. Solomatin, A. A. Karabutov, V. G. Andreev, Z. Gatalica, T. Khamapirad, and P. M. Henrichs,
“Optoacoustic imaging of blood for visualization and diagnostics of breast cancer,”
Proc. SPIE, 4618 81
–94
(2002). https://doi.org/10.1117/12.469851 0277-786X Google Scholar
M. H. Xu and L. H. V. Wang,
“Photoacoustic imaging in biomedicine,”
Rev. Sci. Instrum., 77
(4), 041101
(2006). https://doi.org/10.1063/1.2195024 0034-6748 Google Scholar
Y. W. Wang, X. Y. Xie, X. D. Wang, G. Ku, K. L. Gill, D. P. O’Neal, G. Stoica, and L. H. V. Wang,
“Photoacoustic tomography of a nanoshell contrast agent in the in vivo rat brain,”
Nano Lett., 4
(9), 1689
–1692
(2004). https://doi.org/10.1021/nl049126a 1530-6984 Google Scholar
X. D. Wang, X. Y. Xie, G. N. Ku, and L. H. V. Wang,
“Noninvasive imaging of hemoglobin concentration and oxygenation in the rat brain using high-resolution photoacoustic tomography,”
J. Biomed. Opt., 11
(2), 024015
(2006). https://doi.org/10.1117/1.2192804 1083-3668 Google Scholar
G. F. Lungu, M. L. Li, X. Y. Xie, L. H. V. Wang, and G. Stoica,
“In vivo imaging and characterization of hypoxia-induced neovascularization and tumor invasion,”
Int. J. Oncol., 30
(1), 45
–54
(2007). 1019-6439 Google Scholar
B. P. Schneider and K. D. Miller,
“Angiogenesis of breast cancer,”
J. Clin. Oncol., 23
(8), 1782
–1790
(2005). https://doi.org/10.1200/JCO.2005.12.017 0732-183X Google Scholar
P. Vaupel, A. Mayer, S. Briest, and M. Hockel,
“Hypoxia in breast cancer: role of blood flow, oxygen diffusion distances, and anemia in the development of oxygen depletion,”
Oxygen Transport to Tissue XXVI, 566 333
–342 2005). Google Scholar
B. Sitharaman, K. R. Kissell, K. B. Hartman, L. A. Tran, A. Baikalov, I. Rusakova, Y. Sun, H. A. Khant, S. J. Ludtke, W. Chiu, S. Laus, E. Toth, L. Helm, A. E. Merbach, and L. J. Wilson,
“Superparamagnetic gadonanotubes are high-performance MRI contrast agents,”
Chem. Commun. (Cambridge), 31 3915
–3917
(2005). https://doi.org/10.1039/b504435a 1359-7345 Google Scholar
M. R. McDevitt, D. Chattopadhyay, B. J. Kappel, J. S. Jaggi, S. R. Schiffman, C. Antczak, J. T. Njardarson, R. Brentjens, and D. A. Scheinberg,
“Tumor targeting with antibody-functionalized, radiolabeled carbon nanotubes,”
J. Nucl. Med., 48
(7), 1180
–1189
(2007). https://doi.org/10.2967/jnumed.106.039131 0161-5505 Google Scholar
Z. Liu, W. B. Cai, L. N. He, N. Nakayama, K. Chen, X. M. Sun, X. Y. Chen, and H. J. Dai,
“In vivo biodistribution and highly efficient tumour targeting of carbon nanotubes in mice,”
Nat. Nanotechnol., 2
(1), 47
–52
(2007). https://doi.org/10.1038/nnano.2006.170 1748-3387 Google Scholar
P. Cherukuri, C. J. Gannon, T. K. Leeuw, H. K. Schmidt, R. E. Smalley, S. A. Curley, and R. B. Weisman,
“Mammalian pharmacokinetics of carbon nanotubes using intrinsic near-infrared fluorescence,”
Proc. Natl. Acad. Sci. U.S.A., 103
(50), 18882
–18886
(2006). https://doi.org/10.1073/pnas.0609265103 0027-8424 Google Scholar
M. E. Hughes, E. Brandin, and J. A. Golovchenko,
“Optical absorption of DNA-carbon nanotube structures,”
Nano Lett., 7
(5), 1191
–1194
(2007). https://doi.org/10.1021/nl062906u 1530-6984 Google Scholar
S. Berciaud, L. Cognet, P. Poulin, R. B. Weisman, and B. Lounis,
“Absorption spectroscopy of individual single-walled carbon nanotubes,”
Nano Lett., 7
(5), 1203
–1207
(2007). https://doi.org/10.1021/nl062933k 1530-6984 Google Scholar
C. J. Gannon, P. Cherukuri, B. I. Yakobson, L. Cognet, J. S. Kanzius, C. Kittrell, R. B. Weisman, M. Pasquali, H. K. Schmidt, R. E. Smalley, and S. A. Curley,
“Carbon nanotube-enhanced thermal destruction of cancer cells in a noninvasive radiofrequency field,”
Cancer, 110
(12), 2654
–2665
(2007). https://doi.org/10.1002/cncr.23155 0008-543X Google Scholar
IEEE standard for safety levels with respect to human exposure to radio frequency electromagnetic fields
(1999) Google Scholar
,
(2000) Google Scholar
K. H. Song and L. H. V. Wang,
“Deep reflection-mode photoacoustic imaging of biological tissue,”
J. Biomed. Opt., 12
(6), 060503
(2007). https://doi.org/10.1117/1.2818045 1083-3668 Google Scholar
Q. Fu, S. M. Huang, and J. Liu,
“Chemical vapor depositions of single-walled carbon nanotubes catalyzed by uniform Fe2O3 nanoclusters synthesized using diblock copolymer micelles,”
J. Phys. Chem. B, 108
(20), 6124
–6129
(2004). https://doi.org/10.1021/jp049483+ 1089-5647 Google Scholar
M. S. Dresselhaus, G. Dresselhaus, R. Saito, and A. Jorio,
“Raman spectroscopy of carbon nanotubes,”
Phys. Rep., 409
(2), 47
–99
(2005). https://doi.org/10.1016/j.physrep.2004.10.006 0370-1573 Google Scholar
B. White, S. Banerjee, S. O’Brien, N. J. Turro, and I. P. Herman,
“Zeta-potential measurements of surfactant-wrapped individual single-walled carbon nanotubes,”
J. Phys. Chem. C, 111
(37), 13684
–13690
(2007). https://doi.org/10.1021/jp070853e 1932-7447 Google Scholar
S. S. Chaudhary, R. K. Mishra, A. Swarup, and J. M. Thomas,
“Dielectric-properties of normal and malignant human-breast tissues at radiowave and microwave-frequencies,”
Indian J. Biochem. Biophys., 21
(1), 76
–79
(1984). 0301-1208 Google Scholar
M. Pramanik, K. H. Song, M. Swierczewska, D. Green, B. Sitharaman, and L. H. V. Wang,
“In vivo carbon nanotube-enhanced non-invasive photoacoustic mapping of the sentinel lymph node,”
Phys. Med. Biol., 54
(11), 3291
–3301
(1984). https://doi.org/10.1088/0031-9155/54/11/001 0031-9155 Google Scholar
M. J. O’Connell, S. M. Bachilo, C. B. Huffman, V. C. Moore, M. S. Strano, E. H. Haroz, K. L. Rialon, P. J. Boul, W. H. Noon, C. Kittrell, J. P. Ma, R. H. Hauge, R. B. Weisman, and R. E. Smalley,
“Band gap fluorescence from individual single-walled carbon nanotubes,”
Science, 297
(5581), 593
–596
(2002). https://doi.org/10.1126/science.1072631 0036-8075 Google Scholar
A. Saib, L. Bednarz, R. Daussin, C. Bailly, X. Lou, J. M. Thomassin, C. Pagnoulle, C. Detrembleur, R. Jerome, and I. Huynen,
“Carbon nanotube composites for broadband microwave absorbing materials,”
IEEE Trans. Microwave Theory Tech., 54
(6), 2745
–2754
(2006). https://doi.org/10.1109/TMTT.2006.874889 0018-9480 Google Scholar
C. A. Grimes, C. Mungle, D. Kouzoudis, S. Fang, and P. C. Eklund,
“The complex permittivity spectra of single-wall carbon nanotube-loaded polymer composites,”
Chem. Phys. Lett., 319
(5–6), 460
–464
(2000). https://doi.org/10.1016/S0009-2614(00)00196-2 0009-2614 Google Scholar
P. C. P. Watts, W. K. Hsu, A. Barnes, and B. Chambers,
“High permittivity from defective multiwalled carbon nanotubes in the X-band,”
Adv. Mater., 15
(7–8), 600
–603
(2003). https://doi.org/10.1002/adma.200304485 0935-9648 Google Scholar
X. Jin, A. Keho, K. Meissner, and L. H. V. Wang,
“Iron-oxide nanoparticles as a contrast agent in thermoacoustic tomography,”
Proc. SPIE, 6437 64370E
(2007). https://doi.org/10.1117/12.698329 0277-786X Google Scholar
M. Eghtedari, A. Oraevsky, J. A. Copland, N. A. Kotov, A. Conjusteau, and M. Motamedi,
“High sensitivity of in vivo detection of gold nanorods using a laser optoacoustic imaging system,”
Nano Lett., 7
(7), 1914
–1918
(2007). https://doi.org/10.1021/nl070557d 1530-6984 Google Scholar
K. Yamamoto, T. Kamimura, and K. Matsumoto,
“Nitrogen doping of single-walled carbon nanotube by using mass-separated low-energy ion beams,”
Jpn. J. Appl. Phys., 44
(4A), 1611
–1614
(2005). https://doi.org/10.1143/JJAP.44.1611 0021-4922 Google Scholar
A. De La Zerda, C. Zavaleta, S. Keren, S. Vaithilingam, S. Bodapati, Z. Liu, J. Levi, B. R. Smith, T. J. Ma, O. Oralkan, Z. Cheng, X. Y. Chen, H. J. Dai, B. T. Khuri-Yakub, and S. S. Gambhir,
“Carbon nanotubes as photoacoustic molecular imaging agents in living mice,”
Nat. Nanotechnol., 3
(9), 557
–562
(2008). https://doi.org/10.1038/nnano.2008.231 1748-3387 Google Scholar
N. W. S. Kam, M. O’Connell, J. A. Wisdom, and H. J. Dai,
“Carbon nanotubes as multifunctional biological transporters and near-infrared agents for selective cancer cell destruction,”
Proc. Natl. Acad. Sci. U.S.A., 102
(33), 11600
–11605
(2005). https://doi.org/10.1073/pnas.0502680102 0027-8424 Google Scholar
|
||||||||||||||||||||||||||||||||||||||||||||||||||||||


