|
|
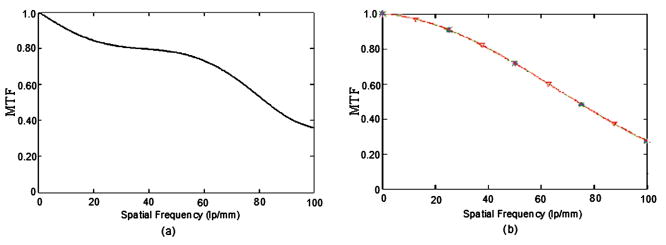
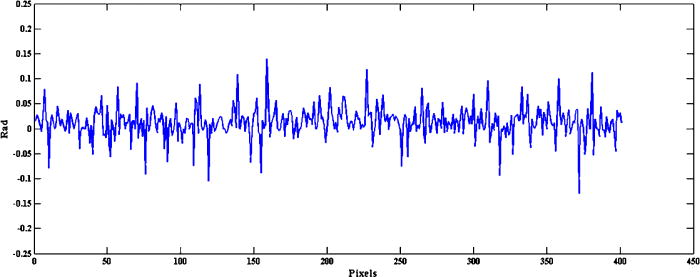
1.IntroductionThe tympanic membrane (TM) is the most peripheral structure in the middle ear and is the first ear structure set in motion by airborne sound. Motion of the TM is transduced by the middle ear system into sound in the cochlear fluids, which then excites the cochlear partition in the inner ear. While measurements of TM motion are not direct measures of hearing sensitivity (which also depends on the function of the inner ear), a TM altered by trauma or middle-ear disease will reduce the acoustic-mechanical input to the inner ear, thereby causing a “conductive” hearing loss. An approach to determine the degree of such a loss in sound conduction to the inner ear measures the deformation of the TM with various acoustic stimuli. Most present-day middle-ear diagnostic procedures are based on acoustic measurements that sense the mobility of the entire TM, e.g., multi- or single-frequency tympanometry,1, 2 ear-canal reflectance or power absorption,3, 4, 5 and static pressure-induced variations in sound pressure.6 Single-point laser vibrometry measurements of the mobility of the umbo in the TM have also been used as diagnostic aids in clinical settings.7, 8 All of these clinical measurements have weaknesses. The acoustic measurements depend on the sound pressure at the TM and represent the average mobility of the entire TM. The single-point laser vibrometry measurements are much more localized, which may have a superior ability to distinguish ossicular disorders9 but are relatively insensitive to TM disorders at locations other than the umbo. Full field-of-view (FOV) measurements of TM mobility may be superior to either of the present techniques because they quantify the function along the entire TM surface. We are investigating optoelectronic holography in this regard, since it has been successfully used in many applications and environments.10 Holographic methodologies have been used in the past to enable full-FOV measurements of the vibrating patterns of the TM surface. Time-averaged holographic interferometry has been used to study TM vibrations in both laboratory animals and in human cadavers.11, 12 Løkberg used electronic speckle pattern interferometry (ESPI) to measure vibrations of the human TM in vivo.13 Wada discussed complicated vibration patterns of the TM in cadaveric guinea pigs at frequencies up to , which they measured using time-averaged speckle patterns.14 The shape and displacement patterns of the cat TM in both the normal mobile malleus and the immobile malleus have been measured by Moiré holography.15 Spectroscopy and ESPI studies using endoscopes have been used to diagnose otitis media of TMs and medical diagnostic in biological objects respectively.16, 17 Aside from this research work, different models have been proposed for the assessment, mechanical characterization, and dynamic behavior of TMs.18, 19, 20, 21, 22, 23, 24, 25 Though holography has proven to be useful in the investigation of TM mechanics, its application generally has been limited to laboratory studies. In this paper, we describe our advances in the design, fabrication, characterization, and use of a compact, stable, flexible optoelectronic holographic otoscope (OEHO) system. A prototype system is currently used in a medical research environment. This system can provide full-FOV measurements of sound-driven displacements of the TM surface at video rates. 2.OEHO SystemFigure 1 shows the OEHO system currently in development for full-FOV measurement of nanometer-scale displacements of TMs excited by sound in live human ears. Our developments are based on optoelectronic methodologies that make use of miniaturized components in an otoscope-like configuration. The system consists of a high-speed image-processing (IP) computer with advanced control software, a fiber optic subsystem (FS), and an otoscope head (OH) subsystem. Integrated into the otoscope head is a sound source (SS) and a compact microphone (CM) to generate and measure sound stimuli under control of the IP. Fig. 1Schematics of the OEHO system. TM is the sample under investigation. The OH contains an interferometer and imaging optics; the FS contains a laser, beamsplitting optics, and laser-to-fiber components to provide the OB and RB that are conveyed by the optical fibers (OF) to the OH. Both the OH and FS are controlled by the IP. SS and CM are the integrated sound source and microphone, respectively.  The OEHO system is capable of operating in time-averaged and stroboscopic modes. The time-averaged mode is used for rapid, real-time identification of resonant frequencies of the vibrating samples and their corresponding mode shapes.26, 27 The stroboscopic mode is used to quantify the magnitude and phase of the TM’s entire surface at a nanometer scale.28, 29 Both operating modes require the collection of four optically phase-stepped interference images to calculate the reconstructed holographic image.30 A more detailed schematic of the OEHO and acoustic system is shown in Fig. 2 . The laser beam is provided by a solid-state laser diode (LD) with an operational wavelength of and power of . The laser output is directed through an acousto-optic modulator (AOM), then through the beamsplitter (BS), which splits the light into a reference beam (RB) and an object illumination beam (OB) with an 80:20 power ratio. The OB is directed to a mirror (M), which redirects the beam to its laser-to-fiber coupler assemblies (FA). The RB is directed to its laser-to-fiber coupler via a mirror mounted on the piezoelectric modulator (MP), which generates the four steps in the optical phase that are required for holographic reconstruction. These steps are achieved by varying the RB’s optical path length by moving the MP at fractions of the laser wavelength. Both beams are coupled into single-mode fibers using laser-to-fiber coupler assemblies. The frequency generator (FG), operated by the IP, supplies the electrical input to the sound source by a digital-to-analog converter, and uses an analog-to-digital converter to measure the signal produced by a microphone near the surface of the TM; in stroboscopic mode, it also provides the timing input to the acousto-optic modulator driver (DD). Activation of the acousto-optic modulator driver by short electrical trigger pulses that are phase-locked to the acoustic stimulus driver results in short stroboscopic pulses ( of the acoustic stimulus period) of laser light during varied phases of the acoustic stimulus. Fig. 4Optical head subsystem: (a) schematic depicting the major components; and (b) built subsystem. 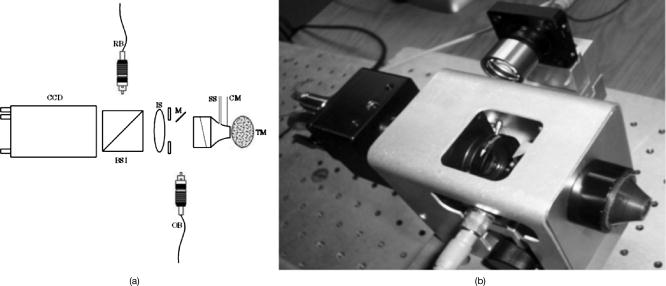 The design of the optomechanical system was carried out with commercially available software31 taking into account the TM anatomy and the results of preliminary holographic measurements of TM displacements in several animal species.32 The design of the OH fulfilled several requirements. First, we needed a 10 by FOV (the human TM diameter is around 8 to ). Then the image of the TM needed to cover the entire region of interest (ROI) of the CCD sensor with a pixel size of ; the choice of FOV and imaging ROI defined the optical magnification (Mx) of 0.5X. We selected a working distance (WD) because of constraints on the size of the sound source, microphone, and beamsplitter. The focal length was calculated from the WD and Mx to be . An aperture was incorporated into the design to increase the depth of field (DOF) to about , which was needed to keep the whole TM, with its 3-D shape and orientation in the ear canal, in focus. The imaging performance was evaluated through the modulation transfer function (MTF) using a U.S. Air Force (USAF) target.33 Figure 3a shows the MTF obtained experimentally by measuring the contrast in the image of the bar target for various spatial frequencies, and Fig. 3b shows the theoretical MTF determined by Oslo software. The resolution of the imaging optics was also evaluated by the USAF test target, resulting in and a fringe visibility of 0.82, which was obtained with a beam ratio of 1.2.34 Figure 4a shows details of the OH subsystem. The output of the OB is used to illuminate the sample of interest while the imaging system (IS) collects the scattered wavefronts from the reflected OB at the TM sample surface. The image collected by the IS is combined with the RB by means of the imaging beamsplitter (BSI) and then directed onto the CCD camera detector. The IS includes an achromatic lens and an aperture. The aperture controls both the light entering the imaging system and the depth of field. The object illumination beam is directed at the test object via a speculum. The speculum is coupled to a SS for sample excitation and a CM to monitor the stimulus sound pressure at the TM. An angled glass window at the back of the speculum isolates the sound stimulus within the speculum, allowing larger stimulus sound pressures at lower stimulus frequencies. The SS is driven by a computer-controlled frequency generator, and the microphone output is monitored by an analog-to-digital converter controlled by the computer system. Figure 4b is a photograph of an OH prototype with dimensions of . 2.1.Control Software and Principle of MeasurementSpecialized software is necessary for image acquisition, control of the optoelectronic devices in the FS and OH, processing of the acquired images, and display of the processed images. The controlling software interfaces with cameras that have digital dynamic ranges and spatial resolutions of and , respectively, with the capability of acquiring and processing images at rates as fast as 40 frames per second. Optical phase-measurements based on phase-stepping algorithms are implemented in this software.35 The CCD camera acquires four successive interference images in which the optical path length (or optical phase) of the RB is stepped by zero to three-quarters wavelength. If the frame integration period of the camera is much longer than the period of the object vibration, the intensity may be expressed as where and refer to the spatial coordinates of the pixels making up the camera image, is the object beam intensity, is the reference beam intensity, represents the random phase between the reference beam and the object beam produced by the beam’s interaction with the measurement, is the zero-order Bessel function, is the out-of-plane vibration displacement of the object,36 is the modulation intensity , and is the wavelength of the laser light.In the time-averaged mode, the four phase-stepped data frames are used to calculate and display the modulation intensity : The stroboscopic mode consists of acquiring and processing two sets, to and to , of phase-stepped images, which are recorded at acoustic stimulus phase and acoustic stimulus phase , respectively. The resultant modulation intensity at each camera pixel is calculated as The phase difference in the stroboscopic mode is calculated between acoustic stimulus and . It is given as where is the maximum grayscale value, equivalent to , and is the bit depth of the camera. The arguments are omitted for simplification.To acquire a phase-stepped image, the IP uses a data acquisition board to put out a varying analog voltage that is synchronized with each frame captured by the camera. The output voltage is amplified to drive the MP for laser light modulation, and hence, to accurately perform the required phase step. To maximize the image acquisition speed, processing, and display, separate tasks are run in individual threads using shared memory to communicate among each other. The image acquisition thread captures successive images at the maximum rate allowed by the camera and computer while storing the images in a circular queue. A record is kept of the index of the most recently captured image. Meanwhile, the display thread uses the four most recently captured images to compose the processed image to be displayed. 3.Evaluation of the OEHO System and Experimental ResultsTo evaluate and demonstrate the capabilities of the OEHO system, we carried out a modal analysis of a circular aluminum membrane having a thickness and a diameter. The membrane was fabricated by removing a cylinder of material from an aluminum block with dimensions 76.30 by 79.7 by . The manufactured block with the membrane was mounted on a piezoelectric shaker for excitation. The relative motion of the membrane was investigated with the OH subsystem set at the designed magnification of 0.5X, a FOV, and a ROI. To maximize fringe visibility, the beam ratio between the RB and OB was chosen to be . With the OEHO system running in the time-averaged mode and the membrane excited in the range, fundamental natural resonant frequencies were identified. Figure 5 shows the first four resonant vibration modes of the aluminum membrane. An analysis of the interferograms indicated a fringe visibility of 0.82, which is suitable for quantitative analysis. Fig. 5OEHO time-averaged interferograms of a circular aluminum test sample vibrating at its first four fundamental resonant vibration modes: (a) ; (b) ; (c) ; and (d) . 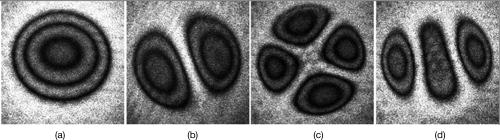 The stroboscopic mode was used for quantitative displacement measurements. Optoelectronic holograms were acquired from the sample frozen at any point during its vibrating cycle by illuminating the object with short stroboscopic pulses synchronized with the vibration excitation. These images were then processed using the four optical phase-stepping technique to render phase maps depicting the sample displacement [Eq. 4]. Figure 6 shows the resulting phase maps and displacement patterns computed by the quantitative analysis of the stroboscopic measurements for the same aluminum membrane; the frequency was selected for demonstration. The two stroboscopic images were gathered at stimulus phases and to generate negative and positive displacements, respectively, on the aluminum membrane. Fig. 6(a) Wrapped phase map. (b) Unwrapped phase map. (c) Peak-to-peak surface out-of-plane displacement, . 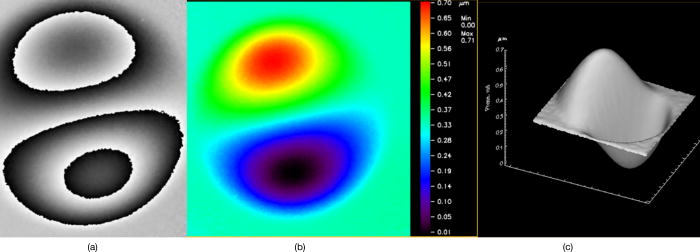 We also computed the optical phase between two images gathered without stimulation in order to estimate the noise in the measurement procedure. Figure 7 shows the difference in the results; the fluctuation due to the noise has a peak-to-peak value of . 4.OEHO System in a Medical Research EnvironmentThe OEHO system described above was used to investigate the sound-induced motion of the TM in cadaveric chinchillas and humans, as well as in live chinchillas. Time-averaged holograms measured with sound stimuli of 400 to and at varied levels of sound are shown in Fig. 8 . The OEHO system had a high mechanical stability while providing high-quality images. One point of ready comparison is the similarity between the results in the live and cadaveric chinchillas. All of the measurement features observed in the live chinchilla ear were also observed in the cadaveric ear. Such a similarity between pre- and post-mortem middle-ear function has been observed previously.37, 38 Fig. 8Time-averaged optoelectronic holograms of chinchilla TMs: (a) right ear of a post-mortem chinchilla; (b) right ear of a live chinchilla; (c) thawed right ear of a cadaveric human; (d) left ear of a fresh human cadaver. Vibration patterns produced by low and middle frequencies show the simple, and complex, displacement pattern described in the text. However, at the highest frequencies, the displacement patterns are highly ordered. The handle, or manubrium, of the malleus is outlined in white. The umbo at the end of the handle near the center of the TM is labeled with a white “U.” Standard sample preparation procedures were used.32  Figure 9 shows the results of stroboscopic mode measurements of a human TM demonstrating the OEHO system’s ability to describe differences in optical phase between two stimulus phases ( and ) and to convert those differences to absolute displacements, with nm resolution, of the entire imaged surface. In these data, the two stimuli were set to correspond to the maximum and minimum displacements. Fig. 9Result of stroboscopic holography from a human ear at . The two phases of the acoustic stimulus used to generate these images differed by . (a) Wrapped phase map. (b) Unwrapped phase map. (c) Peak-to peak surface out-of-plane displacement, .  The TM vibration patterns of different species could be grouped into three patterns: simple, complex, and ordered. The time-averaged measurements with lowest frequencies showed simple patterns of a displacement magnitude defined by multiple concentric holographic rings in response to sound stimulation. Simple patterns were restricted to frequencies less than in chinchillas and to frequencies less than in cadaveric humans. For sound frequencies between about in chinchillas, and between in cadaveric human ears, we saw complex patterns with numerous spatial maxima and interdigitating shapes that were separated by regions of small displacements. At high frequencies, above in chinchillas and above in humans, ordered patterns of displacement maxima were arranged like pearls on strings. The strings were arranged in roughly circular patterns along the TM surface, while the pearls appeared to be radially arranged. Patterns similar to these simple and complex displacement patterns have been reproduced by finite-element and other TM models, but to our knowledge none of these models have investigated frequencies high enough to predict the ordered patterns of displacement we observed.18, 19, 20, 21, 22, 23, 24, 25 5.Discussion and ConclusionsWe have presented advances in our development of a compact OEHO system capable of providing qualitative and quantitative descriptions of full-FOV data at nanometer-scale video rates. These optomechanical design parameters of the OEHO system account for the physiologies of different mammalian species and preliminary holographic measurements of TM motion. The prototype OEHO configuration is characterized by the following parameters: FOV, DOF, 0.5X magnification, a fringe visibility of 0.82 obtained with a 1.2 beam ratio, and a resolution. Prior to deployment into a medical research environment, the OEHO system’s image quality and resolution were evaluated using a typical test sample. Currently, the OEHO system is being used to study and examine TMs in live and cadaveric animals and cadaveric humans under normal conditions and after induced pathology. To illustrate the measurement capabilities of our system, we have shown successful representative results from post-mortem chinchillas and humans, as well as in live chinchilla TMs at frequencies up to . For the first time, we have illustrated measurements of the displacement of the TM surface for frequencies above in both animals and humans. The observed vibration patterns show simple, complex, and ordered displacement behaviors. The significance of these different patterns is a point of further study. The results gathered using the OEHO system improve our understanding of the function of the TM and may be helpful in diagnosing of various ossicular disorders, as well as in assessing the reasons for failure in middle-ear reconstructive surgery.39 The present system will be useful in studies that include correlating vibration patterns of the TM across animal species with specific structures of the TM, testing the effects of static air-pressure differences across the TM on auditory mechanics, classifying normal TM function in terms of mode numbers and average displacement versus frequency, and generating more precise models of the biomechanics of TMs. We are continuing our efforts toward the further miniaturization of the developed OEHO system and will present our results in forthcoming publications. We hope to test the further miniaturized system as a tool for discriminating different forms of conductive hearing loss in live patients, much like tympanometry and laser-Dopper vibrometry.8 While useful in diagnostics, these existing tools are limited. For example, tympanometry, because it represents the average motion of the TM, is not very sensitive to a wide range of ossicular disorders, especially in circumstances where some part of the TM is abnormally flaccid. Vibrometry, on the other hand, appears to be insensitive to disorders of parts of the TM that are distant from the measurement point. Holography, with its ability to define the motion of each point of the entire TM surface, will combine the best of both these techniques. AcknowledgmentsThis research was supported by the U.S. National Institute for Deafness and other Communicative Disorders (NIDCD), Worcester Polytechnic Institute (WPI), Centro de Investigaciones en Óptica, A. C. (CIO), Massachusetts Eye and Ear Infirmary (MEEI), and Lakshmi Mittal. We thank Chris Scarpino of the MEEI, an alumni of WPI, for facilitating the interactions between our two research groups. Thanks also go to Christian Wester, Benjamin Dwyer, and Marty Maccaferri for their contributions to this work. ReferencesJ. E. Shanks, D. J. Lilly, R. H. Margolis, T. L. Wiley, and R. H. Wilson,
“Tympanometry,”
J. Speech Hear Disord., 53 354
–377
(1988). 0022-4677 Google Scholar
R. H. Margolis, G. L. Saly, and D. H. Keefe,
“Wideband reflectance tympanometry in normal adults,”
J. Acoust. Soc. Am., 106
(1), 265
–280
(1999). https://doi.org/10.1121/1.427055 0001-4966 Google Scholar
D. H. Keefe, J. C. Bulen, K. H. Arehart, and E. M. Burns,
“Ear-canal impedance and reflection coefficient in human infants and adults,”
J. Acoust. Soc. Am., 94
(5), 2617
–2638
(1993). https://doi.org/10.1121/1.407347 0001-4966 Google Scholar
M. P. Feeney, I. L. Grant, and L. P. Marryott,
“Wideband energy reflectance in adults with middle-ear disorders,”
J. Speech Lang. Hear. Res., 46 901
–911
(2003). https://doi.org/10.1044/1092-4388(2003/070) 1092-4388 Google Scholar
J. B. Allen, P. S. Jeng, and H. Levitt,
“Evaluation of human middle ear function via an acoustic power assessment,”
J. Rehabil. Res. Dev., 42
(4), 63
–78
(2005). https://doi.org/10.1682/JRRD.2005.04.0064 0748-7711 Google Scholar
H. Wada, T. Kobayashi, M. Suetake, and H. Tachizaki,
“Dynamic behavior of the middle ear based on sweep frequency tympanometry,”
Audiology, 28 127
–134
(1989). https://doi.org/10.3109/00206098909081618 0020-6091 Google Scholar
A. M Huber, C. Schwab, T. Linder, S. J. Stoeckli, M. Ferrazzinin, N. Dillier, and U. Fisch,
“Evaluation of eardrum laser Doppler interferometry as a diagnostic tool,”
Laryngoscope, 111 501
–507
(2001). https://doi.org/10.1097/00005537-200103000-00022 0023-852X Google Scholar
J. J. Rosowski, H. H. Nakajima, and S. N. Merchant,
“Clinical utility of laser-Doppler vibrometer measurements in live normal and pathologic human ears,”
Ear Hear., 29 3
–19
(2008). 0196-0202 Google Scholar
J. J. Rosowski, R. Mehta, and S. Merchant,
“Diagnostic utility of laser-Doppler vibrometry in conductive hearing loss with normal tympanic membrane,”
Otol. Neurotol., 25
(3), 323
–332
(2004). https://doi.org/10.1097/00129492-200405000-00021 1531-7129 Google Scholar
R. J. Pryputniewicz, J. S. Yokum, and C. Furlong,
“Optoelectronic holography method for measurements of absolute inside shapes of objects,”
270
–273
(2002). Google Scholar
S. M. Khanna and J. Tonndorf,
“Tympanic membrane vibrations in cats, studied by time-averaged holography,”
J. Acoust. Soc. Am., 51 1904
–1920
(1972). https://doi.org/10.1121/1.1913050 0001-4966 Google Scholar
J. Tonndorf and S. M. Khanna,
“Tympanic-membrane vibrations in human cadaver ears studied by time-averaged holography,”
J. Acoust. Soc. Am., 52 1221
–1233
(1972). https://doi.org/10.1121/1.1913236 0001-4966 Google Scholar
O. J. Løkberg, K. Hogmonen, and O. M. Holje,
“Vibration measurement on the human ear drum in vivo,”
Appl. Opt., 18
(6), 763
–765
(1979). https://doi.org/10.1364/AO.18.000763 0003-6935 Google Scholar
H. Wada, M. Ando, M. Takeuchi, H. Sugara, and T. Koike,
“Vibration measurement of the tympanic membrane of guinea pig temporal bones using time-averaged speckle pattern,”
J. Acoust. Soc. Am., 111
(5), 2189
–2199
(2002). https://doi.org/10.1121/1.1467671 0001-4966 Google Scholar
H. Ladak, W. Decraemer, and W. Funnell,
“Response of the cat eardrum to static pressures mobile versus immobile malleus,”
J. Acoust. Soc. Am., 116
(5), 3008
–3021
(2004). https://doi.org/10.1121/1.1802673 0001-4966 Google Scholar
M. Sudberg, M. Peebo, P. Å. Öberg, and P. G. Lundquist,
“Diffuse reflectance spectroscopy of the human tympanic membrane in otitis media,”
Physiol. Meas, 25 1473
–1483
(2004). https://doi.org/10.1088/0967-3334/25/6/012 0967-3334 Google Scholar
B. Kemper, D. Dirksen, W. Avenhaus, A. Merker, and G. Von Bally,
“Endoscopic double-pulse electronic-speckle-pattern interferometer for technical and medical intracavity inspection,”
Appl. Opt., 25
(2), 4155
–4161
(1986). https://doi.org/10.1364/AO.25.004155 0003-6935 Google Scholar
W. R. Funnell and C. A. Laszlo,
“Modeling of the cat eardrum as a thin shell using the finite-element method,”
J. Acoust. Soc. Am., 63 1461
–1467
(1977). https://doi.org/10.1121/1.381892 0001-4966 Google Scholar
W. R Funnell, W. F. Decraemer, and S. M. Khanna,
“On the damped frequency response of a finite-element model of the cat eardrum,”
J. Acoust. Soc. Am., 81 1851
–1859
(1987). https://doi.org/10.1121/1.394749 0001-4966 Google Scholar
R. Z. Gan, Q. Sun, B. Feng, and M. W. Wood,
“Acoustical-structural coupled finite element analysis for sound transmission in human ear-pressure distributions,”
Med. Eng. Phys., 28 395
–404
(2006). https://doi.org/10.1016/j.medengphy.2005.07.018 1350-4533 Google Scholar
R. D. Rabbitt and M. H. Holmes,
“A fibrous dynamic continuum model of the tympanic membrane,”
J. Acoust. Soc. Am., 80
(6), 1716
–1728
(1986). https://doi.org/10.1121/1.394284 0001-4966 Google Scholar
H. Wada, T. Metoki, and T. Kobayashi,
“Analysis of dynamic behavior of human middle ear using a finite-element method,”
J. Acoust. Soc. Am., 92
(6), 3157
–3168
(1992). https://doi.org/10.1121/1.404211 0001-4966 Google Scholar
J. Fay, S. Puria, W. F. Decraemer, and C. Steele,
“Three approaches for estimating the elastic modulus of the tympanic membrane,”
J. Biomech., 38 1807
–1815
(2005). https://doi.org/10.1016/j.jbiomech.2004.08.022 0021-9290 Google Scholar
T. Koike, H. Wada, and T. Kobayashi,
“Modeling of the human middle ear using the finite-element method,”
J. Acoust. Soc. Am., 111
(3), 1306
–1317
(2002). https://doi.org/10.1121/1.1451073 0001-4966 Google Scholar
H-J. Beer, M. Bornitz, H-J. Hardtke, R. Schmidt, G. Hofmann, U. Voger, T. Zarhnert, and K-B. Hüttenbrink,
“Modelling of components of the human middle ear and simulation of their dynamic behaviour,”
Audiol. Neuro-Otol., 4 156
–162
(1999). https://doi.org/10.1159/000013835 1420-3030 Google Scholar
K. A. Stetson and W. R. Brohinsky,
“Fringe-shifting technique for numerical analysis of time average holograms of vibrating objects,”
J. Opt. Soc. Am. A Opt. Image Sci. Vis, 5
(9), 1472
–1476
(1988). https://doi.org/10.1364/JOSAA.5.001472 1084-7529 Google Scholar
C. Furlong and R. J. Pryputniewicz,
“Non-destructive damage evaluation of composite structures by optoelectronic holography methodologies,”
(2003). Google Scholar
P. Hariharan and B. F. Oreb,
“Stroboscopic holographic interferometry: Application of digital techniques,”
Opt. Commun., 59 83
–85
(1986). https://doi.org/10.1016/0030-4018(86)90454-2 0030-4018 Google Scholar
C. Furlong, J. J. Rosowski, N. Hulli, and M. E. Ravicz,
“Preliminary analyses of tympanic-membrane motion from holographic measurements,”
(2007). Google Scholar
K. Creath,
“Phase-shifting speckle interferometry,”
Appl. Opt., 24
(18), 3053
–3058
(1985). https://doi.org/10.1364/AO.24.003053 0003-6935 Google Scholar
OSLO software for opto-mechanical modeling, optics reference, Lambda Research Corporation, Littleton, MA (
(2005) Google Scholar
C. Furlong, J. J. Rosowski, N. Hulli, and M. E. Ravicz,
“Preliminary analyses of tympanic-membrane motion from holographic measurements,”
Strain, 45 301
–309
(2009). https://doi.org/10.1111/j.1475-1305.2008.00490.x Google Scholar
M. Castello and V. A. Verzilov,
“Spatial resolution of the optical system for beam profile measurements at TTF,”
1
–12
(2001). Google Scholar
J. E. Sollid and J. B. Swint,
“A determination of the optimum beam ratio to produce maximum contrast photographic reconstruction from double-exposure holographic interferograms,”
Appl. Opt., 9 2717
–2719
(1970). https://doi.org/10.1364/AO.9.002717 0003-6935 Google Scholar
R. J. Pryputniewicz and K. A. Stetson,
“Measurement of vibration patterns using electro-optic holography,”
Proc. SPIE, 1162 456
–467
(1989). 0277-786X Google Scholar
C. M. Vest, Holographic Interferometry, 177
–183 John Wiley & Sons, New York
(1979). Google Scholar
J. J. Rosowski, P. J. Davis, S. N. Merchant, K. M. Donahue, and M. C. Coltrera,
“Cadaver middle ears as models for living ears Comparisons of middle-ear input emittance,”
Ann. Otol. Rhinol. Laryngol., 99 403
–412
(1990). 0003-4894 Google Scholar
W. Chien, J. J. Rosowski, M. E. Ravicz, S. D. Rauch, and J. Smullen, and S. N. Merchant,
“Measurements of stapes velocity in live human ears,”
Hear. Res.,
(0378-5955) Google Scholar
J. J. Rosowski, J. T. Cheng, M. E. Ravicz, N. Hulli, M. Hernandez-Montes, E. Harrington, and C. Furlong,
“Computer assisted time-average holograms of the motion of the surface of the mammalian tympanic membrane with sound stimuli of ,”
Hear. Res.,
(2008)
(0378-5955) Google Scholar
|