

|
|
1.IntroductionThe role of blood supply in feeding the entire human body with oxygen and the overall health of the individual has ensured that many instruments over the past have been devised for its investigation. Constant improvements in health and technological advancements in imaging have seen the development of a plethora of imaging instrumentation, varying widely in physical principles, radiation source type, and operating procedures. Due to the essential link between microcirculation function and adequate tissue oxygen delivery and thus organ function, the tissue blood supply has been noted as a crucial indicator of injury and disease.1 Consequences of microvascular injury include intermittent, stagnant, stopped, or hyperdynamic blood flow, and persistant alterations can lead to global tissue hypoxia and organ dysfunction.2 It is for this reason that there has been much time and research devoted to noninvasive and noncontact imaging of human microcirculation. In the 1970s, research led to the laser Doppler perfusion monitor (LDPM)3, 4, 5, 6 and the pulse oximeter,7 while in the 1980s and 1990s, the perfusion monitor was extended to an area scanning beam and called laser Doppler perfusion imaging (LDPI).8, 9 Recent research extends LDPI to a full-field area measurement not requiring rastering of the laser beam as in previous technologies.10, 11 Laser speckle perfusion imaging (LSPI) was also developed in the mid 1990s and fulfills many similar functions to LDPI, albeit through different theoretical operating procedures and instrumentation factors.12 Recently a new technique, tissue viability imaging (TiVi), has been developed for investigating the red blood cell concentration in the upper human dermis. The device is full field and instantaneous, and related to blood concentration only, thereby overcoming a significant limitation of both LDPI and LSPI.13, 14 Figure 1 shows comparison of the publication record of both laser Doppler and laser speckle technologies; Doppler technologies show a significant increase in publication record due to technology maturity and longer use of application than speckle technologies, which have yet to reach maturity. TiVi technology has only been a recent development and as of yet there are no long term trends in publication records. Fig. 1The number of publications per year for both laser Doppler and laser speckle technologies. Source: ScienceDirect. Search terms: laser Doppler (also speckle contrast) and blood to appear in the title, abstract or keyword. No long term data are yet available for TiVi technology.  These techniques represent a mere fraction of the devices developed to perform noninvasive optical measurements on blood in human microcirculation. The principle of each technology and the technical specifications of each commercial imager are briefly described here, and a full technical description of each can be found elsewhere.15 1.1.Laser Doppler Perfusion Monitor and Laser Doppler Perfusion ImagingLDPM and LDPI are well established technologies, mentioned in more than 8000 research articles. Long-running companies such as Oxford Optronix (Oxford, United Kingdom), Moor Instruments (Devon, United Kingdom), and Perimed (Ventura, California) are involved with commercial sales of perfusion monitors and imagers. LDPI has been developed into a high resolution device; using a specialized scanner head, the beam can be focused to obtain a lateral resolution of . Combining this with a scanning step size of allowed in-vitro measurements of microvessels with an average difference of just (half a pixel) from independent microscopic measurements.16 In its basic form, a perfusion image is a collection of LDPM points placed together on a color-coded map showing areas of low and high perfusion. LDPI has found use in many aspects of dermatology, including melanomas,17, 18 drug development,19 ulcers,20 burns and skin grafts,21 Raynaud’s syndrome,22 and cerebral measurements.23 1.2.Principles of Operation of Laser Doppler Perfusion ImagingCoherent laser light is incident on the tissue surface from a distance of approximately . A portion of the light is scattered by static tissue and retains its incident frequency, and another portion is scattered by moving red blood cells (RBCs), which causes a frequency shift in the light returning to the detector (due to the Doppler effect). The resultant mixing (interference) of these dissimilar frequencies at a sensitive detector results in a beat frequency equal to the Doppler shift between the two portions of light. Since the scattering that occurs in tissue is of a completely random nature, not every Doppler-shifted photon has a similar Doppler shift. A wide range of velocities are present, thus creating a Doppler frequency spectrum. The power spectrum of the fluctuations of the photodetector current contains information about the blood perfusion. Through the use of signal processing techniques24 taking the first moment of the power spectrum, an RBC flux is described, which is the product of the concentration and the root mean square of the RBC speed. Conventional LDPI achieves the perfusion image by rastering of a laser beam horizontally and vertically across the tissue surface, momentarily stopping to perform calculations and moving to the next point. Each point represents a point on the perfusion map. New generations of commercial imagers raster a line of pixels in parallel at a single time step, thereby substantially reducing the acquisition time of single images. Another recently developed LDPI method utilizes complimentary metal oxide semiconductor (CMOS) technology, and is devoid of any scanning components, as it acquires data from all points at the same time through the use of a high powered expanded laser beam. Temporal resolution is drastically improved, requiring between 2 and for acquisition and display of a perfusion image, rather than using conventional (point scanning) LDPI. 1.3.Laser Speckle Perfusion ImagingThe speckle imaging technique was originally developed by Fercher and Briers25 in the early 1980 s for retinal blood flow imaging. Digital laser speckle imaging is a recent technology, with the first commercial speckle imager released in 2007 by Moor Instruments (FLPI). In recent times it has found use in many areas, such as blood flow in the optic nerve,26 flow in animal model knee joints27 and cerebrums,28 rodent skin folds,29 and has even been adapted to fit an endoscopic setup.30 1.4.Principles of Operation of Laser Speckle Perfusion ImagingIn a similar process to LDPI, the technique exploits the random speckle pattern, which is generated when tissue is illuminated by coherent laser light. Using a predefined integration time on a charge-coupled device (CCD), the changing pattern is affected by motion of the underlying particles. If there is flow in the region of interest, the speckle pattern is decorrelated (or “blurred”) and the contrast in that area is reduced. Thus the amount of decorrelation is dependent on the speed and volume of the RBCs in the tissue area. In this manner, low contrast is related to a high amount of blood flow (since the light is scattered by moving RBCs only), and conversely, high contrast represents an area of low blood flow. The speckle size is determined by the aperture size of the imaging device alone, and is usually chosen to be the size of a single CCD pixel . The detector integration time is sufficiently small in comparison to the correlation time of the intensity fluctuations so that the signal is not averaged out. In typical systems for skin perfusion imaging, the integration time is set to between 5 and . The laser beam used by LSPI is expanded over a larger area, and there is no rastering of the beam, as all measurements are acquired in parallel. For this reason, many studies involving modern laser speckle imaging require the tissue to be surgically exposed.31 1.5.Tissue ViabilityTiVi imaging is a recently developed technology that allows high resolution imaging of the RBC concentration in upper human dermal tissue.13 Recently, this technique was developed to allow online real-time video imaging of the microcirculation at a frame size of at . Offline, the temporal resolution can be increased to at .32 Using the video mode, spatial resolution is decreased to . The system has been evaluated with fluid models of skin tissues to validate its image processing algorithm. Using the system, it is possible to capture an area of skin measuring with five million measurement pixels at a device-tissue distance of (the most recent version has ten million pixels). Using the acquisition frame for video studies, a minimum area of can be imaged. The technique has shown many uses in drug development, burn investigations, pressure studies, and general research maneuvers due to the ease of use, portability, and low cost. 1.6.Principles of Operation of Tissue ViabilityWhite incoherent light is linearly polarized by a filter and is incident on the surface of the skin. A small fraction of the light is reflected from the epidermal layers and retains its polarization state. Approximately half of the remaining light is absorbed by the tissue, while the other half is diffusely backscattered by the dermal tissue. This backscattered portion is exponentially depolarized mainly due to scattering events by chromophores present in the tissue.33 On re-emerging from the tissue structure as diffusely reflected light, approximately one fifth is parallel and one fifth is perpendicular polarized with respect to the direction of the original filter. This light contains information about the main chromophores in the epidermis (melanin) and dermis (hemoglobin), while the surface reflections contain information about the surface topography, such as texture and wrinkles. The surface reflections and a fraction of the diffusely backscattered light can be differentiated by placing another polarization filter over the detector parallel or perpendicular with respect to the direction of the transmission axis of the filter over the light source. With the transmission axes of both filters oriented parallel or perpendicular with respect to each other, copolarized (CO) or cross-polarized (CR) data, respectively, are obtained. For the TiVi imaging system, the CR arrangement is used, allowing gating of photons from the subepidermal region, optically removing the effects of the superficial layers of the skin. Implicit in its use is the assumption that weakly scattered light (near-surface reflections) retains its polarization state, whereas strongly scattered light will successively depolarize with each scattering event. CR images are color separated by a standard camera CCD, and an algorithm sensitive to the concentration of RBCs only is adapted to provide a linear relationship over a physiological range of 0 to 4% RBC volume fraction. To process the images, an algorithm is used that relates the higher absorption values of blood in the green to lower reference values in the red wavelength regions, while the absorption of light in both wavelength regions in surrounding tissue is of a similar and low degree. Image acquisition for the high resolution mode is instantaneous , and TiVi processed images are presented in similar color map to LDPI and LSPI images, with red and blue representing high and low RBC concentration, respectively. To validate the results of any microcirculation techniques, the opinion of a clinical expert is usually required. As of yet there is no modern technology that has supplanted the fundamental visual observation technique in the clinical environment,34 even though clinicians’ interpretations of images can be bypassed entirely by a computerized analysis, such as neural networks.35 Limitations of skin assessment visual scoring systems such as the skin blanching assay include the requirement of a trained observer to achieve comparable results, the need to make observations in standardized lighting conditions, application of steroids in random order, and assessment by an independent observer. 2.Materials and MethodsThe following section represents a brief introduction to the instrumentation chosen to perform basic skin tests. A summary of principles and operation of each instrument is shown in Table 1 . Full technical descriptions of the technologies are available elsewhere. Table 1Comparison table outlining mechanical and operational principles of the different devices evaluated.
2.1.Laser Doppler Imaging, Moor Instruments’ MoorLDLSThe Moor Instruments LDLS is a line scanning laser Doppler with a laser diode. Due to the capture of 64 points simultaneously, temporal resolution is markedly improved from conventional LDPI. The minimum image acquisition time is dependent on the number of data points per fast Fourier transforms: at maximum resolution , the best image acquisition time is for 256 fast Fourier transforms (FFTs) and for 1024 FFTs. The 26- and image scans require 100 and , respectively, for a single scan of a line of pixels. The maximum scan area is , and the optimal distance to the tissue surface (given by the manufacturer) is . The device is also capable of single point multichannel acquisition at 1, 2, 5, 7, and for the entire line of detectors simultaneously. The background threshold level was determined automatically by centering the laser line on the background under laboratory conditions. 2.2.Laser Speckle Imaging, Moor Instruments’ MoorFLPIFor laser speckle studies, the Moor Instruments FLPI system was chosen. The laser source is expanded over an area, rather than a line as in LDLS. There are two modes available: high resolution/low speed or high speed/low resolution. For low resolution/high speed, acquisition is at a size of . High resolution/low speed allows an adjustable integration time, constant for temporal averaging ( per frame-25 frames, per frame–100 frames, per frame–250 frames, and per frame–1500 frames) at for each image. The imager allows a repeat image function, video mode , and single image acquisitions, all simultaneously if required. The camera gain is adjustable to increase the area of image acquisition, although care should be taken to not saturate the CCD. 2.3.Polarization Spectroscopy-WheelsBridge-Tissue Viability ImagerThe tissue viability (TiVi) imager (WheelsBridge AB, Linköping, Sweden) is a small and portable device for high resolution imaging of the concentration of RBCs in superficial skin tissue. A white xenon flash lamp provides illumination over the wavelength region, and a wide area CCD detects the backscattered light from the tissue. The available commercial system utilizes a high resolution CCD, offering instantaneous image acquisition ( of a s) with a refresh rate of one image every at a resolution of . An enabled macromode allows focusing at a closest distance of from the tissue surface. A research prototype high speed mode was also tested, allowing at for real-time online viewing, and at for offline analysis. This prototype employed a constant broadband light source with the same CCD as that used in the high resolution version of TiVi. The spectra of the light sources are equivalent for both the high resolution and high speed TiVi systems. 2.4.TestsThe tests carried out involved the provocations of well-studied reactions. All tests were performed on three healthy subjects (average age of ), with no history of skin diseases, and who had not used topical or systemic corticosteroid preparations in the previous two months. All subjects were nonsmokers. The subjects were acclimatized in a laboratory at for and rested in a seated position with the volar forearm placed on a flat table at heart level. The instruments were positioned above the forearm for data acquisition. Imaging comparisons were carried out by inducing reactions via topical application of different drugs, including vasodilators (a topical analgesic and methyl nicotinate) and a vasoconstrictor (clobetasol-17-proprionate). methyl nicotinate (MN) was applied to the dorsal side of the hand and monitored over time. A -diam. area was used for the application of the MN, and images were taken every minute with LDLS and every with TiVi and FLPI. A common topical analgesic (Deep Heat) with active ingredients including menthol (5.91%, a vasodilating agent), eucalyptus oil, turpentine oil, and methyl salicylate was tested. The letters “UL” were written on the skin with a small amount of the cream, covering an area of approximately . Mechanical provocations were also carried out (occlusion of blood vessels using a sphygmomanometer) to test the devices’ temporal responses. The application of clobetasol-17-proprionate (Dermavate™) provided a method of blanching the skin, thus allowing the evaluation of below baseline measurements with each system. The clobetasol-17-proprionate was prepared in isopropyl alcohol in a concentration of , and of the steroid was applied topically to a local area of skin and occluded overnight for . Images at 0 and on removal of the occlusion were acquired for analysis. A reactive hyperaemia observed in the left hand nailfold plexus, caused by brachial arterial occlusion using a sphygmomanometer on the upper arm of the test subjects, was used to compare the systems in temporal mode (with the high speed TiVi system used). A baseline level was taken for , then arterial occlusion was performed by inflating the cuff to Hg for . In previous studies with LDPI, on complete release of the cuff, the resulting increase in blood perfusion is seen, and blood flux oscillations are regularly observed. This phase was observed for a further . To further examine the sensitivity of the TiVi system alone with pressure, a further experiment was conducted where both the high speed and high resolution TiVi systems were arranged to image the volar forearm of a healthy individual at increasing and decreasing pressure steps of Hg. In all studies carried out in this work, apart from the postocclusive reactive hyperaemia, the LDLS and TiVi systems performed imaging simultaneously. Care was taken when acquiring the TiVi image, since the LDLS uses a tracking beam. TiVi images were acquired instantaneously after the LDLS had finished its scan of the area. Physical size prevented all three technologies being used at the same time on the same test area, meaning that tests with the FLPI had to be carried out separately from TiVi and LDLS studies. The white flash light source on the TiVi did not interfere with the LDLS system, as there are filters present to remove much of the extraneous light. Also, since the flash time is small in comparison with the LDLS acquisition time ( in most cases), any effect of the flash would be likely to affect only one line in the LDLS line scan. Finally, the TiVi readings were not affected by the scanning beam of the LDLS system, as it was outside the sensitive region of the detector. A plot of the response of the CCD present in the TiVi imaging system shown in Fig. 2 shows that light at is almost entirely ignored. 3.Results3.1.Topical Analgesic (Deep Heat)The active ingredient of the analgesic, menthol, induces vasodilatation, and caused erythema in all three subjects. Due to percutaneous absorption of methyl salicylate, it was important to note that this analgesic should be used with care on persons sensitive to aspirin, or suffering from asthma. None of the subjects were sensitive to aspirin or had asthma, and the analgesic was applied to an unbroken area of skin. The cream was applied to cover an area of approximately , in the shape of the letters “UL.” A small amount of the cream was applied to the volar forearm and imaged later. The resulting erythema was imaged with the three devices, and can be seen in Fig. 3 . The images show the same affected area, and clear border discrimination can be seen with the TiVi and FLPI imaging systems. The LDLS, however, does not show an increase in perfusion with the shape made by the analgesic cream, and it is proposed that the LDLS imaging system is probing much deeper vessels in the microcirculatory structure. This issue is further evaluated in the discussion in Sec. 4. Fig. 3Comparison of a topical application of a common analgesic (Deep Heat) as assessed by the LDLS, FLPI, and TiVi imaging technologies. The color visual image is a cross-polarized image from the TiVi imager, which serves as a visual aid, as well as the image for subsequent processing. Neither of the other two technologies investigated offers a standard color image. (Color online only.)  3.2.Methyl NicotinateThe effect of topically applied methyl nicotinate (MN) was monitored over time. A circular area of approximately in diameter on the dorsal side of the hand was used as a test area for administration of two to three drops of MN at a concentration of . Three regions of interest were identified: one area inside the central portion of the reaction, one area including the entire reaction at its largest and some surrounding tissue, and the final area being nonreacting skin tissue, set approximately away from the extremity of the reaction. The largest area had approximately three times as many pixels as the central ROI, and as many pixels as the nonreacting ROI (the central area for LDLS, FLPI, and TiVi comprised 150, 12,420, and , respectively). An example of the areas sampled can be seen in Fig. 4 . One image per minute was acquired simultaneously from the LDLS and TiVi devices. An identical test was repeated to evaluate the FLPI, and two images per minute were acquired. A gallery of images of the spread and intensity of the reaction via LDLS can be observed in Fig. 5, and traces of the vasodilatation effects can be observed in Fig. 6 . As expected, the nonreacting area showed no major deviations, and is a measure of the skin background level for each technology. It can be noticed that this background level changed slightly for each technique over time, but was not linked to the vasodilatation caused by the MN. This shows the inherent variability in the skin background perfusion/RBC concentration over time. Since the TiVi technology is sensitive to RBC concentration only, it is possible that if the RBC speed is constant, the change in concentration only, as shown by TiVi, is also being measured by LDLS and FLPI. Also, the response from the central area rose more rapidly and to a higher value than the area including the border of the reaction, since the reaction was weaker toward the extremities. Each value is plotted plus and minus one standard deviation of the ROI. The standard deviation for TiVi is much lower than that of LDLS or FLPI due to the large number of points used to create the TiVi image, an order of magnitude larger than that of the other two technologies. Fig. 4Schematic outlining the areas used for analysis of the vasodilating agent. Methyl nicotinate. Areas 1, 2, and 3 correspond to the central area, surrounding area, and a nonreacting area located away, respectively. The inflammation at two time steps is detailed, showing the area spread of the drug. 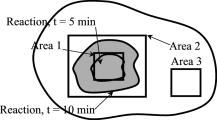 Fig. 5Onset and decay of the reaction induced by MN as observed by the LDLS system. One image was acquired every minute for the LDLS and TiVi studies. The experiment was repeated at a later time in the day for the FLPI study due to inability to utilize all three imaging systems simultaneously.  Fig. 6Time traces over of LDLS, FLPI, and TiVi showing the vasodilating effects of methyl nicotinate. The error bars correspond to one standard deviation. The three regions of interest measured are those specified in Fig. 4.  3.3.Skin Blanching (Dermavate™)The effects of the skin blanching steroid provided visual whitening due to vasoconstriction of the underlying blood vessels in each subject. Images of the microvasculature from each device can be seen in Fig. 7 . From the figure, it can be seen that the LDLS and FLPI do not show any difference between the areas of baseline and the area where the corticosteroid was administered. Only the TiVi system shows marked vasoconstriction caused by the steroid. Fig. 7The imaging of skin blanching due to a vasoconstricting corticosteroid by three different microcirculation imaging techniques. The black dots in the FLPI and LDLS images show the area affected by the drug. The FLPI image is shown over a smaller scale, as the entire arm could not be imaged due to the background level. Thus the border between affected and unaffected tissue is shown. To the left of the dots is where the drug was administered; to the right of the dots is unaffected tissue.  Six ROIs were placed in each image to measure a physical area of each as accurately as possible. Three regions were placed in nonreacting skin areas surrounding the drug-affected area, and another three were placed inside the affected area. Thus each ROI in TiVi was comprised of approximately , for LDLS and in FLPI. The total area of all ROIs in each image comprised approximately 10% of the entire image for each device image. Observing the regions of interest, an average value for the regions inside and outside the drug administered area could be determined. A tabulation of the averaged ROI data for all subjects is shown in Table 2 . Little difference can be observed in the regions inside and outside for the LDLS and the FLPI. It can be noted that the TiVi shows a marked difference in RBC concentration for the ROI inside and outside the affected areas. Table 2Comparison of results for the skin blanching evaluation of devices. Inside and outside refer to the region of steroid application, and is the average of three ROIs placed in the area.
3.4.Postocclusive Reactive HyperaemiaTo assess the time acquisition properties, it was decided to observe the commonly studied postocclusive reactive hyperaemia at the nailfold of the second finger. Lower and upper pressure values of 90- and Hg were employed to arrest completely the venous and arterial circulation, respectively. Standard baseline was registered for , and pressure of Hg was applied using the sphygmomanometer (occluding the blood vessels) and maintained for . The resulting hyperaemia on removal of the occlusion was monitored for . The areas of the response representing the baseline, occlusion, and hyperaemia are labelled A, B and C, respectively in Fig. 8 . It should be noted that on application of the sphygmomanometer and subsequent analysis for the TiVi, the curve increased for both 90- and Hg. This is because the instrument is sensitive to concentration of RBCs only, and not the speed. This new technology adds a new dimension to the study of postocclusive reactive hyperaemia, with a nontraditional time trace sensitive to the concentration of RBCs only. Care has to be taken on the interpretation of this new data, and this is addressed further in the discussion in Sec. 4. Fig. 8Time traces of postocclusive reactive hyperaemia. The reaction was sectioned into three parts: A is the baseline measurement, B is the occlusion for , and C represents the reactive hyperaemia on removal of the occlusion. Pressure in all cases was Hg, except in the TiVi curves, where Hg pressure was also used to show the TiVi systems’ (high resolution and high speed) sensitivity to pressure.  A further evaluation of the systems’ sensitivity to the increased red blood cell concentration due to cuff back-pressure is shown in Fig. 9 . Both the high resolution (spatial) and high speed systems imaged a section of the volar forearm of a subject during increasing and decreasing levels of stasis, achieved by Hg steps of pressure. After each increase in pressure, passed before subsequent imaging. This was to ensure the RBC concentration and pressure stabilized in the microcirculation. The area imaged corresponded to an ROI of approximately of tissue ( and for the high temporal and high spatial resolution systems, respectively). Similar to Fig. 8, increased with increasing pressure due to more RBCs becoming trapped in the tissue. thus decreases when the pressure is stepped downward. Fig. 9Sensitivity of the TiVi (high temporal and spatial resolution) and FLPI systems with increases and decreases of Hg of sphygmomanometer pressure. The ROI was on the volar forearm and measured approximately . Differences in the traces can be attributed to the fact that the experiment was performed separately for each device, and possible shifting of the ROI. Perfusion can be seen to decrease with occlusion, whereas increases due to trapping of RBCs. 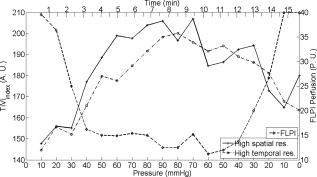 4.DiscussionEven with the massive technological advancements of the past , current “gold-standard” methods of examination of skin lesions, erythema, and tumors still involve simple microscope techniques, i.e., a closer look at the affected area, carried out by a skilled clinician, be it a pathologist or dermatologist. Similarly, no modern imaging technique has been proven to consistently outperform the opinion of a clinical expert in relation to patch or prick testing.36 Often times, the capital cost of a technology without an extremely high success rate is not justified, even if the workload of the clinician is drastically reduced. Dermatology has the benefit that access to the tissue is easy for diagnosis. Evaluation of an erythematous reaction or chemically induced blanching of the skin is normally determined from its visual characteristics only. Visual grading schemes for patch and prick testing are inherently subjective, and false readings occur due to concentrations that are too high (causing irritant reaction), loosening of the test strip, exposure to UV radiation, and interobserver variability. It is for this reason that many noninvasive biomedical engineering tools have been employed to provide reproducible results in an objective and quantitative fashion. The ideal blood flow/concentration monitor should have the characteristics of observational measurements, be able to provide reproducible results, have little or no dependency on the tissue optical properties, instantaneous image acquisition (to help against patient motion), and provide a variable in standard SI units. The commercial devices examined in this work provide relative changes in flow/RBC concentration due to the random nature of the microvascular architecture. Previous experiments in LDPI technology tried to concentrate on creating guidelines to enhance reproducibility when using different imagers in multicenter studies.37 Since LDPI is the oldest technology used in this work , more research and commercial products exist on LDPI than other technologies. Future advancements are certain to overcome some limitations of laser Doppler imaging. Recently, a full-field laser Doppler imager has been developed and is close to commercial production, providing points every .10 4.1.VasodilatorsThe visible reddening of the skin caused by the topical analgesic was followed by both the FLPI and TiVi systems, with the edges of the treated regions clearly defined. However, the failure of the LDLS to show the same pattern points to a difference in depth penetration between the devices. As explained in the introduction of this work, the frequency weighting of the Doppler signal and high power density of the laser line (in comparison to FLPI and TiVi) means that the signal from faster flowing blood in deeper vessels is dominant. This view is further supported by the fact that in this experiment the veins in the forearm were clearly visible, while the borders of the treated region were not. It also demonstrates that the vasodilating effect of this topical cream was limited to the superficial nutritional supply. All three devices showed a similar response to application of methyl nicotinate, with all time traces for each region of interest following the same shape. The instrument response in the region of interest in the center of the reaction showed a peak between , while the untreated region was flat in each case by comparison. It is worth noting that despite the fact that the methyl nicotinate was applied topically, it penetrated sufficiently into the skin to elicit a significant response from the LDLS (in contrast to the analgesic cream). At the borders of the reaction, due to diffusion of the drug from the point of application, the concentration of methyl nicotinate was lower than that at the center of the reaction. This low dose at the edge does not penetrate as deeply into the skin and may explain why the LDLS shows a faster drop in response in this region of interest. 4.2.BlanchingThe blanching effect of local application of corticosteroids is well known, and is most often investigated by visual scoring (vasoconstrictor assay) as described by McKenzie and Stoughton.38 Previous experiments with LDPI showed an increase in perfusion, rather than the expected decrease, as vasoconstriction leads to a decrease in capillary diameter. It has been hypothesized that the decreasing vessel diameter increased the speed of moving RBCs. Thus an increase in perfusion can be explained only if the speed increases more than the blood volume is reduced. Perfusion from LDPI has been noted to show similar values for normal and vasoconstricted skin,39 and therefore cannot accurately discriminate between the two tissue statuses. Conflicting results achieved recently show that LDPM describes a significant decrease in blood flow in the volar forearm after topical application of clobetasol proprionate.40 Clearly more research is needed to clarify the effect of vasoconstriction with the use of microcirculation imaging devices. The work described here shows that the commercial LDLS and FLPI systems show no significant change in perfusion on administration of a vasoconstrictive agent, clobetasol proprionate. The vehicle for the steroid was investigated previously, and was found to have no effect on the microcirculation.39 LDLS clearly shows the perfusion in the veins in the forearm, and thus it is possible that it may be measuring deeper than the microcirculation, i.e., below the level where the corticosteroid causes vasoconstriction. TiVi technology shows the most sensitivity to measurements below the baseline level of the tissue, and thus provides a better method for nontraumatic assessment of steroid potency. The borders, although diffuse because of the drug, are clearly visible, and ROIs inside and outside show a clear and definitive vasoconstriction in line with a visible CR photograph of the area. 4.3.Postocclusive Reactive HyperaemiaThe sensitivity of each device to pressure and the different dynamic reactions can be seen from Fig. 8, where the concentration of RBCs in the forearm increased on application of the sphygmomanometer. In the case where Hg pressure was applied, the arteries and veins were quickly closed, trapping the red blood cells in the tissue at a level not much higher than the baseline. On release of the occlusion, the concentration increased rapidly due to the backlog of blood rushing into the area to feed the nutrient-starved tissue. When only Hg was applied, the arterial inflow remained open while the venous outflow was in stasis. Thus, the concentration of RBCs increased gradually in an almost logarithmic function, and began to reach a plateau, either due to system saturation (the system is linearly calibrated to a physiological RBC concentration of 4% in tissue) or more likely due to a plateau reached by the amount of RBCs that can fit into the vasculature. This section of the curve showed the dynamics of the blood vessels filling up quickly with blood. Future studies will investigate this plateau. After the occlusion was released, the venous outflow was reopened and the RBC concentration dropped rapidly to empty the excess RBCs from the area, and showed signs of returning to a normal state postrelease of the occlusion. The sensitivity of the TiVi Imaging System to RBC concentration showed two distinct curves, dependent on the pressure of the sphygmomanometer. Figure 9 shows the sensitivity of both the TiVi and FLPI instruments to slight increases in RBC concentration (and hence a consequent decrease in flux). A small change in pressure of Hg elicited a detectable change in RBC concentration/perfusion. The slight differences in the traces can be attributed to the fact that the experiment was performed once for each device, and possible shifting of the ROI due to unavoidable subject motion. Since the same CCD was used for both TiVi studies, it was assumed that there were no instrumentation differences. It should also be noted that from the figure, the and FLPI perfusion at the beginning of the experiment (i.e., at Hg) was lower from that of the Hg at the end of the experiment for each device. This shows that there was some after-effect in the microvasculature due to the pressure that restricts either the inflow or outflow of RBCs, such as the vessels not returning to their original state. Although this is somewhat expected in studies where erythema is produced by mechanical or chemical means, pressure steps do not produce visible reddening of the skin, yet the effects lasted many minutes after the venous occlusion had been removed. Biological zero is a well-known feature of laser Doppler studies and manifests as an offset from instrumental zero seen during occlusion. Total flow arrest would mean that would be zero, but Brownian motion and occasionally opening and closing of local shunts, vasodilatation, and vasoconstriction of local vessels can all contribute to the nonzero flow registered.41 A similar situation arises with FLPI, as there is still some blurring of the speckle due to red blood cell movement. However, TiVi is sensitive to concentration alone and would require completely bloodless tissue to register a zero reading. 4.4.Experimental ConsiderationsTable 1 shows the major features of each independent technology. It is important to remember that the choice of each technique is highly dependent on what is required to be measured. In many cases, biomedical engineering systems are utilized to measure properties or functions that they were never designed to investigate, and thus results can confound expectations. In the technologies presented in this work, many parameters have been identified by basic skin testing experiments such as spatial resolution of provoked erythema, measurement of skin blanching, and sensitivity to pressure applied with a sphygmomanometer. The most important feature of the technologies presented is that both the LDLS and FLPI measure perfusion, albeit at different depths in dermal tissue, while TiVi technology measures relative concentration in the tissue. It is important to remember that the new TiVi imaging technology does not provide measurements of blood flow. Indeed, it is similar to processing of the unweighted moment of the laser Doppler power spectrum to provide measurement of concentration, except that it is valid only with a low amount of scattering events at low concentrations, and is dependent on the total light intensity. With the larger measurement depth of LDLS compared to other techniques, it proves to be inefficient for very superficial measurements, such as the erythema produced by the topical analgesic. Acquisition on the temporal scale is also hindered with the LDLS due to rastering of the laser line. As microcirculation is a highly dynamic environment, its perfusion values can change rapidly. Cardiac pulse (c. ), breathing (c. ), and vasomotion (c. ) in highly perfused tissues are evidence of the rapid temporal nature of microvascular activity. Thus, in laser Doppler studies and the relatively long acquisition time of a single image, the temporal changes in perfusion may often be misinterpreted as spatial heterogeneity.42 This occurs because it has to be assumed that the perfusion of the site under investigation is stationary and constant, thus the study of dynamic changes is severely compromised. It remains to be seen if the recent CMOS LDPI technology can bridge the gap in temporal resolution in LDPI. Laser Doppler and speckle signals are a complex function of many parameters and are also dependent on source wavelength, coherence properties of the laser, tissue optical properties, and distance between the scanner and tissue surface. Additional processing is required to correct for nonlinear behavior at high RBC concentrations due to the presence of multiple scattering. It should be noted that all three techniques merely provide a ratiometric measurement to aid any clinical observation. The techniques are not to be used for diagnosis independently of clinical observation. 4.5.Depth of MeasurementMuch variation is reported in the literature as to the depth of penetration of a light beam in tissue, owing to technological variations such as light power and wavelength, and biological factors such as pigmentation level, age, skin transparency, and epidermal thickness.43 However, the important parameter is measurement depth rather than penetration or even sampling depth. Indeed, studies in laser Doppler imaging state that measurement depth in the forearm can be 44 or even .45 This measurement depth is highly wavelength dependent, and thus depends on which device has been employed. These confounding values, along with an inherent inability to accurately state the optical properties of skin tissue and the diffuse nature of light within it, hamper a direct and precise value for penetration depth of a laser beam in tissue, allowing only approximations and computer simulations to be made. Physiologically, in the vessel compartments the total cross-sectional area (A) increases from the larger capillaries to the superficial dermal plexus, and then decreases in the veins because the blood flux is constant in a closed system and the speed must be proportional to 1/A. Thus, the speed is lower in the narrower vessels than in the larger (and deeper) vessels. It is for this reason that low and high frequencies are attributed to flux originating in the superficial vascular plexus and the deeper vessels, respectively. It has been reported that 15% of skin blood flow originates from the nutritional flow, while 85% results from the deeper thermoregulatory flow.46 Use of the laser wavelength for laser Doppler studies is also an issue; the frequency shift for HeNe laser light at is , but for a laser is . Leahy 42 states that the difference in frequency shifts occurs due to the longer wavelength penetrating deeper into the microvasculature, thus probing faster flowing blood. However, both the LDLS and FLPI used for studies carried out in this work employed a source. Speckle technology probes a more shallow depth than laser Doppler for two main reasons. First, the speckle signal is not frequency weighted, and is looking at first-order statistics, while laser Doppler looks at second-order statistics. Also for speckle studies, the laser source is expanded over a much larger area than the point for laser Doppler studies, thus there is a reduction in the power density of the beam. This reduction means that the depth at which noise dominates will be more superficial so that the contribution from faster flowing blood in veins (which is enhanced in laser Doppler technology due to frequency weighting) is lost for speckle imaging. The observation that many speckle studies are carried out on surgically exposed tissue (for example, exposed mouse brain,15 skin folds, and muscle29) and the appearance of microvessels in the processed images can be explained by the choice of tissue and its preparation. In general, the reduced measurement depth of the FLPI system renders it unsuitable for monitoring nonsuperficial vessels. The FLPI imager was also used more frequently for imaging smaller areas more rapidly and at higher resolutions than are commonly used by laser Doppler systems, and involve measurements on exposed tissues because the measurement conditions best suit the technique rather than because the technique best suits the measurement. This is an important factor to remember when optimizing the use of an expensive piece of equipment destined for use in a clinical setting. An interesting comparison should be carried out between the new full-field laser Doppler imager and current commercial laser Doppler technology to examine the depth selection of the signal. Depth of measurement for TiVi has previously been estimated at from Monte Carlo simulations of polarized light propagation into simulated dermal tissue.13 Any future experimentally determined values should verify this model value. It should be noted that the technique is based on polarized light absorption spectroscopy, and does not bear any reference to the moving particles in the tissue. Although the system is not responsive to blood flow, it does return a signal from the deeper veins in the forearm due to the high concentration of blood. Because of the appearance of the blue veins, the TiVi returns an almost zero value in its variable, , even though a nearby skin site in the upper microcirculation can have a high value. Again, it should be remembered that the TiVi imager is designed to investigate the upper microcirculation and that RBC concentration values from anywhere other than this region may not be accurate. The measurement volume (the volume from which the bulk of the signal is acquired) is well inside the reticular dermis of the microcirculation. For laser Doppler measurements, the measurement volume has been determined as approximately or smaller,3, 15, 47 and in laser speckle systems the volume is highly dependent on the type of system being used. 5.ConclusionsWe compare the operation of an established microcirculation imaging technique, laser Doppler perfusion imaging (LDPI), with more recently available laser speckle and TiVi in human skin tissue using well-established microvascular provocations. The work confirms laser Doppler’s sensitivity to provocations affecting the bulk of the upper dermis, but not the most superficial nutritional layers. Despite using the same lasing wavelength, the speckle (FLPI) images are dominated by the superficial papillary plexus, as shown in its tracks of the inflammatory response, to a topical analgesic where the LDPI had failed. The TiVi system similarly tracks the inflammatory response, as one might expect from a system designed specifically to track red blood cell concentration. However, TiVi differs from the other techniques in its response to occlusion of the brachial artery. Since this is a global occlusion of the forearm, all instruments are sensitive to the effect. LDPI and LSPI show a large decrease, as they are both sensitive to red blood cell concentration and speed. However, TiVi, being sensitive to concentration only, shows stasis when a full arterial occlusion ( Hg) is applied quickly and a swelling of red blood cell concentration when the arterial inflow remains open with the venous outflow occluded ( Hg). LSPI and TiVi are both welcome tools in the study of microcirculation, but care must be taken in the interpretation of the images, since blood flow and blood concentration in tissue are essentially different parameters. Work described here may motivate further studies in comparisons between noninvasive optical techniques for the investigation of tissue microcirculation. AcknowledgmentsThe authors are grateful to HEA PRTLI4 (national development plan) funding of the National Biophotonics and Imaging Platform Ireland, and IRCSET for supporting this research. They also thank Rodney Gush of Moor Instruments, and Gert Nilsson of WheelsBridge AB, Sweden. ReferencesP. E. Spronk, D. F. Zandstra, and C. Ince,
“Bench-to-bedside review: Sepsis is a disease of the microcirculation,”
Crit. Care, 8
(6), 462
–468
(2004). https://doi.org/10.1186/cc2894 1364-8535 Google Scholar
J. L. Vincent and D. DeBacker,
“Microvascular dysfunction as a cause of organ dysfunction in severe sepsis,”
Crit. Care, 9
(Suppl. 4), 9
–12
(2005). https://doi.org/10.1186/cc3748 1364-8535 Google Scholar
M. D. Stern, D. L. Lappe, P. D. Bowen, G. Chimosky, G. A. Holloway, H. R. Keiser Jr., and R. L. Bowman,
“Continuous measurement of tissue blood flow by laser Doppler spectroscopy,”
Am. J. Physiol., 232
(4), H441
–H448
(1977). 0002-9513 Google Scholar
P. Å. Öberg, T. Tenland, and G. E. Nilsson,
“Laser-Doppler flowmetry-a non-invasive and continuous method for blood flow evaluation in microvascular studies,”
Acta Med. Scand., Suppl., 687 17
–24
(1984). 0365-463X Google Scholar
R. J. Gush, T. A. King, and M. I. V. Jayson,
“Aspects of laser light scattering from skin tissue with application to laser Doppler blood flow measurement,”
Phys. Med. Biol., 29
(12), 1463
–1476
(1984). https://doi.org/10.1088/0031-9155/29/12/001 0031-9155 Google Scholar
G. E. Nilsson, T. Tenland, and P. Å. Öberg,
“Evaluation of a laser Doppler flowmeter for measurement of tissue blood flow,”
IEEE Trans. Biomed. Eng., 27 597
–604
(1980). https://doi.org/10.1109/TBME.1980.326582 0018-9294 Google Scholar
T. Aoyagi,
“Pulse oximetry: Its invention, theory and future,”
Br. J. Anaesth., 17 259
–266
(2003). 0007-0912 Google Scholar
T. J. Essex and P. O. Byrne,
“A laser Doppler scanner for imaging blood flow in skin,”
J. Biomed. Eng., 13
(3), 189
–194
(1991). https://doi.org/10.1016/0141-5425(91)90125-Q 0141-5425 Google Scholar
K. Wårdell, A. Jakobsson, and G. E. Nilsson,
“Laser Doppler perfusion imaging by dynamic light scattering,”
IEEE Trans. Biomed. Eng., 40
(4), 309
–316
(1993). https://doi.org/10.1109/10.222322 0018-9294 Google Scholar
A. Serov, B. Steinacher, and T. Lasser,
“Full-field laser Doppler blood-flow imaging and monitoring using an intelligent CMOS camera and area illumination,”
Opt. Express, 13
(10), 3681
–3689
(2005). https://doi.org/10.1364/OPEX.13.003681 1094-4087 Google Scholar
A. Serov and T. Lasser,
“High-speed laser Doppler perfusion imaging using an integrating CMOS image sensor,”
Opt. Express, 13
(17), 6416
–6428
(2005). https://doi.org/10.1364/OPEX.13.006416 1094-4087 Google Scholar
J. D. Briers,
“Laser Doppler, speckle and related techniques for blood perfusion mapping and imaging,”
Physiol. Meas, 22 R35
–R66
(2001). https://doi.org/10.1088/0967-3334/22/4/201 0967-3334 Google Scholar
J. O’Doherty, J. Henricson, C. Anderson, M. J. Leahy, G. E. Nilsson, and F. Sjöberg,
“Sub-epidermal imaging using polarized light spectroscopy for assessment of skin microcirculation,”
Skin Res. Technol., 13 472
–484
(2007). https://doi.org/10.1111/j.1600-0846.2007.00253.x 0909-752X Google Scholar
G. E. Nilsson, H. Zhai, S. Farahmand, and H. I. Maibach,
“Cutaneous bioengineering instrumentation standardization: the tissue viability imager,”
Skin Res. Technol., 15
(1), 6
–13
(2009). https://doi.org/10.1111/j.1600-0846.2008.00330.x 0909-752X Google Scholar
M. J. Leahy, J. G. Enfield, N. T. Clancy, J. O’Doherty, P. McNamara, and G. E. Nilsson,
“Biophotonic methods in microcirculation imaging,”
Med. Laser Appl., 22
(2), 105
–126
(2007). https://doi.org/10.1016/j.mla.2007.06.003 1615-1615 Google Scholar
M. Linden, H. Golster
S. Bertuglia, A. Colanfouni, F. Sjöberg, and G. Nilsson, Microvasc. Res., 56
(3), 261
–270
(1998). https://doi.org/10.1006/mvre.1998.2095 0026-2862 Google Scholar
M. Ilias, K. Wårdell, M. Stücker, C. Anderson, and E. G. Salerud,
“Assessment of pigmented skin lesions in terms of blood perfusion estimates,”
Skin Res. Technol., 10
(1), 43
–49
(2004). https://doi.org/10.1111/j.1600-0846.2004.00052.x 0909-752X Google Scholar
M. Stücker, C. Springer, V. Paech, N. Hermes, M. Hoffman, and P. Altmeyer,
“Increased laser Doppler flow in skin tumors corresponds to elevated vessel density and reactive hyperemia,”
Skin Res. Technol., 12 1
–6
(2006). https://doi.org/10.1111/j.0909-725X.2006.00139.x 0909-752X Google Scholar
M. Kragh, B. Quistorff, and P. E. G. Kristjansen,
“Quantitative estimates of angiogenic and anti-angiogenic activity by laser Doppler flowmetry (LDF) and near infra-red spectroscopy (NIRS),”
Eur. J. Cancer, 37 924
–929
(2001). https://doi.org/10.1016/S0959-8049(01)00059-4 0959-8049 Google Scholar
K. Malanin, H. K. Havu, and P. J. Kolari,
“Dynamics of cutaneous laser Doppler flux with concentration of moving blood cells and blood cell velocity in legs with venous ulcers and in healthy legs,”
Angiology, 55
(1), 37
–42
(2004). https://doi.org/10.1177/000331970405500106 0003-3197 Google Scholar
J. C. Jeng, A. Bridgeman, L. Shivnan, P. M. Thornton, H. Alam, T. J. Clarke, K. A. Jablonski, and M. H. Jordan,
“Laser Doppler imaging determines need for excision and grafting in advance of clinical judgement: a prospective blinded trial,”
Bol. Inst. Estud Med. Biol. Univ. Nac. Auton Mex, 29 665
–670
(2003). 0366-1695 Google Scholar
T. Kanetaka, T. Komiyama, A. Onozuka, T. Miyata, and H. Shigematsu,
“Laser Doppler skin perfusion pressure in the assessment of Raynaud’s phenomenon,”
Eur. J. Vasc. Endovasc Surg., 27
(4), 414
–416
(2004). https://doi.org/10.1016/j.ejvs.2003.12.017 1078-5884 Google Scholar
J. Tonnesen, A. Pryds, E. H. Larsen, O. B. Paulson, J. Hauerberg, and G. M. Knudsen,
“Laser Doppler flowmetry is valid for measurement of cerebral blood flow autoregulation lower limit in rats,”
Exp. Physiol., 90
(3), 349
–355
(2005). https://doi.org/10.1113/expphysiol.2004.029512 0958-0670 Google Scholar
M. L. Arildsson, K. Wårdell, and G. E. Nilsson,
“Higher order moment processing of laser Doppler perfusion signals,”
J. Biomed. Opt., 2
(4), 358
–363
(1997). https://doi.org/10.1117/12.281499 1083-3668 Google Scholar
F. Fercher and J. D. Briers,
“Flow visualization by means of single-exposure speckle photography,”
Opt. Commun., 37 326
–329
(1981). https://doi.org/10.1016/0030-4018(81)90428-4 0030-4018 Google Scholar
K. Yaoeda, M. Shirakashi, S. Funaki, H. Funaki, T. Nakatsue, A. Fukushima, and H. Abe,
“Measurement of microcirculation in optic nerve head by laser speckle flowgraphy in normal volunteers,”
Am. J. Opthalmol., 130
(5), 606
–610
(2000). https://doi.org/10.1016/S0002-9394(00)00723-6 Google Scholar
K. Forrester, C. Stewart, J. Tulip, C. Leonard, and R. Bray,
“Comparison of laser speckle and laser Doppler perfusion imaging: measurement in human skin and rabbit articular tissue,”
Med. Biol. Eng. Comput., 40 687
–697
(2002). https://doi.org/10.1007/BF02345307 0140-0118 Google Scholar
P. Li, S. Ni, L. Zhang, S. Zeng, and Q. Luo,
“Imaging cerebral blood flow through the intact rat skull with temporal laser speckle imaging,”
Opt. Lett., 31 1824
–1826
(2006). https://doi.org/10.1364/OL.31.001824 0146-9592 Google Scholar
A. Choi, N. M. Kang, and J. S. Nelson,
“Laser speckle imaging for monitoring blood flow dynamics in the in vivo rodent dorsal skin fold model,”
Microvasc. Res., 68 143
–146
(2004). https://doi.org/10.1016/j.mvr.2004.04.003 0026-2862 Google Scholar
R. C. Bray, K. R. Forrester, J. Reed, C. Leonard, and J. Tulip,
“Endoscopic laser speckle imaging of tissue blood flow: applications in the human knee,”
J. Orthop. Res., 24
(8), 1650
–1659
(2006). https://doi.org/10.1002/jor.20178 0736-0266 Google Scholar
R. Gush,
(2007) Google Scholar
J. O’Doherty, J. Henricson, G. E. Nilsson, C. Anderson, and M. J. Leahy,
“Real time diffuse reflectance polarisation spectroscopy imaging to evaluate skin microcirculation,”
Proc. SPIE, 6631 66310O
(2007). https://doi.org/10.1117/12.728337 0277-786X Google Scholar
A. Ishimaru,
“Diffusion of light in turbid media,”
Appl. Opt., 28 2210
–2215
(1989). https://doi.org/10.1364/AO.28.002210 0003-6935 Google Scholar
A. Rallan and C. C. Harland,
“Skin imaging: is it clinically useful?,”
Clin. Exp. Dermatol., 29 453
–459
(2004). https://doi.org/10.1111/j.1365-2230.2004.01602.x 0307-6938 Google Scholar
S. Tomatis, A. Bono, C. Bartoli, M. Carrara, M. Lualdi, G. Tragni, and R. Marchesini,
“Automated melanoma detection: Multispectral imaging and neural network approach for classification,”
Med. Phys., 20
(2), 212
–221
(2003). https://doi.org/10.1118/1.1538230 0094-2405 Google Scholar
H. Lamminen and V. Voipio,
“Computer-aided skin prick test,”
Exp. Dermatol., 17
(11), 975
–976
(2008). https://doi.org/10.1111/j.1600-0625.2008.00749.x 0906-6705 Google Scholar
A. Fullerton, M. Stücker, K. P. Wilhelm, K. Wårdell, C. Anderson, T. Fischer, G. E. Nilsson, and J. Serup,
“Guidelines for visualization of cutaneous blood flow by laser Doppler perfusion imaging,”
Contact Dermatitis, 46 129
–140
(2002). https://doi.org/10.1034/j.1600-0536.2002.460301.x 0105-1873 Google Scholar
A. W. McKenzie and R. B. Stoughton,
“Method for comparing percutaneous absorption of steroids,”
Arch. Dermatol., 86 608
–610
(1962). 0003-987X Google Scholar
A. Sommer, G. W. Lusassen, A. J. H. M. Houben, and M. H. A. Neumann,
“Vasoconstrictive effect of topical applied corticosteroids measured by laser Doppler imaging and reflectance spectroscopy,”
Microvasc. Res., 65 125
–129
(2003). https://doi.org/10.1016/S0026-2862(03)00011-6 0026-2862 Google Scholar
L. Emtestam, N. Kuzmina, and T. Talme,
“Evaluation of the effects of topical clobetasol proprionate by visual score, electrical impedence and laser Doppler flowmetry,”
Skin Res. Technol., 13
(1), 73
–78
(2006). https://doi.org/10.1111/j.1600-0846.2006.00193.x 0909-752X Google Scholar
J. Zhong, A. M. Seifalian, G. E. Salerud, and G. E. Nilsson,
“A mathematical analysis on the biological zero problem in laser Doppler flowmetry,”
IEEE Trans. Biomed. Eng., 45
(3), 354
–364
(1998). https://doi.org/10.1109/10.661160 0018-9294 Google Scholar
M. J. Leahy, F. F. M. de Mul, G. E. Nilsson, and R. Maniewski,
“Principles and practice of the laser-Doppler perfusion technique,”
Technol. Health Care, 7
(2), 143
–162
(1999). 0928-7329 Google Scholar
J. Mobely and T. Vo-Dinh,
“Optical properties of tissue,”
Biomedical Photonics Handbook, Academic Press, Boca Raton
(2003). Google Scholar
A. Jakobsson and G. E. Nilsson,
“Prediction of the sampling depth and photon pathlength in laser Doppler flowmetry,”
Med. Biol. Eng. Comput., 31
(3), 301
–307
(1993). https://doi.org/10.1007/BF02458050 0140-0118 Google Scholar
R. R. Anderson and J. A. Parrish,
“The optics of human skin,”
J. Invest. Dermatol., 77
(1), 13
–19
(1981). https://doi.org/10.1111/1523-1747.ep12479191 0022-202X Google Scholar
S. Hern and P. S. Mortimer,
“Visualization of dermal blood vessels–capillarscopy,”
Clin. Exp. Dermatol., 24
(6), 473
–478
(1999). https://doi.org/10.1046/j.1365-2230.1999.00537.x 0307-6938 Google Scholar
R. Bonner and R. Nossal,
“Model for laser Doppler measurements of blood flow in tissue,”
Appl. Opt., 20
(12), 2097
–2107
(1981). https://doi.org/10.1364/AO.20.002097 0003-6935 Google Scholar
|
||||||||||||||||||||||||||||||||||||||||||||||||||||||||||||||||||||||||||||||||||||||||||||||||||||||||||||||||||||||


