|
|
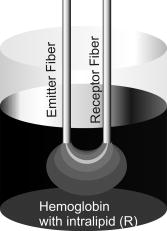
1.IntroductionDiffuse reflectance spectroscopy has been a useful tool for in vivo studies of tissues in both diagnostic and therapeutic applications.1, 2, 3, 4 The technique is based on the spectroscopic analysis of the light reflected from the sample under study by using a pair of optic fibers called optodes, which respectively inject and collect light from the medium. The aim is to determine the concentration of optically absorbing substances (chromophores) from the attenuation of the incident light, taking into account the scattering of the tissue. Despite the important advances made in this field in recent years, leading for example to the design of tissue oxymeters for clinical use,4 the determination of absorber concentrations from spectroscopic measurements continues to be an open problem. Some active research lines in this matter are: the estimation of the optical path length,5 the look-ahead distance or the area under study,6 the comparison of different algorithms to measure oxygen saturation,1 the determination of scattering and absorption coefficients,7, 8 or the simulation of light propagation in tissue using Monte Carlo methods.9, 10 The basic theory of light propagation in tissues was formulated by Twersky.11, 12, 13 This theory is quite complicated for practical use. Several methods are available in the literature to analyze light propagation in biological tissue, to cite some; the adding-doubling method,14 the Kubelka-Munk theory,15 and the already mentioned Monte Carlo simulation.9, 10 Here we present an alternative empirical approach to quantitatively analyze the dependence of the measured absorbance on absorption and scattering processes. The method is based on using in vitro optical tissue-like phantoms: different concentrations of absorbing and scattering substances are mixed, simulating the experimental conditions of biological tissues.1, 2, 3, 4, 5, 6, 7, 8, 9, 10, 16, 17 Hemoglobin has been widely used to simulate absorption, because it is the main absorber in the visible range in biological tissues.1, 2, 3, 4 Other artificial substances such as Nigrosin,7 Trypan blue dye,16 or epoxy resin18 have also been used. Scattering is usually simulated using intralipid or similar lipid suspensions.1, 2, 3, 5, 6, 7, 19, 20, 21 These substances show strong forward scattering and very weak absorption at visible and NIR wavelengths, similar to biological tissues.19, 20, 21 The main drawback is its bottle-to-bottle variation of the optical magnitudes. Other substances like amorphous silica spheres,18 polystyrene micro-spheres,7, 22 or perfluorocarbon2 have also been proposed. A review of in vitro optical tissue-like phantoms for optical spectroscopy has been recently published.23 We have carried out different sets of experiments where the hemoglobin or the intralipid progressively varied their concentration. The analysis of these results allows us to provide an empirical relation of the absorbance as a function of the scattering and absorption coefficients. Moreover, an expression for the optical path length related with these coefficients is also obtained. 2.ExperimentalA drawing of the experimental setup is shown in Fig. 1 . The incident light comes from a tungsten halogen lamp, and the captured light is sent to a spectrometer with a photodiode array detector. The parameters of the used optodes are: core, separation between centers, and 0.22 numerical aperture. The samples were prepared by diluting different concentrations of hemoglobin and intralipid in distilled water. The former was extracted from the blood of a healthy human volunteer and the latter was supplied by Farmacia Ibérica. A magnetic stirrer was used to maintain homogeneity. The experiments were carried out in two groups:
The interval of hemoglobin concentration covers the usual range of interest in biological tissues,1, 2, 5, 18, 24 while the 0 to 5% interval in the intralipid concentration, corresponding, in the visible range of wavelength, to a variation of the reduced scattering coefficient from ,20, 21, 22 is enough to simulate the scattering values reported in the literature for biological tissues.1, 2, 5, 18, 24 The first step was to measure the concentration of hemoglobin without scattering using transmittance spectroscopy. According to the Beer Lambert law, the concentration is given by where is the extinction molar coefficient, is the optical path length (taken here as the width of the cuvette ), and is the absorbance measured by transmittance, as shown in Fig. 2 . We found that, before dilution, the used hemoglobin had a concentration of .Fig. 2Absorbance spectrum of diluted hemoglobin measured by transmittance (continuous) compared with the normalized spectrum reported by Prahl25 (dashed) and setup used, top right. 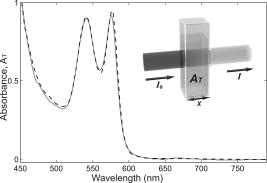 Here the absorbance corresponds to the measurement of the attenuation of the light intensity after passing through the sample in relation with that incident on it where log is the base 10 logarithm. A similar relation is used in the following for reflectance spectroscopy.Figure 2 shows the spectrum of the measured absorbance and a diagram of the used setup. The two well-known peaks of oxyhemoglobin at 542 and are clearly shown. It can be seen that our results are in good agreement with those given by Prahl,25 with minor differences between both spectra due to the fact that our hemoglobin is slightly deoxygenated (94% DeoxyHb). The absorption coefficient can be calculated from the measured absorbance as 3.Variation of Reduced Absorbance with Hemoglobin ConcentrationAs already mentioned, in reflectance spectroscopy, the measured intensity depends on both scattering and absorption processes being difficult to analyze separately. So it is useful to introduce a magnitude that we call reduced absorbance , defined as where the incident radiation is substituted by the intensity measured at the receiver fiber when the concentration of absorbers is zero (only scattering is present).1, 2, 3The reduced absorbance corresponds to the difference between the absorbance for a certain concentration of absorbers , given by Eq. 2, and the absorbance measured if the absorbing particles are removed: This approach is equivalent to the procedure proposed by Knoefel,1, 26 based on the subtraction of the baseline extrapolated from the region of zero absorption, which is the usual way to take the reference for in vivo samples.The use of the reduced absorbance , instead of the absorbance , has the advantage that it is not necessary to measure the input intensity , which is hard to obtain in reflectance spectroscopy. It must also be noted that in this kind of experiment, the instrumental spectral response makes an additional contribution to the raw extinction spectrum as measured by the spectrometers. The process of referencing the measured extinction spectra to purely scattering intralipid phantoms also has the advantage that it removes that instrumental additional contribution. In the first set of experiments, the reference intensity was measured for intralipid concentrations of 0.5, 1, and 2%, without hemoglobin . These reference spectra were used for the calculation of the reduced absorbance when the hemoglobin was subsequently increased. The results for the particular fixed 0.5% intralipid concentration are plotted in Fig. 3 . An increase of the reduced absorbance with the hemoglobin concentration is observed for wavelengths under , without appreciable changes over the wavelength range. Fig. 3Reduced absorbance spectra for 0.5% intralipid (fixed scattering) and different hemoglobin concentrations from . 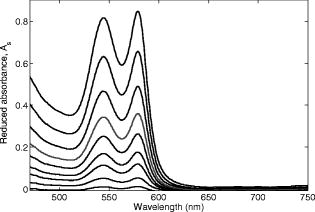 We have selected the peak to monitor the variation of the reduced absorbance with the absorption coefficient previously calculated through Eq. 3. The results are shown in Fig. 4 for two different intralipid concentrations of 0.5 and 2%. A linear behavior is observed in the log-log plot that corresponds to the following power law for , where and are parameters obtained from the fitting.Fig. 4Log-log plot of the in vitro measurements of the reduced absorbance at versus the absorption coefficient, linear fits are also shown. 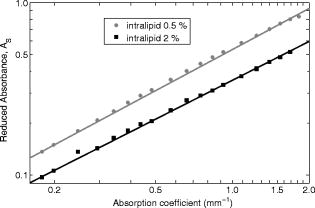 We have analyzed the dependence of these and parameters with the intralipid concentration and hence with the reduced scattering coefficient. The results are shown in Fig. 5 . The plot was made selecting the wavelengths of 460, 542, and to obtain three different values of the reduced scattering coefficient for each intralipid concentration. The dependence of the reduced scattering coefficient on wavelength and intralipid concentration was taken from Staveren 20 Fig. 5Variation of and parameters with reduced scattering coefficient. Circles, squares, and triangles represent respectively values for 0.5, 1, and 2% intralipid concentrations.  Figure 5 shows that the exponent does not appreciably change when the reduced scattering coefficient varies from . This corresponds with the small variation of the slope in the log-log plot shown in Fig. 4. Assuming a mean value , the dependence of the reduced absorbance on the absorption coefficient can be expressed as It is important to realize that this result leads to a nonlinear relation between absorbance and absorber concentration, which significantly differs from the Beer Lambert law, which has frequently been used to calculate relative changes of chromophore concentrations in reflectance spectroscopy.4.Variation of Reduced Absorbance with Intralipid ConcentrationIn the second set of measurements, the intralipid concentration was continuously increased from 0.1 to 5% for different fixed hemoglobin concentrations (0, 40, 80, and ). In Fig. 6 it can be observed that the reduced absorbance decreases with increasing intralipid concentration. This is due to the fact that the probability of catching photons at the receptor fiber grows with the concentration of scattering particles (as previously mentioned, scattering increases linearly with intralipid concentration). Notice that 0% of intralipid produces no reflectance, i.e., . Fig. 6Evolution of reduced absorbance for a fixed oxyhemoglobin concentration of and different intralipid concentrations from 0.1% (top) to 5% (bottom).  The variation of the reduced absorbance at with the reduced scattering coefficient is plotted in Fig. 7 for two different values of the absorption coefficient. The log-log plot shows a linear behavior, so the relationship between the reduced absorbance and the reduced scattering coefficient can also be described by a power law: where and are parameters obtained from the fitting.Fig. 7Log-log plot and linear fit of the in vitro reduced absorbance at versus reduced scattering coefficient for two different hemoglobin concentrations.  Figure 7 shows that the slope of the fits, corresponding to the parameter in Eq. 8, is almost unchanged in the different sets of experiments, with , which means that this parameter does not change appreciably with the hemoglobin concentration. By the opposite, the -intercept point varies appreciably, with values of 0.34, 0.46, and 0.52 for hemoglobin concentrations of 40, 80, and , respectively. It would be remarked from Fig. 7 that the reduced absorbance increases when the reduced scattering coefficient decreases, while it increases with the absorption coefficient, as shown in Fig. 4. Combining the results from both sets of experiments [see Eqs. 6, 8], we reach the conclusion that for each optode geometric configuration, the reduced absorbance can be written as being, finally, , , and parameters that depend only on the used optode geometry. It would be remarked that these three parameters are not wavelength dependent. For our particular geometric configuration, Eq. 9 stays likeWe have taken different measurements varying the relative position of the fibers in the optode, as well as using a setup with 24 optodes for simultaneous multipoint monitoring. In all cases, the double power law, given by Eq. 9, resulted as valid, with different values for the , and parameters (data not shown here).5.Path Length DeterminationThe estimation of the path length is a key issue in diffuse reflectance spectroscopy, because it provides information about the extension of the sample under study. Moreover, this magnitude is useful because it relates absorbance and absorption coefficients in the modified Beer Lambert law.27, 28 The path length can be evaluated from the reduced absorbance by,27 which in our case, using Eq. 9, leads toand finally, for our particular optode geometry, with the parameter values given in Eq. 10, stays likeResults obtained using Eq. 13 are depicted in Fig. 8 as a function of the absorption coefficient for three different reduced scattering coefficients, covering the range of values of biological interest. It is noteworthy that the path length decreases appreciably when absorption increases for a fixed reduced scattering coefficient. This can be understood by taking into account that photons following long paths, as shown in Fig. 1, have a greater probability of being absorbed than photons traveling shorter paths. In other words, the increase of the absorber concentration leads to the predominance of the short paths. As a result, the mean path covered by the photons decreases when absorption grows.Fig. 8Dependence of the path length on the absorption coefficient for three different reduced scattering coefficients, using Eq. 12.  It would also be remarked that the results obtained for the path length are mainly from , which is 1 order of magnitude larger than the distance between the centers of the optical fibers in the used optode . This indicates that the area of the sample explored in our measurements is relatively deep. Finally, it must be noted that the definition of the path length has been the subject of discussion and several attempts have been made to provide an adequate approach that allows us to use a modified version of the Beer Lambert law. A definition, alternative to Eq. 11, is29, 30, 31 which is related to Eq. 11 as27 The definition in Eq. 13 corresponds to the average of the paths followed by the photons when it is calculated by Monte Carlo simulation. A detailed comparison of measured and simulated path lengths, with clarification about the different path length definitions, will be presented in a forthcoming paper.6.ConclusionsIn vitro solutions of hemoglobin (absorber) and intralipid (scatterer) are systematically analyzed by means of reflectance diffuse spectroscopy, with the aim of obtaining a representative and simple relation between the absorbance and the coefficients of absorption and scattering. Results are in fairly good agreement with a power law for the dependence of the reduced absorbance on the coefficients of absorption and scattering. The proposed empirical relation includes three parameters that should be determined for each particular optode geometry, following the method described in this work. It is important to remark that these three parameters do not depend on the wavelength, which very much simplifies the application of this empirical relation. From this empirical relation, an expression is derived for the path length, also as a function of the absorption and reduced scattering coefficients. Values for the path length were calculated from this empirical expression to estimate the variation of this parameter in biological tissues. This equation where absorbance is related with scattering and absorption coefficients is the simplest and most straightforward relation among these magnitudes that, as far as we know, exists in the literature. This equation and the associated path length equation greatly clarify how these magnitudes are related. From our point of view, all this constitutes an important step toward the understanding of reflectance spectroscopy in turbid media like biological tissue. Although our work was made using in vitro samples, the results reported can be applied to real tissue where nearly homogeneous optical conditions can be assumed, as it happens in many areas of the brain. These results represent a significant step in determining the absolute concentration of chromophores in vivo using reflectance diffuse spectroscopy. AcknowledgmentsThis work was supported by “Ministerio de Industria, Turismo y Comercio,” grant FIT-350300-2007-096 and EUROPEAN COMMISSION—INFSO—E5 (2006), FP6-027063-CASBliP; and “Consejería de Educación Cultura y Deportes del Gobierno de Canarias” project, PI042007/024. ReferencesJ. Gade, D. Palmqvist, P. Plomgard, and G. Greisen,
“Diffuse reflectance spectrophotometry with visible light: comparison of four different methods in a tissue phantom,”
Phys. Med. Biol., 51 121
–136
(2006). https://doi.org/10.1088/0031-9155/51/1/009 0031-9155 Google Scholar
C. Sato, M. Nemoto, and M. Tamura,
“Reassessment of activity-related optical signals in somatosensory cortex by an algorithm with wavelength dependent path length,”
Jpn. J. Physiol., 52 301
–312
(2002). https://doi.org/10.2170/jjphysiol.52.301 0021-521X Google Scholar
B. Chance, H. Liu, T. Kitai, and Y. Zhang,
“Effects of solutes on optical properties of biological materials: models, cells, and tissues,”
Anal. Biochem., 227 351
–362
(1995). https://doi.org/10.1006/abio.1995.1291 0003-2697 Google Scholar
D. A. Benaron and I. H. Parachikov,
“Design of a visible-light spectroscopy clinical tissue oximeter,”
J. Biomed. Opt., 10
(4), 044005-1-9
(2005). https://doi.org/10.1117/1.1979504 1083-3668 Google Scholar
D. T. Delpy, M. Cope, P. van der Zee, S. Arridge, S. Wray, and J. Wyatt,
“Estimation of optical pathlength through tissue from direct time of flight measurement,”
Phys. Med. Biol., 33 1433
–1442
(1988). https://doi.org/10.1088/0031-9155/33/12/008 0031-9155 Google Scholar
Z. Qian, S. Victor, Y. Gu, C. Giller, and H. Liu,
“Look-ahead distance of a fiber probe used to assist neurosurgery: Phantom and Monte Carlo study,”
Opt. Express, 11 1844
–1855
(2003). 1094-4087 Google Scholar
D. Sharma, A. Agrawal, S. Matchette, and J. Pfefer,
“Techniques for reflectance-based determination of optical, properties in highly attenuating turbid media,”
1651
–1653
(2005). Google Scholar
R. M. P. Doornbos, R. Lang, M. C. Aalders, F. W. Cross, and H. J. C. M. Sterenborg,
“The determination of in vivo human tissue optical properties and absolute chromophore concentrations using steady state diffuse reflectance spectroscopy,”
Phys. Med. Biol., 44 967
–981
(1999). https://doi.org/10.1088/0031-9155/44/4/012 0031-9155 Google Scholar
M. Kohl, U. Lindauer, G. Royl, M. Kühl, L. Gold, A. Villringer, and U. Dirnagl,
“Physical model for the spectroscopic analysis of cortical intrinsic optical signals,”
Phys. Med. Biol., 45
(12), 3749
–3764
(2000). https://doi.org/10.1088/0031-9155/45/12/317 0031-9155 Google Scholar
S. A. Prahl, M. Keijzer, S. L. Jacques, and A. J. Welch,
“A Monte Carlo model of light propagation in tissue,”
Dosimetry of Laser Radiation in Medicine and Biology, 102
–111
(1989) Google Scholar
V. Twersky,
“Multiple scattering of waves and optical phenomena,”
J. Opt. Soc. Am., 52 145
–171
(1962). https://doi.org/10.1364/JOSA.52.000145 0030-3941 Google Scholar
V. Twersky,
“Absorption and multiple scattering by biological suspensions,”
J. Opt. Soc. Am., 60 1084
–1093
(1970). https://doi.org/10.1364/JOSA.60.001084 0030-3941 Google Scholar
V. Twersky,
“Interface effects in multiple scattering by large, low-refracting absorbing particles,”
J. Opt. Soc. Am., 60 908
–914
(1970). https://doi.org/10.1364/JOSA.60.000908 0030-3941 Google Scholar
S. A. Prahl, M. J. C. van Gemert, and A. J. Welch,
“Determining the optical properties of turbid media by using the adding-doubling method,”
Appl. Opt., 32 559
–568
(1993). https://doi.org/10.1364/AO.32.000559 0003-6935 Google Scholar
P. Kubelka and F. Munk,
“Ein beitrag zur optik der farbanstriche,”
Z. Tech. Opt., 11 593
–611
(1931). Google Scholar
A. Kienle, L. Lilge, M. S. Patterson, R. Hibst, R. Steiner, and B. C. Wilson,
“Spatially resolved absolute diffuse reflectance measurements for noninvasive determination of the optical scattering and absorption coefficients of biological tissue,”
Appl. Opt., 35
(13), 2304
–2314
(1996). https://doi.org/10.1364/AO.35.002304 0003-6935 Google Scholar
E. Drakaki, S. Psycharakis, M. Makropoulou, and A. A. Serafetinides,
“Optical properties and chromophore concentration measurements in tissue-like phantoms,”
Opt. Commun., 254 40
–51
(2005). https://doi.org/10.1016/j.optcom.2005.05.013 0030-4018 Google Scholar
M. Firbank, M. Oda, and D. T. Delpy,
“An improved design for a stable and reproducible phantom material for use in near-infrared spectroscopy and imaging,”
Phys. Med. Biol., 40
(5), 955
–961
(1995). https://doi.org/10.1088/0031-9155/40/5/016 0031-9155 Google Scholar
S. T. Flock, S. L. Jacques, B. C. Wilson, W. M. Star, and M. J. C. van Gemert,
“Optical properties of intralipid: a phantom medium for light propagation studies,”
Lasers Surg. Med., 12 510
–519
(1992). https://doi.org/10.1002/lsm.1900120510 0196-8092 Google Scholar
H. G. van Staveren, C. J. M. Moes, J. van Marle, S. A. Prahl, and M. J. C. van Gemert,
“Light scattering in Intralipid-10% in the wavelength range of 400–1100 nanometers,”
Appl. Opt., 30 4507
–4514
(1991). https://doi.org/10.1364/AO.30.004507 0003-6935 Google Scholar
I. Driver, J. W. Feather, P. R. King, and J. B. Dawson,
“The optical properties of aqueous suspensions of Intralipid, a fat emulsion,”
Phys. Med. Biol., 34
(12), 1927
–1930
(1989). https://doi.org/10.1088/0031-9155/34/12/015 0031-9155 Google Scholar
Y. L. Kim, Y. Liu, R. K. Wali, H. K. Roy, M. J. Goldberg, A. K. Kromin, K. Chen, and V. Backman,
“Simultaneous measurement of angular and spectral properties of light scattering for characterization of tissue microarchitecture and its alteration in early precancer,”
IEEE J. Sel. Top. Quantum Electron., 9 243
–256
(2003). https://doi.org/10.1109/JSTQE.2003.814183 1077-260X Google Scholar
B. W. Pogue and M. S. Patterson,
“Review of tissue simulating phantoms for optical spectroscopy, imaging and dosimetry,”
J. Biomed. Opt., 11
(4), 041102
(2006). https://doi.org/10.1117/1.2335429 1083-3668 Google Scholar
W. F. Cheong, S. A. Prahl, and A. J. Welch,
“A review of the optical properties of biological tissues,”
IEEE J. Quantum Electron., 26
(12), 2166
–2185
(1990). https://doi.org/10.1109/3.64354 0018-9197 Google Scholar
S. Prahl,
“Compiled tabulated molar extinction coefficient for hemoglobin in water,”
http://omlc.ogi.edu/spectra/hemoglobin/moaveni.html Google Scholar
J. M. Schmitt,
“optical measurement of blood oxygenation by implantable telemetry,”
Google Scholar
M. K. Moaveni,
“A multiple scattering field theory applied to whole blood,”
(1970). Google Scholar
W. T. Knoefel, N. Kollias, D. W. Rattner, N. S. Nishioka, and A. L. Warshaw,
“Reflectance spectroscopy of pancreatic microcirculation,”
J. Appl. Physiol., 80 116
–123
(1996). 8750-7587 Google Scholar
A. Sassaroli and S. Fantini,
“Comment on the modified Beer-Lambert law for scattering media,”
Phys. Med. Biol., 49 N255
–N257
(2004). https://doi.org/10.1088/0031-9155/49/14/N07 0031-9155 Google Scholar
L. Kocsis, P. Herman, and A. Eke,
“The modified Beer-Lambert law revisited,”
Phys. Med. Biol., 51 N91
–N98
(2006). https://doi.org/10.1088/0031-9155/51/5/N02 0031-9155 Google Scholar
A. Duncan, J. H. Meek, M. Clemence, C. E. Elwell, L. Tyszczuk, M. Cope, and D. Delpy,
“Optical path length measurements on adult head, calf and forearm and the head of newborn infants using phase resolved spectroscopy,”
Phys. Med. Biol., 40 295
–304
(1995). https://doi.org/10.1088/0031-9155/40/2/007 0031-9155 Google Scholar
M. Kohl, C. Nolte, H. R. Heekeren, S. Horst, U. Scholz, H. Obrig, and A. Villringer,
“Determination of the wavelength dependence of the differential pathlength factor from near-infrared pulse signals,”
Phys. Med. Biol., 43
(6), 1771
–1782
(1998). https://doi.org/10.1088/0031-9155/43/6/028 0031-9155 Google Scholar
M. Hiraoka, M. Firbank, M. Essenpreis, M. Cope, S. R. Arridge, P. van der Zee, and D. Delpy,
“A Monte Carlo investigation of optical pathlength in inhomogeneous tissue and its application to near-infrared spectroscopy,”
Phys. Med. Biol., 38 1859
–1876
(1993). https://doi.org/10.1088/0031-9155/38/12/011 0031-9155 Google Scholar
|