|
|
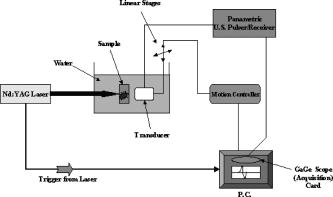
1.IntroductionPhotoacoustic tomography is a multimodality imaging technique that utilizes nonionizing energy to obtain both structural and functional information. Heterogeneous absorption of optical energy results in differentially expressed acoustic signals that can yield both spatial and temporal information about the biological tissues being investigated. Structural information can be obtained, for example, from the fact that rapidly developing tumors consume more blood and that the most malignant tumors have higher optical absorption.1 An example of how functional information can be conveyed is demonstrated in the photoacoustic spectra of oxygenated and deoxygenated hemoglobin, which differ in the near-infrared range. Researchers are able to determine the state of oxygenation via photoacoustic techniques and are investigating methods to detect differences in oxygen consumption across tissues. Similar techniques may aid in distinguishing benign from malignant tissue in the near future.2 Photoacoustic imaging may also play a significant role in early detection and monitoring of breast cancer, a disease that affects one out of every eight women over a life span.3 The normal breast is acoustically fairly homogenous, facilitating the photoacoustic detection of calcified or highly vascularized breast lesions. These structures may become more efficient absorbers of laser energy due to either increased blood flow or targeting via contrast agents. Photoacoustic breast imaging of suspicious lesions may prove a useful alternative or adjunct to X-ray mammography. An inherent advantage to photoacoustic detection of tumor masses is the generation of a photoacoustic signal without the need to use ionizing radiation or radioactive nuclides for detection.4 Although photoacoustic imaging is closely related to ultrasound, there are important differences inherent in the use of optical energy to generate ultrasound waves. Perhaps the most significant difference is the fact that acoustic waves are generated in the tissue by laser energy, creating contrast in a manner unique from ultrasound. In ultrasound imaging, contrast is created by external acoustic energy being focused on the tissue via ultrasound transducers. In biomedical photoacoustic imaging, nanosecond laser pulses focused on a particular volume of tissue cause rapid heating, which leads to thermoelastic tissue expansion and mechanical stress.5 When laser energy is focused on the tissue, light is scattered and absorbed. Photoacoustic stress generation is the result of the locally absorbed or deposited volumetric energy density, producing a temperature increase. Because the laser pulse duration is smaller than the propagation time of the pressure-generated acoustic transient, instead of an initial volume expansion, a local stress transient is induced , where is the initial pressure (in Pascals), the bulk modulus (in Pascals per strain), the expansivity (strain per degree Celsius), the density (in kilogram per cubic meter), the specific heat capacity (in joules per kilogram-Celsius), absorption coefficient (in inverse centimeters), and the surface radiant exposure (millijoules per centimeters squared). In satisfying conditions for stress confinement, efficient heat-to-pressure conversion and subsequent sound generation is possible.6 Mapping of a tissue’s absorbed energy distribution is achieved by measuring the tissue’s acoustic profile in response to laser irradiation. Ultrasound transducers are used to detect the mechanically generated acoustic wave signals at the sample surface. There is a growing body of literature describing the use of contrast agents for photoacoustic imaging. Probes used experimentally for photoacoustic imaging include organic dye–embedded silica nanoparticles,7 quantum dots,8 carbon nanotubes,9 and gold colloids (such as gold covered silica nanoshells,10 gold nanorods,11 and gold nanocages).12 In addition, microsphere contrast agents—prepared for optical coherence tomography, light microscopy, and reflectance confocal microscopy—may find application in photoacoustic imaging with modification.13 We tested the hypothesis that dye-labeled protein microspheres that are submicron in size (submicrospheres) respond to laser stimulation by thermoelastically generated sound production. The primary goal of this study is to demonstrate the utility of dye-labeled protein submicrospheres for improved photoacoustic signal generation. This proof-of-concept study demonstrates that laser stimulation of dye-labeled protein submicrospheres leads to photoacoustic signal generation. Toward this aim we will explore the enhancement in signal amplitude gained by conversion of fluorescein-isothiocyanate (FITC) elastin, a dye-labeled protein, to FITC-elastin submicrospheres, dye-labeled spherical proteins capable of laser-induced ultrasound generation. 2.MethodsThree experimental samples were analyzed using a phantom vessel under either ultrasound or laser stimulation: water, an aqueous solution of elastin covalently labeled with fluorescein-isothiocyanate (FITC-elastin solution), and FITC-labeled elastin submicrospheres (FITC-elastin submicrospheres). FITC elastin was purchased from Elastin Products Company, Inc., (Owensville, Missouri). As reported by the manufacturer, the dye concentration is FITC per milligram of elastin, corresponding to FITC molecules per elastin molecule. A 10% FITC-elastin solution containing 0.05 M FITC was used in experiments without further modification. FITC-elastin submicrospheres, containing FITC, were synthesized using a modified water-in-oil polymerization method and ultrasonic irradiation at . Typically, a 65-fold dilution of FITC elastin was incorporated into FITC-elastin submicrospheres. Subsequent to filtered centrifuge membrane dialysis, a further 100-fold dilution resulted in the final concentration used in experiments ( submicrospheres per milliliter). FITC-elastin submicrosphere size and potential were determined by dynamic laser light scattering using a ZetaPALS particle size analyzer (Brookhaven Instruments Limited, Worcestershire, UK). The absorbance spectra of FITC-elastin solution and FITC-elastin submicrospheres were obtained using a ultraviolet-visual (UV-vis) spectrophotometer (Lambda 25, PerkinElmer). The test samples were assayed in a phantom vessel (PE tubing: id , od ) immersed in water for coupling of the induced acoustic signals. Figure 1 shows a schematic of the photoacoustic measurements apparatus. The photoacoustic waves are generated with a neodymium-doped yttrium aluminum garnet (Nd:YAG) laser (Brilliant B, Quantel) operating at at a repetition rate of . The maximum energy per pulse is specified to be at in the Q-Switched mode. The pulse duration is on the order of . The laser beam was expanded by a lens and delivered to the sample after passing through a Plexiglas water tank. The pulse energy density was controlled to be in order to simulate the conditions under which a laser beam can be delivered to the skin under maximum permissible exposure (ANSI 2000). An ultrasonic transducer detects the photoacoustically generated waves. In our experiments, a single element longitudinal wave immersion transducer (Panametrics-NDT, A304S-SU) was used. The transducer has a center frequency of [ , beam diameter ] with an element diameter of 1.0 and a focal length of The transducer was found to be particularly useful in resolving submillimeter structures. The arrangement for photoacoustic studies is in the forward measurement mode (i.e., the sample is positioned directly in-between the laser source and the acoustic detector). The transducer was scanned along the vertical axis using a stepper motor-based linear stage (Newport Research Corporation, Mountain View, CA) and in one of the horizontal axes using a dc servomotor-controlled linear stage (Newport Research Corporation) and a Newport ESP300 controller/driver. The second horizontal axis (along the transducer axial direction/focal axis) was manually controlled using a micrometer screw. A Panametrics ultrasonic pulser/receiver unit drove the transducer, which was capable of operating in the pulse echo, through-transmission, and external pulser modes. The signal acquisition from the transducer was performed by a PCI-based CompuScope 14200 card (Gage Applied Technologies) with two synchronous channels at , resolution. The CompuScope card was used in conjunction with the PC-based GageScope, an accompanying oscilloscope and signal-capture application software. LabVIEW software was used to control the individual hardware components and keep them precisely synchronized. The main functionality of the software was line-by-line recording of the radio-frequency (rf) signals in addition to the positioning and the real-time single-line capture capabilities. At each position of the transducer, an rf signal (or an average of several signals) was acquired by the GaGe card. The receiver gating was determined by and synchronized with the laser firing. Real-time monitoring mode was also used during the phantom-transducer alignment process. In this mode, the photoacoustic rf signals for each laser firing are displayed in real time. In addition, the motion controller could be controlled independently, allowing good alignment capabilities. Ultrasound imaging studies utilized the same setup; however, the transducer provides both the exciting pulse, via the pulser receiver, and detection. Ultrasound and photoacoustic measurements were performed sequentially, without moving the sample, so that the two sets of measurements are spatially registered. 3.ResultsAbsorbance spectra of both FITC-elastin solution [Fig. 2a ] and FITC-elastin submicrospheres [Fig. 2b] show a relatively broad maxima at with significant values also present at . Dynamic light scattering reveals that FITC-elastin submicrospheres are monodisperse with a mean diameter of and 100% having a diameter ranging from . The potential for FITC-elastin submicrospheres is . The submicrospheres remained stable physicochemically (size, charge, laser absorbance) after several months of experimentation. Figure 3 demonstrates the photoacoustic signal intensities of water [Fig. 3a] FITC-elastin solution [Fig. 3b] and FITC-elastin submicrospheres [Fig. 3c] contained in experimental phantom vessels. As anticipated, water does not produce a photoacoustic signal. The FITC-elastin solution exhibits low signal amplitude; however, a distinctive photoacoustic profile is detected. The photoacoustic signal of FITC-elastin submicrospheres retains the distinctive morphology of the FITC-elastin solution. A distinguishing characteristic, however, is the almost two orders of magnitude increase in signal amplitude observed with FITC-elastin submicrospheres as compared to FITC-elastin solution ( and , respectively), corresponding to higher mean signal intensity. This is despite the four orders of magnitude decreased FITC-elastin concentration in the submicrosphere preparation versus the (10%) FITC-elastin solution. The photoacoustic images of phantom vessels containing water [Fig. 3d], FITC-elastin solution [Fig. 3e], and FITC-elastin submicrospheres [Fig. 3f] are also presented. Water provides little contrast due to the absence of absorbers, rendering the phantom vessel barely discernible. The photoacoustic image of a phantom vessel containing FITC-elastin solution has a mean signal intensity higher than that of water. FITC-elastin submicrospheres provide even greater improvement in contrast with a mean signal intensity higher than that of water. Despite having a lower overall absorber concentration, FITC-elastin submicrospheres demonstrate discernibly greater contrast than the FITC-elastin solution. Fig. 3(a) Photoacoustic signal of water, (b) FITC-elastin solution, and (c) FITC-elastin submicrospheres acquired with a transducer. Also shown is the two-dimensional sagittal photoacoustic images of (d) water, (e) FITC-elastin solution, and (f) FITC-elastin submicrospheres in the phantom vessel (PE tubing: i.d. , o.d. ). The color bar indicates photoacoustic intensity of the signal in megavolts.  Ultrasound experiments involving the test solutions in phantom vessels permit comparison of the mean ultrasound backscatter signal intensities from several A-lines (Fig. 4 ). These plots demonstrate increased signal amplitude from FITC-elastin solution [ , Fig. 4b] and FITC-elastin submicrospheres [ , Fig. 4c] when compared to water [ , Fig. 4a]. In the case of the FITC-elastin solution, the increased backscatter signal is likely due to an impedance mismatch resulting from increased viscosity. The enhanced signal amplitude for FITC-elastin submicrospheres is due to its efficiency as an ultrasound backscatterer even at low submicrosphere concentration. The ultrasound B-mode images of the phantom vessel containing water [Fig. 4d], FITC-elastin solution [Fig. 4e], and FITC-elastin submicrospheres [Fig. 4f] are also presented. Both FITC-elastin solution and FITC-elastin submicrospheres provide higher mean signal intensity than water. Despite significant differences in concentration and viscosity, there is little discernible difference in contrast between the FITC-elastin solution and FITC-elastin submicrospheres. Fig. 4Ultrasound signal of (a) water, (b) FITC-elastin solution, and (c) FITC-elastin submicrospheres, pulsed and acquired with a transducer. The two-dimensional axial ultrasound B-mode images of (d) water, (e) FITC-elastin solution, and (f) FITC-elastin submicrospheres in the phantom vessel (PE tubing: i.d. , o.d. ) is also shown. The color bar indicates ultrasound backscatter in megavolts.  4.DiscussionThe biophysical structure and biochemical makeup of a material determines its oscillatory behavior when perturbed from equilibrium.14 Distensible microspherical particles stimulated by laser excitation may exhibit complex periodic motions involving a variety of modes of oscillation in aqueous medium or blood. This periodic disturbance will be conveyed through the medium in all directions—with some of its energy being converted to sound waves—at the frequency of the perturbed particles oscillations.15 Asymmetrical shape distortion and the effects of intrinsic (to the particle) restoring and extrinsic (i.e., due to the medium) frictional forces may lead to the generation of oscillations both at a fundamental frequency and its harmonics. It is possible to drive dye-labeled spherical photoacoustic contrast agent thermoelastic expansion via manipulation of laser pulse characteristics and contrast agent properties. At the most basic level, matching the pulsed laser excitation wavelength to the dyes’ absorption peak results in pulsed thermoelastic oscillation. This process is made more efficient by utilizing submicron-sized photoacoustic probes with a unimodal size distribution. The probes’ physical characteristics (distensibility, density, etc.) and the surrounding liquid or tissue properties will determine the acoustical behavior of submicron photoacoustic contrast agents. A distinct photoacoustic response pattern was anticipated for protein submicrospheres composed of elastin, due to the distensible nature of the biomaterial and the spherical morphology of the agent. Photoacoustic signal enhancement was observed in FITC-elastin submicrospheres even though laser illumination was at and not at the absorption maximum of FITC. If the laser frequency/dye-specific excitation and spherical probe size and composition-dependent thermoelastic response can be matched, then it is anticipated that an even greater signal amplitude can be achieved. Photoacoustic signals can be generated via several absorption mechanisms, such as electrostriction, thermal expansion, ablation, and cavitation.16 However, at laser power densities below the vaporization threshold, thermoelastic expansion is the dominant mechanism. These experiments were conducted at laser energies of , making cavitation, dielectric breakdown, or vapor bubble formation unlikely. An important consideration is the stability of photoacoustic contrast agents to repeated laser excitation. FITC-elastin submicrospheres have been found to be morphologically stable even months after acoustic and photoacoustic stimulation. Photoacoustic signals are generated by the absorption of light in a restricted volume followed by thermal expansion and subsequent thermal relaxation. An initial stress pressure results from the induced temperature increase, which is linearly proportional to the absorbed energy density. This photoacoustic transient propagates through the sample with a shape function dependent on the absorption distribution and amplitude proportional to the absorbed optical energy.17 The test sample used in our experiments consists of a phantom vessel containing either water, FITC-elastin in aqueous solution, or FITC-elastin submicrospheres in aqueous solution. The cylindrical phantom vessel can be viewed as an extended-point source distribution made up of multiple small elementary source volumes.18 Each of these source volumes contribute to the overall acoustic profile by linear superposition of the individual signals, each with different delay times and attenuation. In general, spherical point sources generate a bipolar photoacoustic signal with an initial positive compression, a zero crossing point, and a negative rarefaction signal arriving last. In addition, the peak-to-peak time interval is dependent on the laser pulse width and the time for acoustic propagation through the source to the detector. The A-line plot for FITC-elastin solution reveals a distinctive photoacoustic profile albeit at a comparatively low signal amplitude. The plotted A-line for FITC-elastin submicrospheres similarly reveal a distinctive morphology. However, an increase in signal amplitude of almost two orders of magnitude, despite four orders of magnitude decreased FITC-elastin concentration, highlights a potential benefit of utilizing FITC-elastin submicrosphere contrast agents for photoacoustic imaging. The photoacoustic signal from FITC-elastin submicrospheres shows multiple poles with sharp, narrow compression and rarefaction peaks followed by a more broadened second compression peak and trailing subpeaks that are smaller in amplitude. The FITC-elastin submicrosphere photoacoustic waveform has an altered exponential profile for each compression. From this detected pressure profile, it may be possible to derive the average radial absorption distribution and ultimately develop algorithms that would permit reconstruction of photoacoustic contrast agent absorption distribution in optically scattering media, such as tissue.19 Photoacoustic images of FITC-elastin submicrospheres show clear delineation of the phantom vessel wall. Possible explanations for the increase in photoacoustic signal amplitude of FITC-elastin submicrospheres in comparison to FITC-elastin solution include (i) closer packing of FITC-elastin in submicrospheres causes greater quenching of fluorescence and subsequently greater thermal coupling and (ii) the water reservoir is large in the case of “free” FITC-elastin resulting in more rapid dissipation of laser-induced heating. By comparison, the environment enclosed by the FITC-elastin submicrosphere shell may act as a thermal insulator, increasing heat generation and deposition. Protein submicrospheres can also perform as contrast-enhancing agents in “traditional” ultrasound imaging. Although the main focus of this study is the utility of FITC-elastin submicrospheres for photoacoustic signal enhancement, it is noteworthy that protein submicrospheres provide an ultrasound backscatter intensity similar to FITC-elastin solution despite orders-of-magnitude decreased concentration. In addition, preliminary evidence of nonlinearity has led us to explore their potential use in contrast-enhanced harmonic imaging.20 This function may prove advantageous in the use of ultrasound as a scouting technique, for identifying regions of interest, prior to photoacoustic imaging. In summary, we report preliminary studies on the development and characterization of dye-labeled, submicrosphere photoacoustic contrast agents. These probes are unimodal in size distribution, on the order of in diam, and are capable of emitting sizable echoes in response to ultrasound stimulation and an even greater increase in the signal to background in response to pulsed laser excitation. The increase in signal amplitude is due in part, to the low density and great compressibility of the protein submicrospheres subsequent to oil and/or air incorporation. In addition, the great elasticity and strong restoring forces of the elastin shell likely results in a sizable relative expansion ratio and, therefore, large amplitude of response to increasing driving pressure. Our studies show an increase in photoacoustic and ultrasound signal amplitude of FITC-elastin submicrospheres relative to FITC-elastin solution and water. The analysis of photoacoustic signal generation in, and in comparison to, aqueous solution is important for photoacoustic tissue imaging due to tissues having many characteristics close to those of water. The main sources of photoacoustic signal attenuation in aqueous media subsequent to photoacoustic generation are thermal conduction losses and viscous losses.21 Future studies will explore the behavior of protein submicrospheres in biological systems such as whole blood and ex vivo tissues. FITC would make a poor choice for use in vivo due to its short wavelength, low extinction coefficient, and overlap with hemoglobin absorption. However, some of the advantages presented by protein submicrospheres include (i) the ability to utilize any dye as an absorber, (ii) the capability to convert apparently any protein into a submicrosphere while keeping most, if not all, of the protein’s native function intact, and (iii) being able to encapsulate nanoparticles, genes, and drugs so as to extend functionality. The latter property allows one to utilize submicrospheres as delivery vehicles capable even of encapsulating other photoacoustic contrast agents (e.g., gold colloids or quantum dots). Protein submicrospheres are anticipated to be less toxic than photoacoustic contrast agents such as carbon nanotubes and quantum dots. In addition, submicrospheres are easily surface modified (via, for example, PEGylation) if desired. Investigations have been initiated demonstrating the utility of protein submicrospheres for cancer cell targeting, gene delivery, and gene expression in vitro. AcknowledgmentM.A.M. acknowledges Michael Pashley, Philips Research USA, for his generosity of time, expertise, and commitment to the photoacoustic project. ReferencesC. A. DiMarzio and T. W. Murray,
“Medical imaging techniques combining light and ultrasound,”
Subsurface Sensing Technologies and Application, 4
(4), 289
–309
(2003). https://doi.org/10.1023/A:1026300631323 Google Scholar
F. A. Marks, H. W. Tomlinson, and G. W. Brooksby,
“A comprehensive approach to breast cancer detection using light: photon localization by ultrasound modulation and tissue characterization by spectral discrimination,”
Proc. SPIE, 1888 500
–510
(1993). https://doi.org/10.1117/12.154670 0277-786X Google Scholar
L. A. G. Ries, M. P. Eisner, C. L. Kosary, B. F. Hankey, B. A. Miller, L. Clegg, A. Mariotto, E. J. Feuer, and B. K. Edwards, SEER Cancer Statistics Review, 1975-2002,
(2005) Google Scholar
R. A. Kruger, W. L. Kiser, K. D. Miller, H. E. Reynolds, D. R. Reinecke, G. A. Kruger, and P. J. Hofacker,
“Photoacoustic ultrasound (PAUS)-reconstruction tomography,”
Med. Phys., 22 1605
–1609
(1995). https://doi.org/10.1118/1.597429 0094-2405 Google Scholar
G. Ku, X. Wang, G. Stoica, and L. V. Wang,
“Multiple-bandwidth photoacoustic tomography,”
Phys. Med. Biol., 49 1329
–1338
(2004). https://doi.org/10.1088/0031-9155/49/7/018 0031-9155 Google Scholar
M. Xu and L. V. Wang,
“Time-domain reconstruction for thermoacoustic tomography in a spherical geometry,”
IEEE Trans. Med. Imaging, 21
(7), 814
–822
(2002). https://doi.org/10.1109/TMI.2002.801176 0278-0062 Google Scholar
G. Kim, S. W. Huang, K. C. Day, M. O’Donnell, R. R. Agayan, M. A. Day, R. Kopelman, and S. Ashkenazi,
“Indocyanine-green-embedded PEBBLEs as a contrast agent for photoacoustic imaging,”
J. Biomed. Opt., 12
(4), 044020
(2007). https://doi.org/10.1117/1.2771530 1083-3668 Google Scholar
E. V. Shashkov, M. Everts, E. I. Galanzha, and V. P. Zharov,
“Quantum dots as multimodal photoacoustic and photothermal contrast agents,”
Nano Lett., 8
(11), 3953
–3958
(2008). https://doi.org/10.1021/nl802442x 1530-6984 Google Scholar
V. P. Zharov, E. I. Galanzha, E. V. Shashkov, J. W. Kim, N. G. Khlebtsov, and V. V. Tuchin,
“Photoacoustic flow cytometry: principle and application for real-time detection of circulating single nanoparticles, pathogens, and contrast dyes in vivo,”
J. Biomed. Opt., 12
(5), 051503
(2007). https://doi.org/10.1117/1.2793746 1083-3668 Google Scholar
Y. Wang, X. Xie, X. Wang, G. Ku, K. L. Gill, D. P. O’Neal, G. Stoica, and L. V. Wang,
“Photoacoustic tomography of a nanoshell contrast agent in the in vivo rat brain,”
Nano Lett., 4
(9), 1689
–1692
(2004). https://doi.org/10.1021/nl049126a 1530-6984 Google Scholar
V. P. Zharov, E. I. Galanzha, E. V. Shashkov, N. G. Khlebtsov, and V. V. Tuchin,
“In vivo photoacoustic flow cytometry for monitoring of circulating single cancer cells and contrast agents,”
Opt. Lett., 31
(24), 3623
–3625
(2006). https://doi.org/10.1364/OL.31.003623 0146-9592 Google Scholar
X. M. Yang, S. E. Skrabalak, Z. Y. Li, Y. N. Xia, and L. H. V. Wang,
“Photoacoustic tomography of a rat cerebral cortex in vivo with Au nanocages as an optical contrast agent,”
Nano Lett., 7
(12), 3798
–3802
(2007). https://doi.org/10.1021/nl072349r 1530-6984 Google Scholar
T. M. Lee, A. L. Oldenburg, S. Sitafalwalla, D. L. Marks, W. Luo, F. J. Toublan, K. S. Suslick, and S. A. Boppart,
“Engineered microsphere contrast agents for optical coherence tomography,”
Opt. Lett., 28
(17), 1546
–1548
(2003). https://doi.org/10.1364/OL.28.001546 0146-9592 Google Scholar
P. Dawson,
“The physics of the oscillating bubble made simple,”
Eur. J. Radiol., 41 176
–178
(2002). https://doi.org/10.1016/S0720-048X(02)00023-2 0720-048X Google Scholar
N. de Jong, A. Bouakaz, and F. J. Ten Cate,
“Contrast harmonic imaging,”
Ultrasonics, 40
(1–8), 567
–573
(2002). https://doi.org/10.1016/S0041-624X(02)00171-3 0041-624X Google Scholar
J. A. Viator, S. L. Jacques, and S. A. Prahl,
“Depth profiling of absorbing soft materials using photoacoustic methods,”
IEEE J. Sel. Top. Quantum Electron., 5
(4), 989
–996
(1999). https://doi.org/10.1109/2944.796321 1077-260X Google Scholar
A. A. Oraevsky, S. L. Jacques, and F. K. Tittel,
“Mechanism of laser ablation for aqueous media irradiated under stress confined conditions,”
J. Appl. Phys., 78 1281
–1289
(1995). https://doi.org/10.1063/1.360370 0021-8979 Google Scholar
C. G. Hoelen, A. Dekker, and F. F. De Mul,
“Detection of photoacoustic transients originating from microstructures in optically diffuse media such as biological tissue,”
IEEE Trans. Ultrason. Ferroelectr. Freq. Control, 48
(1), 37
–47
(2001). https://doi.org/10.1109/58.895904 0885-3010 Google Scholar
X. D. Wang, G. Ku, M. A. Wegiel, D. J. Bornhop, G. Stoica, and L. H. V. Wang,
“Noninvasive photoacoustic angiography of animal brains in vivo with near-infrared light and an optical contrast agent,”
Opt. Lett., 29
(7), 730
–732
(2004). https://doi.org/10.1364/OL.29.000730 0146-9592 Google Scholar
E. Quaia,
“Microbubble ultrasound contrast agents: an update,”
Eur. Radiol., 17
(8), 1995
–2008
(2007). https://doi.org/10.1007/s00330-007-0623-0 0938-7994 Google Scholar
C. G. Hoelen and F. F. M. de Mul,
“A new theoretical approach to photoacoustic signal generation,”
J. Acoust. Soc. Am., 106
(2), 695
–706
(1999). https://doi.org/10.1121/1.427087 0001-4966 Google Scholar
|