
|
|
1.IntroductionBased on the initial works of Göppert-Mayer,1 the patent of Denk, Stickler, and Webb2 describing two-photon microscopy is now almost old. This application of two-photon absorption has been widely adopted for in vivo imaging because of its ability to maintain good spatial resolution (a few micrometers), even at the depth of scattering biological samples.3, 4, 5 In more recent years, two-photon microscopy has been used for in vivo brain monitoring.6, 7, 8, 9, 10, 11, 12 Many of the studies were performed on rats or mice and have proved very efficient. Unfortunately, the thickness (roughly ) and the highly scattering properties of rat skulls requires that a part of the skull be removed and replaced with a glass window. The dura mater has to be removed, too. In the case of mice, the skull is much thinner, which allows two-photon imaging to be performed through thinned cranium.10, 11, 12 This approach in mice tends to reduce many problems and artifacts associated with craniotomy (like abnormal temperature, pressure, or blood flow changes) by reducing the thickness of the skull to about or even less,12 and imaging directly through this thinned skull to depths reaching .10, 11 Miniature head-mounted elements and optical fibers have been successfully employed on freely moving rats, but still require craniotomy.6 More recently, two-photon microendoscopy experiments have been tested with very thin gradient index lenses, allowing micrometer resolutions deep inside the brain.8, 9 In most of these various multiphoton in vivo brain studies, the monitoring relies on the study of the dynamics of red blood cells in brain capillaries.7, 13 By staining the plasma with various fluorophores, contrast can be obtained between the fluorescent plasma and the dark-contrasted blood cells. These studies, based on red blood cell motion, seem to require quite a good resolution, which involves craniotomy. However, the feasibility of such a measurement has been demonstrated on mice through thinned skull.11 Another way to monitor brain activity can be the use of the endogenous fluorescence of the reduced form of nicotinamide adenine dinucleotide (NADH) or flavoproteins involved in the metabolism of cells.14, 15, 16, 17, 18 This approach has the advantage of eliminating the need for contrast agents. The framework of this study is to develop two-photon deep imaging ( deep) in the particular case of brain activation monitoring of songbirds like zebra finches (Taeniopygia guttata). The motivation is to study the neuromechanisms underlying vocal recognition. In the animal communication field, zebra finches have become a widely studied model, as they are specialists in sound production and perception, and exhibit interesting social interactions.19 In the framework of ethological studies, and especially with fragile animals like birds, it is crucial to try and develop brain activation monitoring methods that are minimally invasive. Among noninvasive solutions, functional magnetic resonance imaging (fMRI) and near-infrared spectroscopy (NIRS) have been used and have demonstrated their efficacy.20, 21, 22 They are currently developed and applied to the particular case of the zebra finch.23 Unfortunately, the blood oxygen level dependent (BOLD) signal measured in fMRI experiments remains difficult to link quantitatively with parameters expressing neural activity. Moreover, the spatial and temporal resolutions of this method are not completely satisfactory in the case of the monitoring of fast sound processing on small animals. On the contrary, NIRS gives quantitative information about the cerebral blood volume (CBV) and the hemoglobin oxygen saturation level, which reflects cerebral activity, but it is not an imaging method and thus has poor spatial resolution. The use of two-photon microscopy is promising and offers a complementary way to monitor brain activation via NADH fluorescence. In the case of the zebra finch, the structure of the skull is quite unusual, as it has a pneumatic structure composed of -thick internal and external cortical bones linked by approximately -high trabeculae (see Fig. 1 ). Thus, the skulls of zebra finches are much thinner than the skulls of rats and are mainly composed of air, which renders them quite translucent and poorly absorbing. Here we propose preliminary studies aimed at exploring the possibility of deep two-photon imaging through the intact skull of such a bird. The main purpose in our case is the activation monitoring of shallow brain areas that are known to be involved in sound processing, i.e., the hippocampus and the caudomedial neostriatum (NCM). The NCM is located between the caudal and the dorsal part of the bird’s head and extends from below the external surface of the skull. The hippocampus is located above the NCM, between 370 and below the surface of the skull. The geometry of this multilayer problem is illustrated in Fig. 1. This illustration sums up various histology studies that have been performed in the Écologie & Neuro-Éthnologie Sensorielles (ENES) laboratory, Saint-Étienne, France. Fig. 1Schematic representation of the main different parts of the head of zebra finches above the region of the caudomedial neostriatum (NCM). The layers represented here correspond to the main parts that have to be crossed to reach the hippocampus or NCM with an imaging system. The distances provided are average values that have been previously measured on fixed histological slices of the zebra finch head in the ENES Laboratory, University of Saint-Etienne, France. The high inhomogeneity of the skin can be especially noticed, with a height that varies typically between 100 and . This is mainly due to the presence of feather follicles on the bird heads (with a surface density of ). 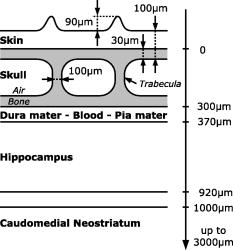 It has been demonstrated that two-photon fluorescence imaging can be performed with satisfactory contrast to a depth of in living mice brains and after craniotomy.5 In the case of NADH fluorescence variation monitoring, contrast and resolution requirements are reduced and a greater penetration depth may be reached. In the case of transcranial two-photon imaging on birds, the skull structure is hollow and quite translucent, which could make the two-photon imaging easier than for the small mammals usually used. However, we do not know how much scattering occurs in the dense parts of the bird skull. Moreover, the refractive index inhomogeneity due to the air gap and the trabeculae greatly reduces the absorption and scattering properties of the skull, but it may be an important source of phase degradation of the excitation beam. To our knowledge, there is no confocal or two-photon imaging data of the structure or bulk scattering properties of bird skulls. In our framework, it is important to explore the possibility of performing transcranial two-photon imaging on zebra finches to validate this approach and try to develop adequate strategies for future in vivo experiments. In this work, we thus present investigations and quantifications of the complex micro- and macrostructure of the zebra finch skull. Various contrasts were used to give geometrical and qualitative data about the complexity and the intimate structure of these samples (confocal reflectance mode, two-photon fluorescence, and second harmonic generation). To quantitatively complete these investigations, we propose as well an estimation of the bulk scattering properties of the dense parts of the bird’s skull. To do so on such an inhomogeneous and multilayered structure, it was necessary to use an approach based on reflectance mode confocal microscopy to characterize the exponential decay of the backscattering as the focus goes deep inside a scattering sample.24, 25, 26, 27 Finally, we present two-photon imaging experiments of a known calibrated fluorescent object located under skull samples to estimate the effect of the skull of zebra finches on the spatial quality of the excitation beam. These experiments are intended to provide a methodological foundation for future in vivo monitoring experiments with appropriate excitation and detection strategies. 2.Materials and Methods2.1.Two-Photon Fluorescence Imaging of Skull SamplesTo perform two-photon imaging as well as reflectance mode confocal imaging of skull samples, we used a TCS-SP2 confocal microscope from Leica Microsystems. The laser system was a Ti:sapphire MIRA 900 oscillator from Coherent, pumped with a Verdi Nd:YAG laser at . The laser system delivers typically , pulses with a repetition rate. The wavelength can be adjusted between 710 and with a maximum power around . For two-photon imaging experiments [see Fig. 2a ], the fluorescence was collected just after the microscope objective via a dichroic beamsplitter, which is transparent to wavelengths greater than . The collected visible radiation spectrum is split by another dichroic cube into two channels toward the nondescanned photomultipliers. This configuration minimizes the losses in the fluorescence collection. The presence of additional filters (Chroma HQ525/50M and Chroma HQ610/75M) on the dichroic cube sets the detection bands (between 500 and for one channel and between 575 and for the other one). Microscope objectives that were used are long working distance water-immersion Leica objectives (HCX APO L U-V-I NA 0.3, HCX APO L U-V-I NA-0.5 or HCX APO L U-V-I NA 0.8). An electro-optical modulator (EOM) was used to adjust the laser power at the entrance of the confocal system. This was particularly useful to automatically compensate for energy losses due to scattering as the focus moves inside the samples. Fig. 2(a) Setup configuration and detection scheme for reflectance mode and two-photon experiments. Excitation: DM1 is the dichroic mirror reflecting radiations above , DM2 is the dichroic mirror reflecting radiations below (only present for two-photon experiments), MO is the microscope objective, S is the sample, and TS is the translation stage. Detection: P is the pinhole, F0 is the IR high-pass filter, F1 and F2 are bandpass filters (Chroma HQ525/50M and Chroma HQ610/75M), DM3 is the dichroic mirror with cut-off wavelength around , and NDD1 and NDD2 are nondescanned detectors. (b) Comparison between the two-photon fluorescence spectra of the calvaria (autofluorescence) of the bird and rhodamine B. The transmission spectra of the two filters (F1 and F2) used in front of the nondescanned detectors are also presented (dashed curves) to show which part of the spectra will be received by the nondescanned detectors. 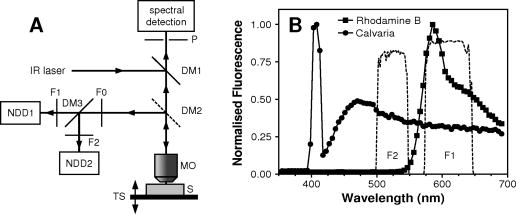 Concerning the preparation of the skull samples, male zebra finches with an average weight of were sacrificed with a lethal intramuscular injection of pentobarbital. Their heads were plucked a couple of days before sacrifice. The blood was removed from the vascular system by cutting the aorta just after the death of the animal to avoid staining of the bone with blood during dissection. Approximately pieces of skull were taken between the dorsal and caudal parts of the bird’s head and along the sagittal suture. These skull samples were fixed with a 4% paraformaldehyde solution. 2.2.Near-Infrared Reflectance Imaging and Exponential Decay MeasurementsTo have a better knowledge of the zebra finch’s skull scattering properties, we chose to use a method based on reflectance mode confocal measurements. Indeed, in our case, it is difficult to use conventional methods like time-resolved reflectance measurements. We do not have a uniformly scattering sample that is large enough to be considered as a semi-infinite medium. This hypothesis allows then simpler simulations based on the diffusion equation. In the particular case of this hollow and thin skull structure, only a method based on 3-D spatially resolved measurements can be used to estimate the bulk scattering properties of the dense parts of the zebra finch’s skull. It is well known that in confocal reflectance mode imaging, the backscattered power decreases as the beam focus goes deep into a scattering sample. Indeed, it is commonly assumed that the ballistic power at focus decreases exponentially because of scattering. Then, because of the confocal detection principle, the backscattered power that is collected by the objective comes mainly from the focal volume. It may also be assumed that the photons undergo the same exponential decay on the return path, which gives the following simplified expression of the detected backscattered power: where is the incident power of the beam, is the position of the beam focus inside the scattering sample, and is the total extinction coefficient (including absorption and scattering losses). When the absorption can be neglected, which is often the case in biological media, this coefficient can be identified as the scattering coefficient . This simplified model can be a preliminary approach that is sometimes used to compare different scattering media.28, 29 Actually, this equation is a good approximation only in the case of isotropic scattering events, which are known to happen rarely in biological samples. Moreover, this approach does not take into account the real effective path of the photons inside the scattering medium, which do not go straightforward in a highly focused beam configuration. This effective path correction depends on the numerical aperture of the microscope objective and on the beam spatial profile.26 Moreover, the exponential decay of the reflectance highly depends on the anisotropy of the scattering: as more power reaches the focus, less power is backscattered and more power reaches the confocal pinhole in the case of an anisotropic scattering. This dependency was recently used by Jacques, Gareau, and Samatham 24, 25, 26, 27 to estimate the separate contributions of the scattering coefficient and the anisotropy coefficient. The decay of the confocal reflectance as the focus goes deep into the sample can be fitted by the simple relationship:where is then the reflectance at the surface of the sample, and is a decay coefficient, not to be mixed up with the actual scattering coefficient . With an anisotropic behavior of the scattering, these coefficients both depend on the anisotropy coefficient and the scattering coefficient . In this study, we aimed at measuring these parameters and on bone samples. At this point, only Monte Carlo simulations that take into account the geometry of the beam and the anisotropy of the scattering are able to link these two coefficients to the anisotropy and scattering coefficients and .26 Indeed, these reflectance mode measurements are performed only on a range that represents several scattering mean-free paths. This implies that the multiple scattering hypothesis used in the diffusion approximation would not apply here.30, 31 Monte Carlo simulations were not performed in our case. However, with an adequate analysis of the problem, it is possible to deduce, as a first step, a quite accurate order of magnitude of the reduced scattering coefficient , defined as . Further discussions about this are given in the results and discussion in Sec. 3.Thus, to measure and , we performed near-infrared (NIR) reflectance mode imaging experiments [see Fig. 2a for the experimental settings]. The standard spectral detection of the microscope was used. The NIR laser beam is injected in the optical path of the microscope via a SP700 dichroic mirror with a cut-off wavelength around . We thus had to set the laser wavelength of the MIRA 900 oscillator at to use the dichroic mirror as a simple beamsplitter. Indeed, the excitation wavelength was chosen to be close to the cut-off wavelength of the dichroic beamsplitter. In these conditions, it was then possible to collect a small amount of the excitation wavelength on the photomultipliers tubes and thus acquire reflectance mode images. As these experiments required a good axial resolution, only the HCX APO L U-V-I NA 0.8 was used, because it offers a higher numerical aperture. This method requires measurement of the exact power fraction that is reflected or backscattered by a sample, and thus a calibration was necessary. For this purpose, several stacks of confocal reflectance images were performed on a microscopy glass plate of known refractive index . All the reflectance data that are presented here are calibrated to give a real value of the reflectance of the samples. Furthermore, these confocal reflectance stacks were used to estimate the actual axial resolution by observing the axial extension of the reflectance signal due to the interface between the glass and the immersion medium. An experimental value of was measured as the axial resolution [full-width at half maximum (FWHM) of the axial reflectance distribution]. All reflectance experiments (glass and bone samples) were performed with the same experimental conditions. Only the incident average power of the NIR laser beam may have been changed from one experiment to the other, but the average power of the beam was measured using a power meter for each experiment and taken into account in the calibration process of the reflectance curves. A first experiment was performed on a skull sample prepared as described in the previous section. However, the skull sample was kept in a phosphate buffered saline (PBS) solution just after the sacrifice of the bird, and the confocal reflectance stacks were acquired only few minutes after that. This sample is referred in the next parts as the fresh bone sample. After this first set, the sample was rinsed with PBS and kept overnight in a 4% paraformaldehyde solution for fixation. A second set of experiments was then performed on this fixed sample and is referred in the next parts as the fixed bone sample. Each set of experiments was composed of image stacks that were recorded on five different parts of one skull sample (fresh or fixed), and for each stack ten different ROIs were considered. Each ROI consisted of a square selection located above a trabecula. Indeed, the outermost cortical part of the skull is only deep between trabeculae. To observe the exponential decay as deep as possible, it was thus necessary to measure it in parts of the skull that offer enough depth (i.e., the trabeculae). The exponential decay curves that are plotted in Fig. 3 represent the variation of the average of the gray levels in the square selection (average more than roughly ). The size of the ROI was chosen to have the best compromise between fluctuations (that appear when averaging on too small areas), and the steepness of the reflectance curve when the beam approaches the sample surface (which is smoothed by possible tilts of the surface relatively to the optical axis). Fig. 3(a) Fits of the exponential decay of the confocal reflectivity signal performed on five different regions of the same confocal stack of images. The fits were performed by linearly fitting the logarithm of the reflectivity curves, ignoring the part where the background noise level dominates. (b) Box-and-whiskers plots of the coefficients and measured on fresh and fixed skull samples. These data were obtained by fitting exponential decays measured on ten different regions of interest of one stack and for five different stacks acquired on five different regions of the skull sample. Significant differences can be seen between fresh and fixed tissues. (c) Plot of the possible values of the reduced scattering coefficient as a function of the anisotropy coefficient (according to the values of the reflectance at the surface ) for the fresh (straight line) and the fixed (dashed line) bone samples. 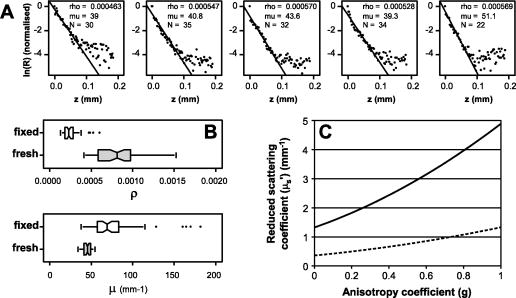 2.3.Two-Photon Imaging Experiments of Rhodamine-B-Filled Fiber Below Skull SamplesFor this set of experiments, the material and settings are the same as in the preceding section. However, preliminary spectral studies were performed on skull samples and on rhodamine B by using the spectral detection scheme of the Leica microscope, allowing a wavelength scanning in front of the photomultipliers. In Fig. 2b, the transmission spectra of the filters are overlaid on the fluorescence spectra of the analyzed samples (skull samples and rhodamine B in ethanol). For these fluorescence spectra measurements, the microscope was calibrated using a mercury lamp, and the spectral resolution had been evaluated to be roughly (FWHM). The spectra presented in Fig. 2b have been corrected thanks to this wavelength calibration. In this figure, the skull fluorescence appears in both channels, while rhodamine B appears in the orange/red channel, which indicates that fluorescence from rhodamine B can be easily discriminated from the endogenous fluorescence of the bone samples. A second harmonic generation (SHG) peak is also present around on the fluorescence spectrum of the calvaria. This type of contrast (SHG) was only used for Fig. 4f with a forward detection scheme (i.e., through the bone sample), including a condenser lens, a Chroma HQ400/50 bandpass filter, and the transmission detector of the Leica TCS-SP2 system [not represented in Fig. 2a]. Fig. 4(a) and (b) Two-photon fluorescence images of the bone structure of the zebra finch skull. (a) is a projection of a stack that was carried out on a -thick transverse slice of skull. (b) is a projection of a stack that was performed approximately between 150 and below the external calvaria. This image was used to estimate the trabeculae average diameter and their surface-filling factor. (c), (d), and (e) Reflection mode confocal images of the external calvaria at . The images represent z-projections of stacks acquired near the surface between the external calvaria and the air gap within the skull, where the reflection signal is quite high. (c) was performed on freshly excised bone samples that were kept in a PBS solution, (d) was performed on fixed bone samples that were kept overnight in a paraformaldehyde solution, and (e) is a perpendicular projection of the external calvaria [taken from the same stack as for (c), between the two trabeculae]. (f) Forward second harmonic generation (SHG) image of the external calvaria. (g) and (h) DAPI labeling of the cell nuclei. This labeling reveals the location of cells in the zebra finch skull. (g) is a projection from a -thick stack acquired inside the external calvaria, and (h) is a projection from a -thick stack acquired just below the external calvaria, revealing the starting of the trabeculae and the skull inner vascular system. Some features are highlighted with arrows (t are trabeculae, c are collagen fibrils, o are osteocytic lacunae, n are nuclei, and v are blood vessels). The scale bars represent (a) through (g).  Concerning the sample preparation, the aim was to observe a well-known and calibrated highly fluorescent object through skull samples. Thus, silica hollow core fibers were used to simulate, for instance, a single rectilinear blood capillary. The fibers we used had a total diameter and a hollow core of a diameter equal to . The core of the fiber pieces was filled with rhodamine B by capillary action and sealed with glue at both extremities. For optimized two-photon imaging of these samples, wavelengths close to and a concentration of rhodamine of were used. As shown in Fig. 5a, the fiber was set on a -deep rectilinear groove machined on a plexiglas half-cylinder whose radius of curvature is equal to (which is the average radius of curvature of the zebra finch’s head). The fiber was then glued on the plexiglas stand and covered with the skull sample. The skull samples were prepared exactly the way it was described in the previous section. The microscopy transparent glue (Entellan, refractive index ) was used to fill the empty spaces between the fiber and the skull, to prevent from having another air gap between the skull and the plexiglas stand. To prevent the filling of the skull’s pneumatic cavity with water, the immersion medium we used for the microscope objective was a transparent gel, mainly composed of water (echography gel). Fig. 5(a) Representation of the setup that was used to image a hollow-core fiber filled with rhodamine B through skull samples. MO: microscope objective. IM: immersion medium. Sk: skull sample. G: Entellan glue. St: plexiglas stand. HF: hollow-core fiber. RhB: rhodamine B. (b) Two-photon fluorescence images of the calvaria and the rhodamine-B-filled fiber at various depths. The green channel corresponds to the fluorescence collected through the Chroma HQ525/50M filter, and the red channel corresponds to the fluorescence collected through the Chroma HQ610/75M. Four particular depths are imaged [ , outermost surface of the first calvaria; , inner side of the first calvaria (the trabeculae are visible); , last visible parts of the skull (second calvaria); and , rhodamine-B-filled hollow fiber]. (c) projection of the two-photon fluorescence images of the skull and the rhodamine-filled fiber. Only the fluorescence collected in the red channel is represented here, as it comes both from the calvaria and rhodamine B. This figure is an averaged projection along the direction as the fiber was set perfectly parallel to this axis. The scale bars widths are on (b) and (c). Some features are highlighted with arrows (t are trabeculae, f is fiber, e.c. are external calvaria, and i.c. are internal calvaria). (d) and (e) are respectively the lateral (along ) and axial (along ) profile of the rhodamine B fluorescence observed in (c). The FWHM is respectively for the lateral profile and for the axial profile.  Several stacks of images were recorded between the surface of the skull and roughly deep below the outermost calvaria with the microscope objective. One stack is composed of roughly 300 images, and each image is an average over three frame scans, and each line is an average over two line scans. In these conditions, these stacks represent a volume of . The images that are presented in the results in Sec. 3 may be either projections averaged over a couple of frames or projections averaged over the whole stack. projections are used to obtain an average cross section image of the fiber fluorescence. This was possible because, in each experiment, the fiber was perfectly aligned with the direction. 3.Results and DiscussionSeveral types of experiments were carried out and gave us quite different insights on the geometrical and scattering properties of the zebra finch skull and the possibility of performing deep imaging through this structure. These results are presented next in three parts. The first is dedicated to the description of general structural information on the skull, obtained with either the confocal reflectance mode or two-photon fluorescence contrast. The second part is dedicated to a set of confocal reflectance experiments that were carried out to estimate the reduced scattering coefficient of the skull. Finally, the last part explores the feasibility and the loss of resolution of two-photon deep imaging through skull samples. 3.1.Structural Analysis of the Skull SamplesIn most studies that aim at measuring brain parameters or activation with optical methods, rats or mice are used. These rodents have a thick and dense skull compared to birds. In the case of birds, the skull structure is pneumatic and mainly composed of air and two very thin calvariae linked by trabeculae [see Fig. 4a]. Thus, this skull structure is quite translucent, because only a small part of this structure is made of dense, absorbing, and scattering material. We showed that trabeculae have good circularity [Fig. 4b]. Their average equivalent diameter was estimated to be . The density of trabeculae was also estimated and lies between 11 and . In these conditions, the trabeculae surface filling factor is 9 to 11%. This indicates that roughly 90% of a light beam can cross this bird skull without being absorbed or scattered by trabeculae, that is to say that 90% of the photons will only experience absorption and scattering of the two thin calvariae. The structure of the calvaria was explored using several different contrasts. As can be seen in Figs. 4c, 4d, 4e, reflectance mode confocal imaging highlights the high reflectance that comes from the high refractive index change between the calvaria and the air gap. The contrast of Figs. 4c and 4d mainly comes from this refractive effect, which gives insights on the roughness of the inner interface. In particular, the difference between fresh bone [Fig. 4c] and fixed bone [Fig. 4d] concerning the trabeculae shapes and the speckle-like aspect indicates that the skull samples are degraded by the fixation process. This is confirmed by the scattering analyses in the next section. Figure 4e (performed on a fresh sample, side projection) confirms that the calvaria is quite regular between trabeculae, with a thickness equal to . The microscopic structure of the skull has been more precisely investigated with second harmonic generation contrast [Fig. 4f], which is known to be quite specifically induced by collagen fibrils. This image shows the high density and predominancy of the collagen matrix in that kind of bone sample. Moreover, it is possible to see cavities (osteocytic lacunae), which indicate the presence of osteocytes embedded in the collagen and mineral matrix of the calvaria. These osteocytes are more obviously observed in Fig. 4g where a -diamidino-2-phenylindole (DAPI) labeling of the cell nuclei was performed. These measurements were treated qualitatively in this work, but further quantitative analysis of these stacks may be useful to simulate the scattering properties of this bone. Finally, Fig. 4h, which was performed deeper in the DAPI-labeled sample, shows trabeculae, osteocytes, and vascular cells. This image illustrates the fact that highly resolved images can be obtained via two-photon microscopy, at least through the first calvaria. Notice that only a few blood capillaries will scatter and absorb the light passing through the skull, and it may be reasonable to think that this may only have a slight effect on the overall losses of the incident beam. According to these structural investigations of the zebra finch skull structure, it is obvious that the scattering properties of these samples come from a complicated distribution of inhomogeneities with sizes varying from tenth of nanometers (for collagen fibrils) to several microns (osteocytes) and even one hundred microns (for trabeculae). Moreover, we noticed the presence of underlying blood capillaries, which absorb a lot compared to the other components of the bone, but they are hopefully not too numerous and not too thick. As it is well known in tissue optics, all these inhomogeneities lead to scattering properties that result from a complex mixing of Rayleigh and Mie scatterers, which is the case in many biological samples, but in a quite different manner here. In addition to that, the presence of a very high refractive index change and of macroscopic scale structures (trabeculae) is very unusual. It is thus difficult to have a good representation of the whole scattering properties of this original and particularly complex type of samples. 3.2.Confocal Reflectance Experiments for the Estimation of the Scattering PropertiesThe results of our estimations of the exponential decay measurements are summed up in Fig. 3. In Fig. 3a, the decrease of the logarithm of the normalized calibrated reflectance (see Sec. 2 for details) as a function of is presented (black dots) for five different ROI in a single trabecula. The linear fit of these experimental data is presented as a solid line. The number of points that were used for a single fit is indicated (more than 20 for all the fits), as well as the corresponding and parameters that were found. This method was applied to ten different ROI of a single trabecula, and this was repeated for five different trabeculae. This gives 50 values of and for each type of sample (fresh or fixed). As can be seen in Fig. 3a the data follow quite well an exponential decay until the background noise dominates, roughly deep inside the sample. The quality of the fits indicates that the reflection induced by the interface between the immersion medium and the bone surface can be neglected compared to the backscattering from the surface. The results are summed up in a box and whiskers plot [Fig. 3b]. The first interesting result is that the values of the reflectance at the surface , as well as the decay coefficient , are quite different for fixed and fresh samples. This confirms quantitatively the qualitative results showed in Figs. 4c and 4d. The modification of the scattering properties is clearly shown here between fresh and fixed samples. The average values and the standard deviations are summarized in Table 1 . Table 1Average values of ρ and μ and their standard deviations calculated over a sample of 50 different regions on the skull samples.
As we said in Sec. 2, only Monte Carlo simulations in our geometry could help us find the value of the scattering coefficient and from the knowledge of the reflectance exponential decay parameters and . However, some further analyses can be made at this point. Indeed, if we make the assumption that the phase function of the scattering follows the Henyey-Greenstein function32 (which is often made in Monte Carlo simulations of photon transport in biological media), the confocal reflectance at the surface of the sample can be approximated by using the classical phenomenological approach of light scattering. In this approach, the backscattered signal that is detected through the confocal pinhole comes mainly from the backscattering due to the scatterers present in the focal volume. The total scattering cross section in the focal volume can then be written as: where is the volume concentration of scatterers, is the focal volume, and is the scattering cross section of one scatterer. By definition, the scattering coefficient is equal to . To have a reflectance value, it is necessary to divide this total scattering cross section by the cross section of the beam at the focal plane. The focal volume is approximated by a cylinder with a height equal to (which is assumed to be equal to the axial resolution, i.e., as estimated in Sec. 2). Thus, the total fraction of light scattered in the focal volume is equal to:To take into account the anisotropy of the scattering and the part that is collected by the objective, this total scattered fraction has to be multiplied by the integration of the Henyey-Greenstein function from to , where is the collection angle of the objective, determined by its numerical aperture. After integrating the Henyey-Greenstein function, the backscattered fraction at the surface of the scattering sample is thus: whereNA is the numerical aperture of the collecting objective and is the refractive index of the immersion medium. We used Eq. 5 and the values of presented in Table 1 to plot the possible values of the reduced scattering coefficient as a function of [see Fig. 3c]. With this definition, represents the equivalent mean-free path between successive isotropic scattering events due to multiple anisotropic scattering events (then characterized by and ). Each curve of Fig. 3c represents the possible values of for each sample (fresh and fixed). As can be seen, the fresh sample seems to be more scattering than the fixed samples. At this point, only Monte Carlo simulations could help us determine precisely the possible values of according to the exponential decay parameter . The relationship between and the scattering coefficients and can be written as:24, 25, 26 where is a function that is determined by Monte Carlo simulation for one particular focusing condition (it depends only on the numerical aperture of the beam). This function approaches 1 for isotropic scattering and approaches 0 for perfectly forward directed scattering . is a corrective term that accounts for the fact that, in a highly focused beam, the photons entering perpendicularly to the sample surface cross less scattering medium to reach the focus than the photons coming sideways. It depends then on the beam profile and the numerical aperture of the objective.25 However, even with a uniform beam shape and with a 0.8 numerical aperture (our case here), it cannot exceed 1.25, which is the ratio between the path length of the most tilted ray coming out of the objective over the path length of a perpendicular ray reaching the focus. Monte Carlo simulations that can be found in Ref. 25 were performed with a numerical aperture of 0.9. In these conditions, it can be seen from the same reference that the function is unambiguously close to 1 when , and it is reasonable to think that this would also be true in our case, where the numerical aperture is 0.8. With this hypothesis , it can be seen from the results of Fig. 3c that the scattering coefficient would be less than for fresh samples and for fixed samples. According to Eq. 10, with and , this would not be compatible with the values of the exponential decays that we found (see Table 1). Following the same analysis, this incompatibility is still valid with the hypothesis that , but only for fixed samples. Therefore, despite the fact that we did not perform Monte Carlo simulations, the anisotropy coefficient is more likely to be above 0.7 for fresh samples and above 0.9 for fixed samples. According to this and to the results of Fig. 3c, a relatively small range of variation can be given for the reduced scattering coefficient and the anisotropy coefficient . These values are summarized in Table 2 . These values indicate that the scattering properties of the skull sample of zebra finches are quite low and forward directed. Moreover, it seems that for fixed samples, the scattering is much lower in terms of reduced scattering coefficient. First, this indicates that extra care must be taken when we try to draw conclusions from post-mortem experiments on fixed samples. Secondly, this suggests we try to lower the scattering properties of the skull during future in vivo experiments. This kind of reduction of the reduced scattering coefficient has been recently studied with propylene glycol and glycerol.33 To our knowledge, no value can be found about the scattering properties of bird skull; however, our values can be compared to the measurements performed by Firbank on pig skull samples in the NIR region.34 In this study, values of the anisotropy were found from 0.925 (at ) to 0.945 (at ), and values of the scattering coefficients varied from (at ) to (at ). This would give values of the reduced scattering coefficient ranging from (at ) to (at ). We find here quite higher values in the case of fresh samples. However, it may be noticed that the reduced scattering coefficient that we found here has the same order of magnitude as the reduced scattering coefficient of the zebra finch head that was measured by in vivo time-resolved spectroscopy in a former study.35 A reduced scattering coefficient of was found, which came mainly from the scattering in the brain of the bird. According to these data and in the perspective of two-photon imaging deep in the brain of the bird, it is clear that the bulk scattering of the bone should not account much for the scattering losses of the incident excitation beam. However, the next part of this work gives further insight on this last assumption.Table 2Estimation of the reduced scattering coefficients and anisotropy coefficients of fresh and fixed skull samples at 710nm .
3.3.Two-Photon Deep Imaging through Zebra Finch Skull SamplesAs estimated in the previous section, bulk scattering in the two calvariae of the skull of the zebra finch is small, compared to the scattering that would occur in the brain tissues. However, we consider it important to explore the impact of the whole skull structure on the excitation beam, and thus on two-photon imaging of fluorescent objects located below the skull. To do so, we chose to image a small and highly two-photon fluorescent object, i.e., a hollow fiber filled with rhodamine B (see Sec. 2 for details). In Fig. 5a, a schematic of the sample is presented, which was described in Sec. 2. In Fig. 5b, it is possible to see several two-photon fluorescence images that were performed on the skull sample below which the rhodamine-B-filled fiber is located. As was already mentioned, the endogenous fluorescence of the bone is principally collected in the green channel, whereas the exogenous fluorescence of the rhodamine B is collected almost entirely in the red channel. The contrast for the first calvaria is quite high, revealing details that were already shown in Fig. 4. Trabeculae are clearly observed just below the first calvaria, but for greater depths it becomes difficult to distinguish them clearly, as is the case for the second calvaria. However, at deep below the outermost calvaria, the fluorescent fiber is clearly seen, indicating that it is possible to detect the fluorescence of a small and highly fluorescent object through the skull of the zebra finch. The loss of resolution and contrast and the fluorescent object are also observable on the projection of Fig. 5c (red channel only). On this projection, it is possible to estimate the resolution loss, especially in the direction. The lateral and axial fluorescence distributions are plotted in Figs. 5d and 5e. On these plots, we measured that the FWHM of the fluorescence is in the lateral direction and in the axial direction. This fluorescence intensity distribution is not the well-known point spread function (PSF) of the excitation beam, as the fiber fluorescent core is too close to the final lateral spread of the fluorescence (a smaller object should have been taken to simulate a Dirac delta function). Moreover, what is represented here is not the spatial distribution of the excitation beam intensity, but the distribution of the two-photon fluorescence, which is supposed to follow the squared excitation intensity. However, this fluorescence spatial distribution gives a good evaluation of the two-photon fluorescence imaging resolution or spatial selectivity that we can expect when imaging through only the skull of the zebra finch, without considering any other scattering brain parts. The fact that a highly fluorescent object can be detected through a thin scattering sample is not really surprising, but it was worth testing because our sample is quite unusual. We have shown earlier that only 10% of the beam is affected by trabeculae, while roughly 90% of the beam experiences only the scattering from the two calvariae, i.e., roughly of scattering medium. However, it is interesting to observe that the beam is quite spread by the skull. By simply taking the square root of the fluorescence profile of Figs. 5d and 5e, it appears that the beam intensity spreading would be in the lateral direction and in the axial direction. It seems reasonable to think that such a spreading of the excitation beam is not fully explained by the bulk scattering properties of the two thin calvariae, but also by the high refractive index inhomogeneities induced by the presence of the air gap. Indeed, thanks to the previously described reflectance experiments, the bulk scattering properties of the bone do not seem to be particularly higher than in most biological samples.36 Moreover, recent studies10, 11, 12 have demonstrated that fluorescent objects can be imaged via two-photon microscopy through thinned skulls. In these studies, small structures like fluorescein isothiocyanate (FITC)-injected capillaries located below the skull of mice have been imaged through the skull thinned to without losing resolution as much as we do.11 This also strongly supports the idea that our structure is quite unusual and that our resolution loss may be mainly due to its pneumatic structure. Moreover, we did not work on intact skull in vivo, but on fixed samples that were found to be less scattering than fresh samples (see Table 2). The image quality might then be even worse during in vivo experiments because of bulk scattering as well as the presence of blood in the capillaries. 4.ConclusionTo lay the groundwork for two-photon imaging through the skull of zebra finches, we study the 3-D microscopic structure of skull samples, as well as their macroscopic structure, which is quite unusual compared to the skull of rodents. We use several microscopy techniques for this purpose (reflectance mode confocal microscopy, two-photon microscopy, and second harmonic generation microscopy). The peculiarity of the bird skull is the presence of an air gap and trabeculae. The size of the outer and inner calvariae is not very deep and quite regular. However, the presence of trabeculae may eventually be a problem for imaging through the skull. These trabeculae only represent 10% of the total area of the skull. In these conditions, most photons from the excitation beam are not affected by these structures. However, this view does not hold in the case of high numerical aperture objectives, because the rays that cross the skull with a high angle are certainly more affected by the presence of trabeculae. Concerning the inner bulk structure of the bone, second harmonic generation imaging, DAPI labeling, and reflectance mode confocal imaging reveal that the bone is quite homogeneous, with only several small osteocytes and a dense mineral and collagen matrix. To better characterize the bulk structure of the bone, reflectance mode experiments are performed that rely on the decay measurements of the backscattered power. These experiments are quite well adapted to our particular case for two reasons. First, the complex geometry of the skull renders impossible the use of other techniques based on numerous scattering events that require large and homogeneously scattering samples. Second, the surface of the skull sample is quite smooth, which makes it simpler to locate the surface on reflectance curves. However, the use of this technique requires Monte Carlo simulation of the anisotropic photon transport in the scattering sample, and this with the geometry of the focused beam must be taken into account. We did not perform such simulations in our case, but by a correct analysis of the reflectance at the surface and by comparing our results with other works that used almost the same geometry, it was possible to give a range of variation for the reduced scattering coefficient and a lower limit for the anisotropy coefficient. These results indicate that the bulk scattering properties of the bone that composes the skull of the bird are higher, but comparable, to those of pig skull.34 An important point is that fixed bones are less scattering than fresh ones, giving perhaps ideas to reduce the scattering properties of the bone, as was done in a recent work.33 As a conclusion, the dense parts of the skull of zebra finches are not particularly more scattering than most biological samples. Moreover, it seems that it scatters a little less than the bird’s head that was characterized in vivo in a previous study.35 Finally, to test the feasibility of two-photon fluorescence collection and imaging through the skull, we study the effect of skull samples on the two-photon imaging of a known object located deep beneath the skull. While the contrast is quite high with this highly fluorescent object, the loss of resolution is important, especially for the axial resolution. However, in the case of NADH fluorescence monitoring, the spatial resolution required is less stringent. Indeed, we are interested in obtaining an axial resolution that allows us to distinguish between the metabolism of two different brain regions. According to our studies, a resolution of in the lateral direction and in the axial direction may be reached, which is reasonable compared to the lateral extent of the region under study (roughly ). However, it would be interesting to reduce the mixed scattering and aberrational problem that occurs, because the spreading of the beam reduces the resolution and also decreases drastically the intensity of the beam at focus, which leads to a less powerful excitation and to a resulting decrease of the fluorescence (which follows the squared intensity). When comparing the resolution and fluorescence losses to the size of the scattering calvariae and to the scattering properties found in Sec. 3, it seems clear that the scattering problem here cannot be reduced to the case of an uniformly scattering slice of . The entire skull must be taken into account and could help us, by performing simulations, to better understand what disturbs the excitation beam. In the case of uniformly scattering samples, the maximum imaging depth is known to be reached when the two-photon fluorescence from the surface is comparable to the fluorescence at focus.4, 5, 37 The conventional strategies that are proposed to improve the maximum imaging depth are the use of high numerical aperture objectives, higher pulse energies,4, 5, 37 or even special excitation or beam shaping configurations.38, 39, 40 However, these studies always rely on the hypothesis of two-photon imaging in one uniformly scattering sample. In our case, it is clear that the energy loss will have to be compensated by higher energy pulses, as well as the fact that the NADH is much less fluorescent than rhodamine B. On the contrary, it is not obvious here that a greater numerical aperture will improve our experiments. Indeed, if a larger fraction of the photons crosses the skull with a high angle, it is likely that they will have to cross more trabeculae, which may have a catastrophic consequence on the beam spatial distortion. Besides, the problem of the contrast losses still remains and will certainly be quite different from the case that is usually described in the formerly cited studies. Thanks to these preliminary studies, several ways are about to be explored and the choice of the best strategies depends on the respective roles of various phenomena on the beam distortion and energy losses (bulk scattering of the bone, distance between the scattering slices, macroscopic refractive index variation, and presence of the trabeculae). One of the most promising strategies is beam shaping and the use of adaptive optics to precompensate for aberrations. It could drastically improve our resolution and imaging depth, especially in this unusual configuration where macroscopic refractive index changes are present. Unfortunately, this method is quite difficult to set up and expensive, but the several preliminary studies that we carried out here give precious insights that will help us prepare this in the most adequate way. AcknowledgmentsThis study was supported by a grant from the French National Agency for Research (ANR, “Birds’ voices” project). The authors would like to thank Yaya Lefkir for his help in preparing the samples, Sabine Palle from the confocal microscopy center in Saint-Etienne (CMCM), Leica Microsystems (Mannheim, Germany) for their partnership, Stéphane Mottin for his involvement in the development of our collaborations with biologists and the creation of the confocal microscopy center (CMCM), Frédéric Louradour from IRCOM (Limoges, France) for having generously provided the hollow fibers, and Nicolas Mathevon and Clémentine Vignal (ENES Laboratory, Saint-Etienne) for their management of the “Birds’ voices” project, the providing of birds, and for some useful advice and histology data. ReferencesM. Göppert-Mayer,
“Über elementarakte mit zwei quantensprüngen,”
Ann. Phys., 401 273
–294
(1931). https://doi.org/10.1002/andp.19314010303 0003-3804 Google Scholar
W. Denk, J. P. Strickler, and W. W. Webb,
“Two-photon laser microscopy,”
United States Patent No. 5034613,
(1989) Google Scholar
F. Helmchen and W. Denk,
“Deep tissue two-photon microscopy,”
Nat. Methods, 12 932
–940
(2005). https://doi.org/10.1038/nmeth818 1548-7091 Google Scholar
M. Oheim, E. Beaurepaire, E. Chaigneau, J. Mertz, and S. Charpak,
“Two-photon microscopy in brain tissue: parameters influencing the imaging depth,”
J. Neurosci. Methods, 111 29
–37
(2001). https://doi.org/10.1016/S0165-0270(01)00438-1 0165-0270 Google Scholar
P. Theer, M. Hasan, and W. Denk,
“Two-photon imaging to a depth of in living brains by use of regenerative amplifier,”
Opt. Lett., 28 1022
–1024
(2003). https://doi.org/10.1364/OL.28.001022 0146-9592 Google Scholar
F. Helmchen, M. Fee, D. Tank, and W. Denk,
“A miniature head-mounted two-photon microscope: High resolution brain imaging in freely moving animals,”
Neuron, 31 903
–912
(2001). https://doi.org/10.1016/S0896-6273(01)00421-4 0896-6273 Google Scholar
E. Chaigneau, M. Oheim, E. Audinat, and S. Charpak,
“Two-photon imaging of capillary blood flow in olfactory bulb glomeruli,”
Proc. Natl. Acad. Sci. U.S.A., 100 13081
–13086
(2003). https://doi.org/10.1073/pnas.2133652100 0027-8424 Google Scholar
M. Levene, D. Dombeck, K. Kasischke, R. Molloy, and W. Webb,
“In vivo multiphoton microscopy of deep brain tissue,”
J. Neurophysiol., 91 1908
–1912
(2004). https://doi.org/10.1152/jn.01007.2003 0022-3077 Google Scholar
J. Jung, A. Mehta, R. Stepnoski, and M. Schnitzer,
“In vivo mammalian brain imaging using one and two-photon fluorescence microscopy,”
J. Neurophysiol., 92 3121
–3133
(2004). https://doi.org/10.1152/jn.00234.2004 0022-3077 Google Scholar
E. J. Yoder,
“In vivo microscopy of the mouse brain using multiphoton laser scanning techniques,”
Prog. Biomed. Opt. Imag., 3 14
–29
(2002). Google Scholar
E. J. Yoder and D. Kleinfeld,
“Cortical imaging through the intact mouse skull using two-photon excitation laser scanning microscopy,”
Microsc. Res. Tech., 56 304
–305
(2002). https://doi.org/10.1002/jemt.10002 1059-910X Google Scholar
G. Nase, P. Helm, T. Reppen, and O. Ottersen,
“A multiphoton laser scanning microscope setup for transcranial in vivo brain imaging on mice,”
Rev. Sci. Instrum., 76
(12), 123702.1
–123702.5
(2005). https://doi.org/10.1063/1.2140487 0034-6748 Google Scholar
G. M. Shepherd,
“The single capillary and the active brain,”
Proc. Natl. Acad. Sci. U.S.A., 28 12535
–12536
(2003). https://doi.org/10.1073/pnas.2336089100 0027-8424 Google Scholar
K. Takahashi, R. Hishida, Y. Kubota, M. Kudoh, S. Takahashi, and K. Shibuki,
“Transcranial fluorescence imaging of auditory cortical plasticity regulated by acoustic environments in mice,”
Eur. J. Neurosci., 23 1365
–1376
(2006). https://doi.org/10.1111/j.1460-9568.2006.04662.x 0953-816X Google Scholar
S. Mottin, P. Laporte, and R. Cespuglio,
“Inhibition of NADH oxidation by chloramphenicol in the freely moving rat measured by picosecond time-resolved emission spectroscopy,”
J. Neurochem., 84
(4), 633
–642
(2003). https://doi.org/10.1046/j.1471-4159.2003.01508.x 0022-3042 Google Scholar
A. Mayevsky and G. G. Rogatsky,
“Mitochondrial function in vivo evaluated by NADH fluorescence: from animal models to human studies,”
Am. J. Physiol.: Cell Physiol., 292 C615
–C640
(2007). https://doi.org/10.1152/ajpcell.00249.2006 0363-6143 Google Scholar
S. Huang, A. A. Heikal, and W. W. Webb,
“Two-photon fluorescence spectroscopy and microscopy of NAD(P)H and flavoprotein,”
Biophys. J., 82 2811
–2825
(2002). https://doi.org/10.1016/S0006-3495(02)75621-X 0006-3495 Google Scholar
L. Pellerin and P. J. Magistretti,
“Let there be (NADH) light,”
Science, 305 50
–52
(2004). https://doi.org/10.1126/science.1100428 0036-8075 Google Scholar
C. Vignal, N. Mathevon, and S. Mottin,
“Audience drives male songbird response to partner’s voice,”
Nature (London), 430 448
–451
(2004). https://doi.org/10.1038/nature02645 0028-0836 Google Scholar
A. Van der Linden, M. Verhoye, V. Van Meir, I. Tindemans, M. Eens, P. Aabsi, and J. Balthazart,
“In vivo manganese-enhanced magnetic resonance imaging reveals connections and functional properties of the songbird vocal control system,”
Neuroscience (Oxford), 112 467
–474
(2002). 0306-4522 Google Scholar
N. Plesnila, C. Putz, M. Rinecker, J. Wiezorreck, L. Schleinkofer, A. Goetz, and W. Kuebler,
“Measurement of absolute values of hemoglobin oxygenation in the brain of small rodents by near infrared reflection spectrophotometry,”
J. Neurosci. Methods, 114 107
–117
(2002). https://doi.org/10.1016/S0165-0270(01)00487-3 0165-0270 Google Scholar
J. Culver, T. Durduran, D. Furuya, C. Cheung, J. Greenberg, and G. Yodh,
“Diffuse optical tomography of cerebral blood flow oxygenation and metabolism in rat during focal ischemia,”
J. Cereb. Blood Flow Metab., 23 911
–924
(2003). https://doi.org/10.1097/01.WCB.0000076703.71231.BB 0271-678X Google Scholar
C. Vignal, T. Boumans, B. Montcel, S. Ramstein, M. Verhoye, J. Van Audekerke, N. Mathevon, A. Van Der Linden, and S. Mottin,
“Measuring brain hemodynamic changes in a songbird: responses to hypercapnia measured with functional MRI and near-infrared spectroscopy,”
Phys. Med. Biol., 53 2457
–2470
(2008). https://doi.org/10.1088/0031-9155/53/10/001 0031-9155 Google Scholar
S. L. Jacques and D. S. Gareau,
“Confocal microscopy to measure tissue optical properties,”
Proc. SPIE, 6163 61630X
(2006). https://doi.org/10.1117/12.697298 0277-786X Google Scholar
D. S. Gareau,
“In vivo confocal microscopy in turbid media,”
Oregon Health Science Univ.,
(2006). Google Scholar
S. Jacques, R. Samatham, N. Choudhury, and D. S. Gareau,
“Specifying tissue optical properties using axial dependence of confocal reflectance images: confocal scanning laser microscopy and optical coherence tomography,”
Proc. SPIE, 6446 64460N
(2007). https://doi.org/10.1117/12.716535 0277-786X Google Scholar
R. Samatham, S. L. Jacques, and P. Campagnola,
“Optical properties of mutant versus wild-type mouse skin measured by reflectance-mode confocal scanning laser microscopy (rCSLM),”
J. Biomed. Opt., 13
(4), 041309
(2008). https://doi.org/10.1117/1.2953195 1083-3668 Google Scholar
T. Collier, D. Arifler, A. Malpica, M. Follen, and R. Richard-Kortum,
“Determination of epithelial tissue scattering coefficient using confocal microscopy,”
IEEE J. Sel. Top. Quantum Electron., 9
(2), 307
–313
(2003). https://doi.org/10.1109/JSTQE.2003.814413 1077-260X Google Scholar
T. Collier, M. Follen, A. Malpica, and R. Richards-Kortum,
“Sources of scattering in cervical tissue: determination of the scattering coefficient by confocal microscopy,”
Appl. Opt., 44 2072
–2081
(2005). https://doi.org/10.1364/AO.44.002072 0003-6935 Google Scholar
M. Patterson, B. Wilson, and D. Wyman,
“The propagation of optical radiation in tissue i. models of radiation transport and their application,”
Lasers Med. Sci., 6
(2), 155
–168
(1991). https://doi.org/10.1007/BF02032543 0268-8921 Google Scholar
A. Ishimaru, Wave Propagation and Scattering in Random Media, Volume I: Single Scattering and Transport Theory, Academic Press, New York
(1978). Google Scholar
L. Henyey and J. Greenstein,
“Diffuse radiation in the galaxy,”
Astrophys. J., 93 70
–83
(1941). https://doi.org/10.1086/144246 0004-637X Google Scholar
E. A. Genina, A. N. Bashkatov, and V. V. Tuchin,
“Optical clearing of cranial bone,”
Adv. Opt. Technol., 2008 267867
(2008). https://doi.org/10.1155/2008/267867 Google Scholar
M. Firbank, M. Hiraoka, M. Essenpreis, and D. Delpy,
“Measurement of the optical properties of the skull in the wavelength range ,”
Phys. Med. Biol., 38
(4), 503
–510
(1993). https://doi.org/10.1088/0031-9155/38/4/002 0031-9155 Google Scholar
S. Ramstein, C. Vignal, N. Mathevon, and S. Mottin,
“In vivo and noninvasive measurement of songbird head’s optical properties,”
Appl. Opt., 44 6197
–6203
(2005). https://doi.org/10.1364/AO.44.006197 0003-6935 Google Scholar
W. Cheong, S. Prahl, and A. Welch,
“A review of the optical properties of biological tissues,”
IEEE J. Quantum Electron., 26 2166
–2185
(1990). https://doi.org/10.1109/3.64354 0018-9197 Google Scholar
P. Theer and W. Denk,
“On the fundamental imaging-depth limit in two-photon microscopy,”
J. Opt. Soc. Am. A, 23
(12), 3139
–3149
(2006). https://doi.org/10.1364/JOSAA.23.003139 0740-3232 Google Scholar
C. Wang, L. Qiao, Z. Mao, Y. Cheng, and Z. Xu,
“Reduced deep-tissue image degradation in three-dimensional multiphoton microscopy with concentric two-color two-photon fluorescence excitation,”
J. Opt. Soc. Am. B, 25
(6), 976
–982
(2008). https://doi.org/10.1364/JOSAB.25.000976 0740-3224 Google Scholar
A. Leray and J. Mertz,
“Rejection of two-photon fluorescence background in thick tissue by differential aberration imaging,”
Opt. Express, 14
(22), 10565
–10573
(2006). https://doi.org/10.1364/OE.14.010565 1094-4087 Google Scholar
G. Zhu, J. van Howe, M. Durst, W. Zipfel, and C. Xu,
“Simultaneous spatial and temporal focusing of femtosecond pulses,”
Opt. Express, 13
(6), 2153
–2159
(2005). https://doi.org/10.1364/OPEX.13.002153 1094-4087 Google Scholar
|


